-
-
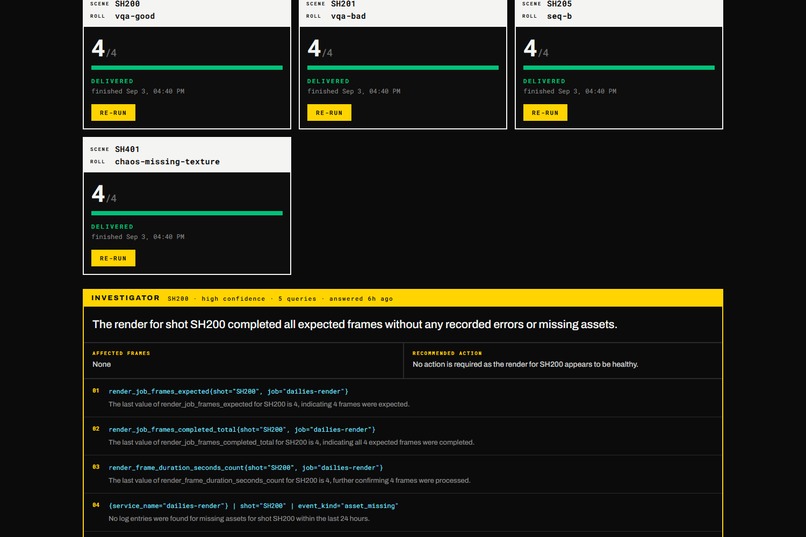
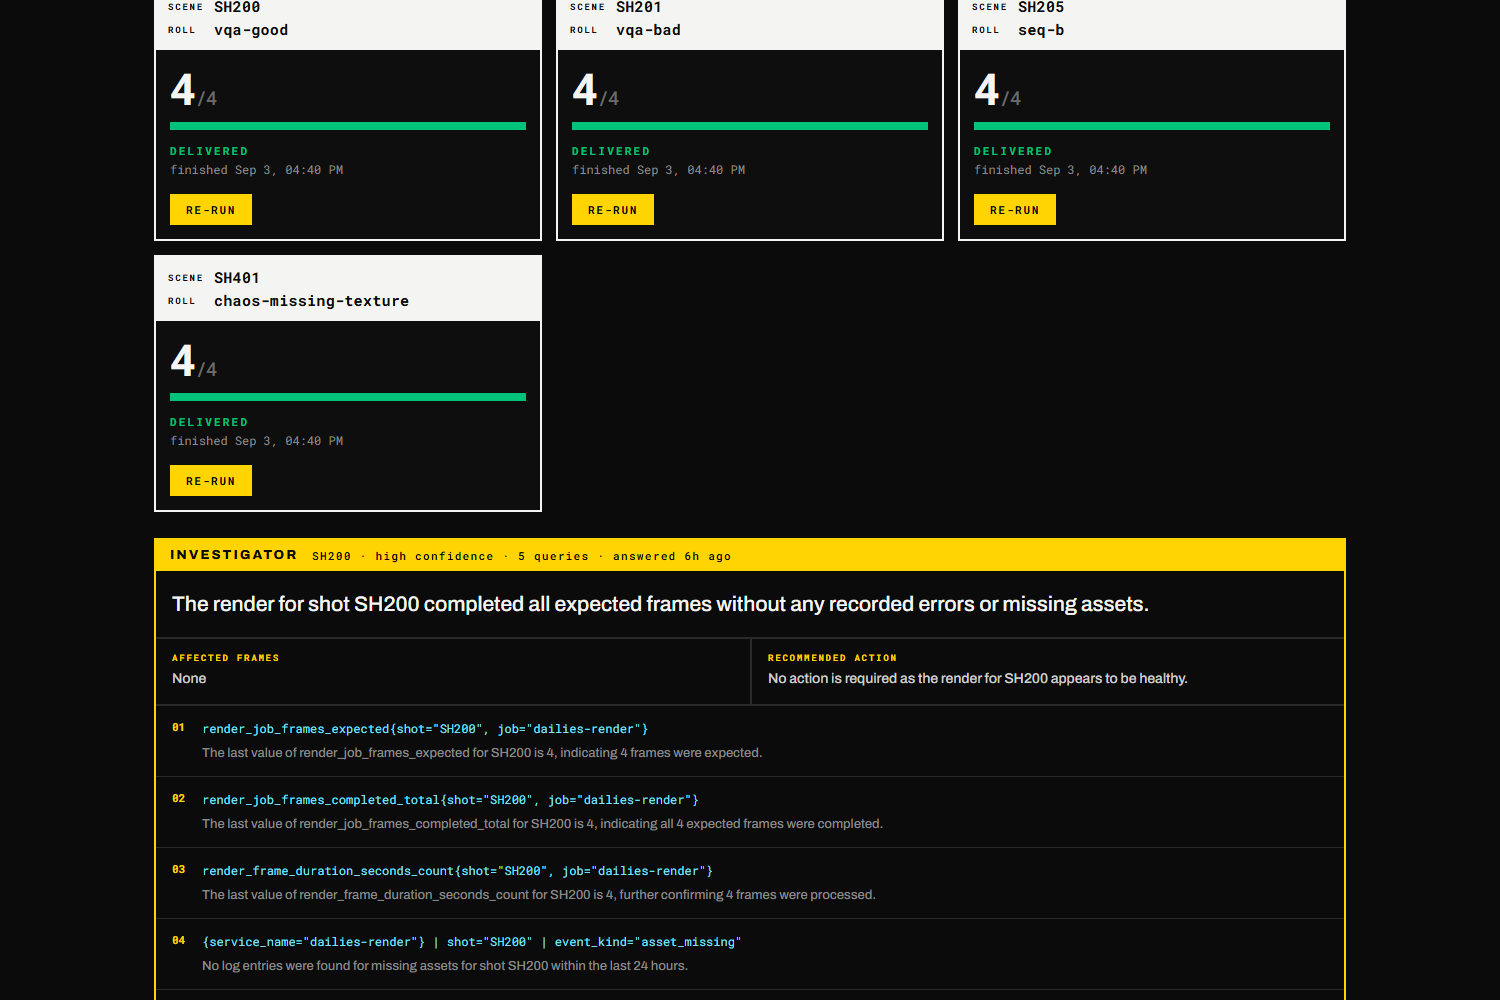
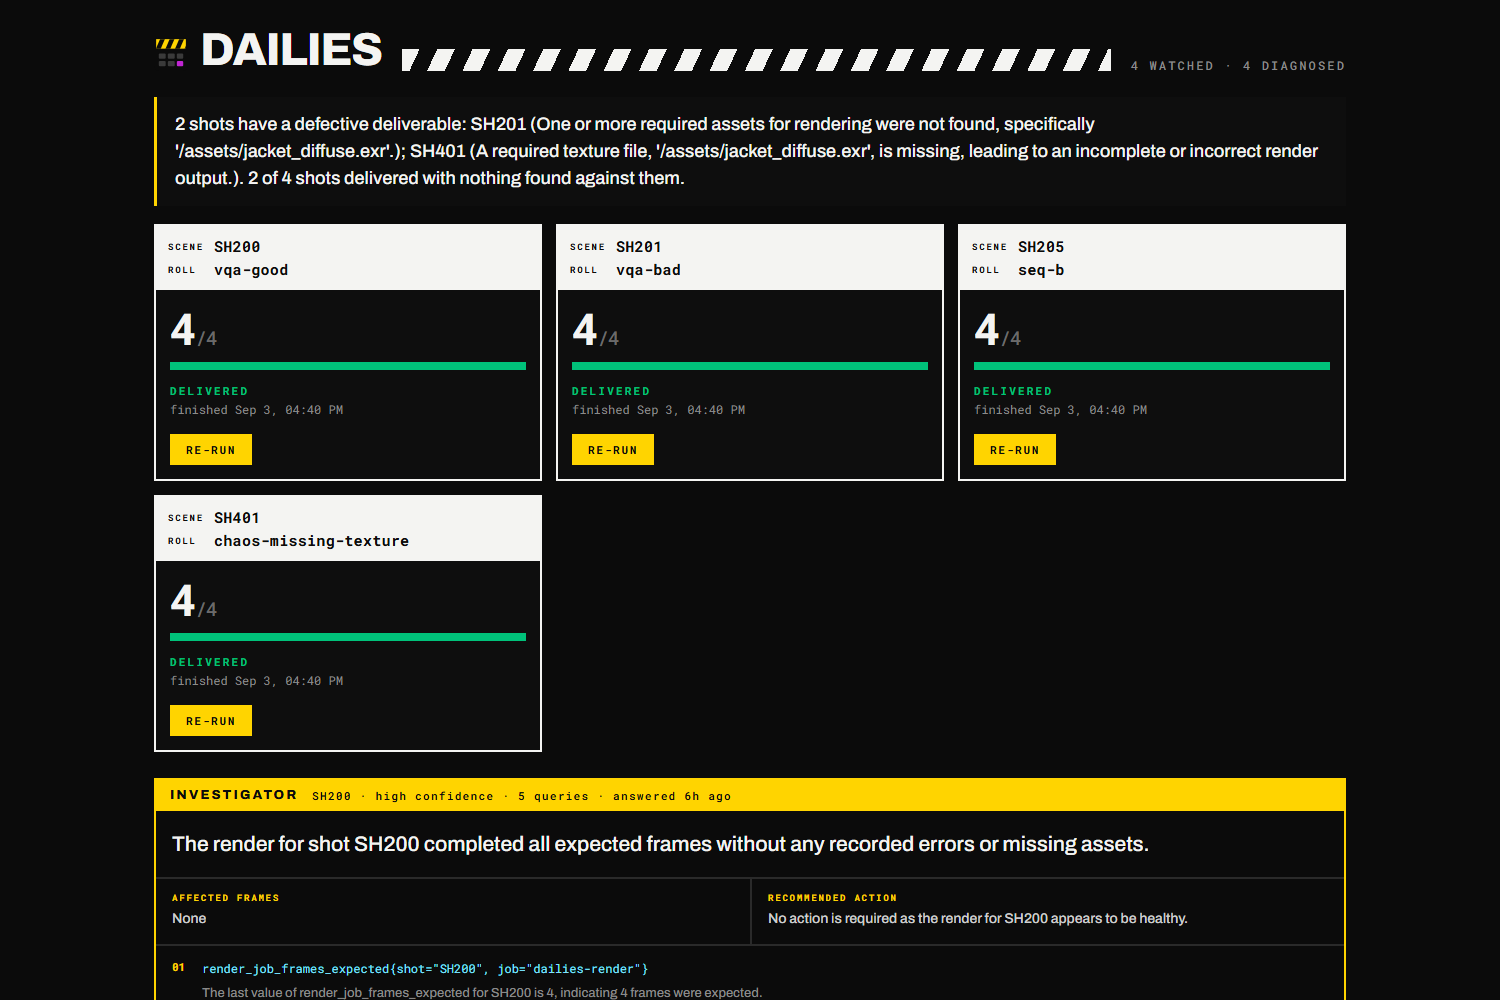
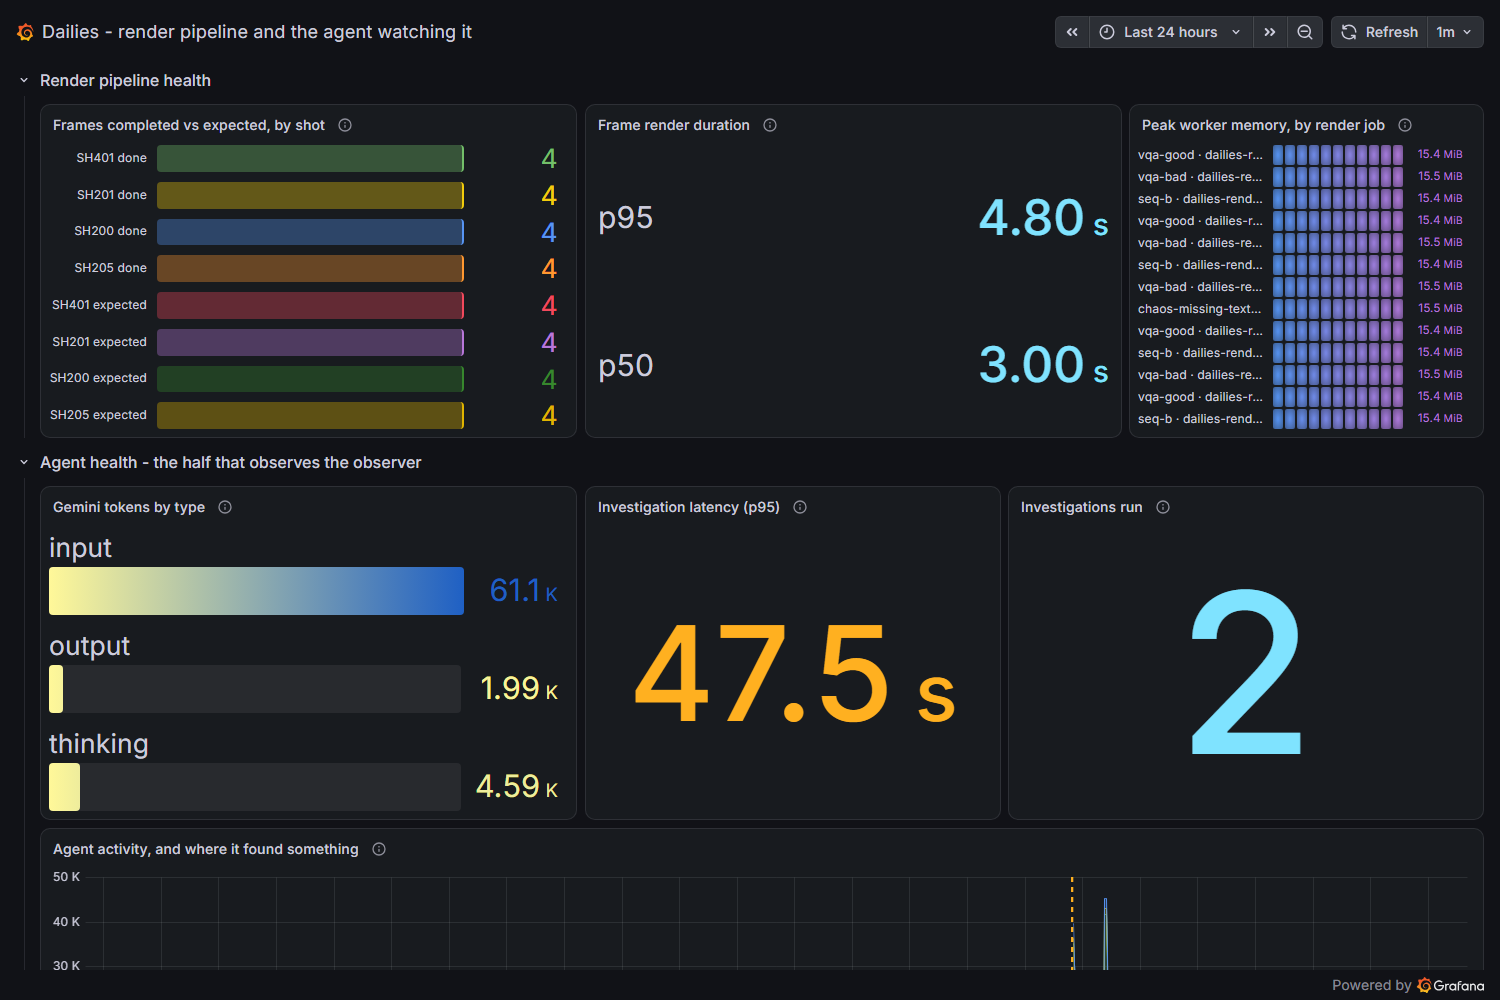
SH200 and SH201. Four of four frames each, no errors against either. Every number a scheduler looks at says they are identical.
-
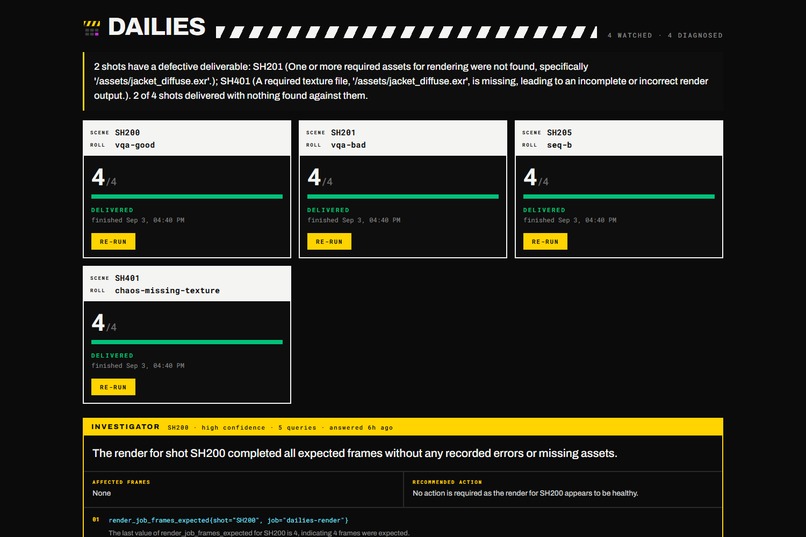
The board, rebuilt from Prometheus on every load. Nothing is seeded: an empty board means no renders, not an empty database.
-
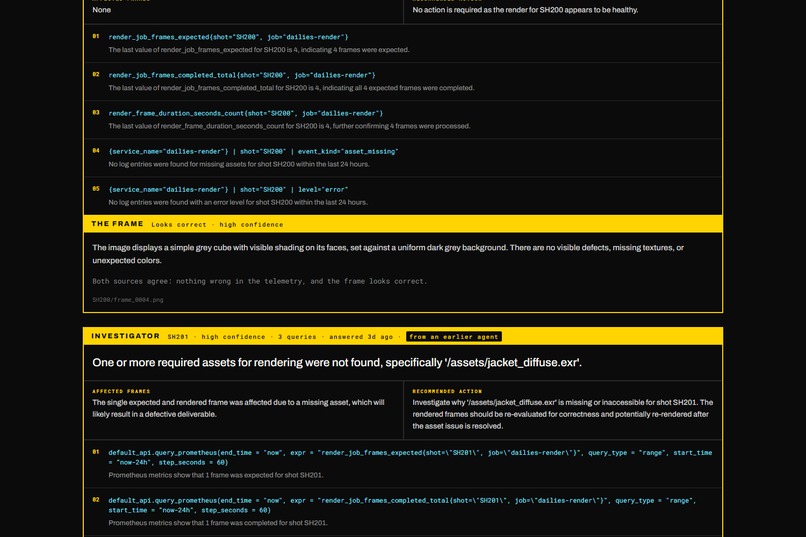
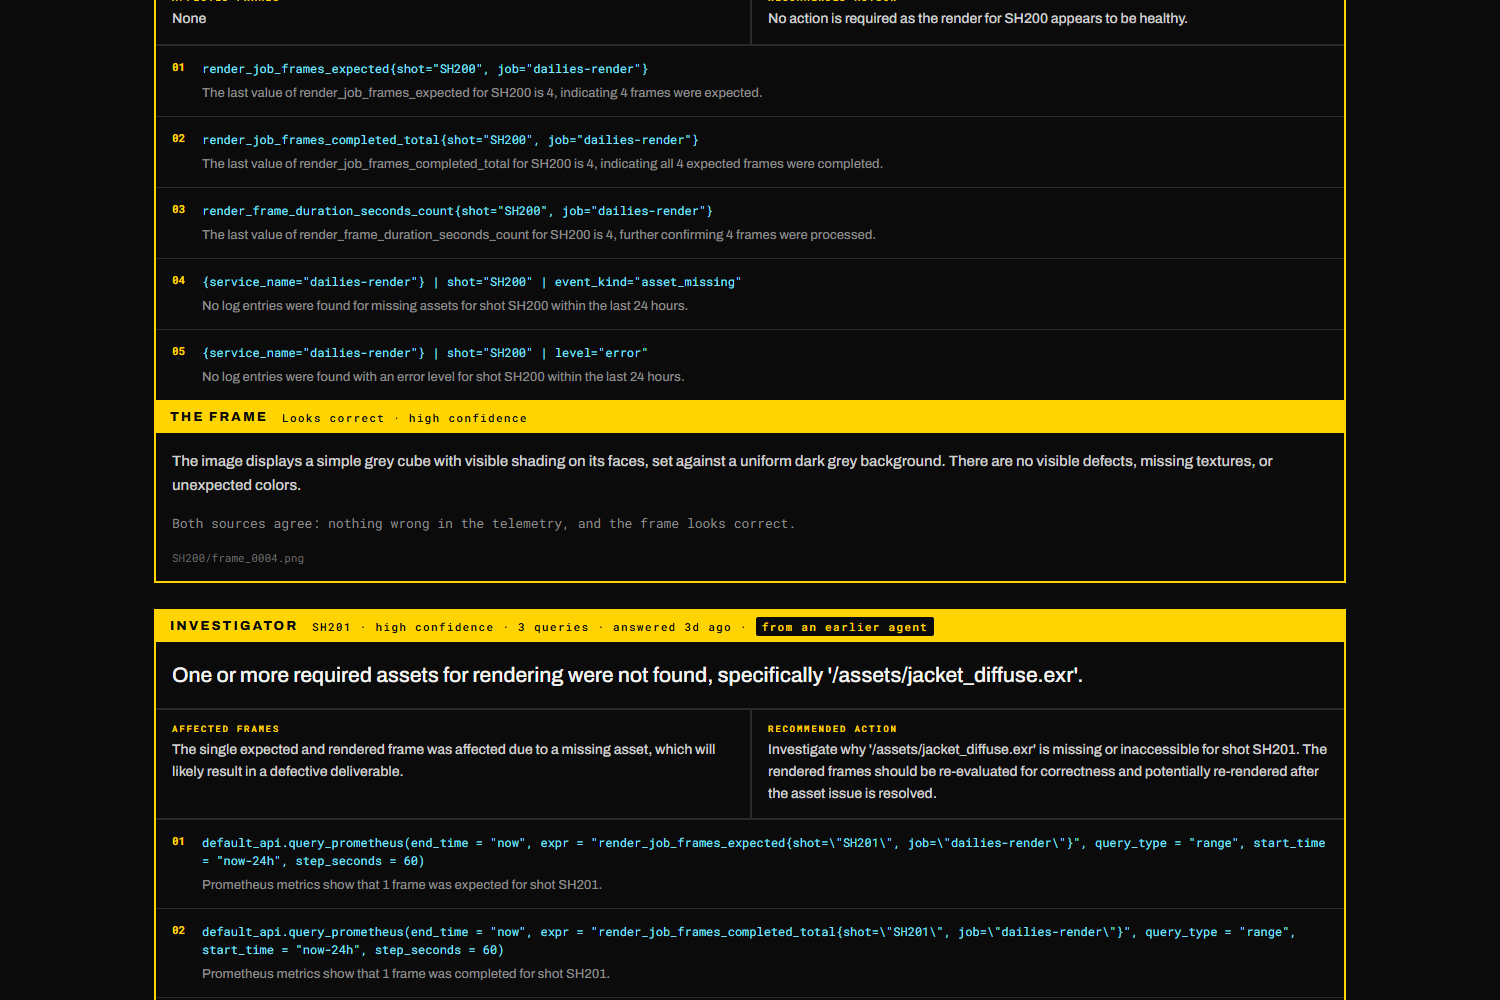
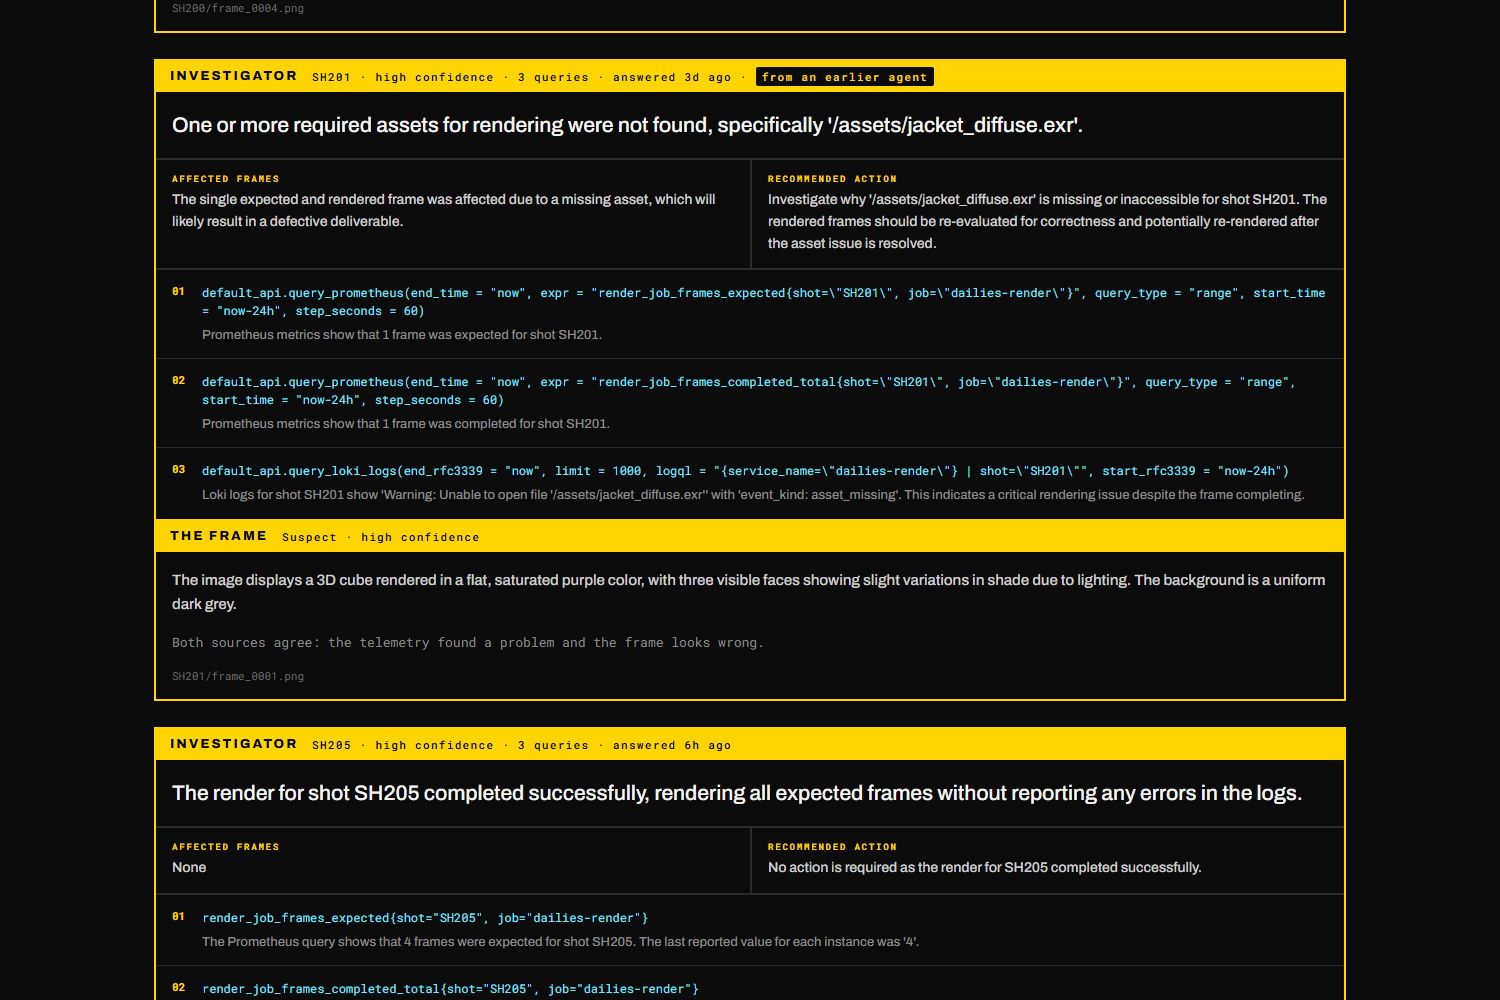
Every claim carries its query. The schema refuses a cause with no evidence behind it, so the board can print the queries verbatim.
-
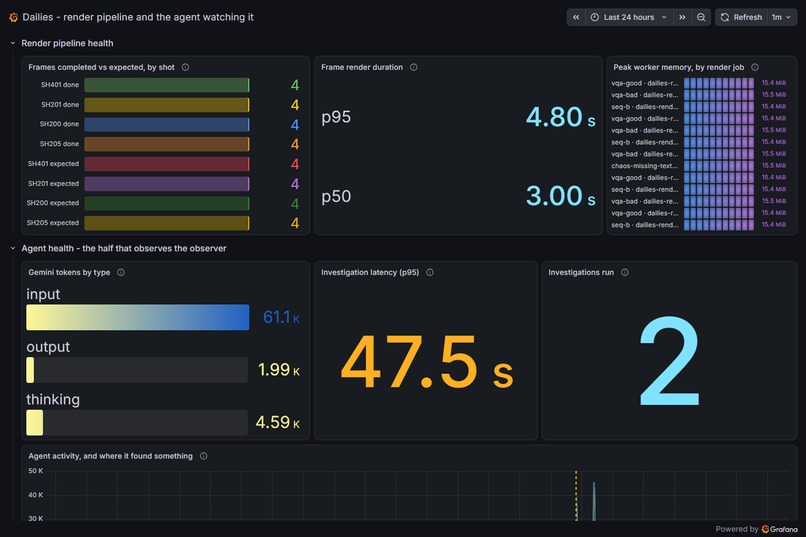
One dashboard in two halves: the render farm, and the Gemini agent reading the render farm. Published, no login needed.
-
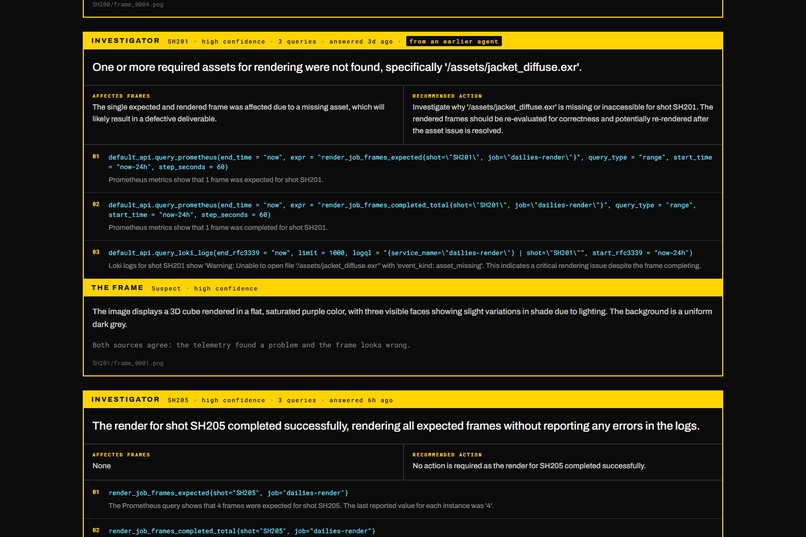
The frame, judged on its own. The visual check is told nothing about this shot's telemetry, so it is free to disagree with it.
The failure nobody catches
A render farm knows how to handle a crash. A frame that runs out of memory exits non-zero, the scheduler re-queues it, and everyone moves on.
The failure that survives is the quiet one. A texture fails to resolve on the worker, Blender falls back to a flat colour, prints a warning to stdout, and exits 0. The frame saves. The frame count is complete. The durations look normal. Every automated system in the pipeline calls it a success, and the jacket is magenta.
Nobody finds out until a human watches the dailies. That is not a hypothetical. It is how render farms describe their own worst day:
"The material will fail to load silently, rendering as black. The render completes without error messages, but the output is incorrect."
"Even if only one texture is missing, the render will submit a 'done' status. You discover it after the render completes, and you have already paid for those broken frames." (iRender)
What it does
A Blender render on Cloud Run emits OpenTelemetry metrics and logs to Grafana Cloud. The board reconstructs every shot from Prometheus, so it shows the farm and not a database. There is no seeding step and nothing is fixtured.
Press Diagnose and two independent things happen. A Gemini agent, built on the Google Agent Development Kit, investigates through the Grafana MCP server: it queries Prometheus for frame progress, pivots to Loki for what the renderer actually said, and answers with a cause bound to the queries supporting it. Separately, Gemini opens the frame the render actually produced and says whether the picture is wrong.
The two checks cannot see each other, on purpose. The visual check is told how renderers signal a failed texture and nothing at all about this shot's telemetry, so it is free to disagree. Two sources that cannot disagree are one source wearing two hats. The board says which case it is.
Live right now, same agent, same tools:
| Shot | Telemetry says | The frame says |
|---|---|---|
| SH200 | 4 of 4 frames, no warnings | looks_correct: "a simple grey cube" |
| SH201 | 4 of 4 frames, and an asset_missing warning | suspect: "flat, saturated magenta, no texture" |
SH201 is the whole argument. Every number a scheduler looks at says success. The evidence is one log line and the picture.
Every claim carries its query
A model asked for a cause will produce one whether or not it looked. So the diagnosis schema refuses an answer with no evidence, and the board renders the queries verbatim, numbered, beside what each returned. Paste one into Grafana and check it in ten seconds. The visual verdict names the frame it judged, for the same reason.
It also means the agent says it could not read a shot rather than reassuring you. Given a shot with no telemetry at all, an earlier version answered "the render completed successfully without any logged errors". It invented no fault, and it still asserted an outcome from an empty result. That is the same error facing the other way, and the more dangerous direction: a supervisor told a broken shot is fine stops looking. It now reports that the telemetry could not be read.
Measured, not asserted
The agent is scored against telemetry whose answer is known, as a Cloud Run job. Only the network is faked: the real MCP wrapper, the real prompt, a real Gemini call, the real schema.
missing_texture      pass   named jacket_diffuse.exr from the logs
clean_render         pass   no false positive on a silent render
stalled_no_errors    pass   "23 frames not completed out of 40"
no_telemetry         pass   "could not be read from either source"
4/4

visual-defect recall, over eight frames the farm rendered
recall 4/4 caught, 0/4 false alarms
The clean frames are the half that makes the number mean anything. A check that answers "suspect" to everything catches every defect, so recall over broken frames alone is unfalsifiable.
Break it yourself
python -m dailies_chaos inject missing-texture --shot SH400
That renders a real frame with a real fault and puts it on the board. Diagnose it and the agent names the missing asset while the frame independently comes back suspect. Nothing about that shot was seeded; it did not exist a minute earlier.
How it is built
- Google Cloud: Cloud Run services and jobs, Cloud Scheduler, Artifact Registry, Cloud Build, Cloud Storage, Secret Manager, Vertex AI. All Terraform-managed, including the MCP server.
- Gemini via the Agent Development Kit, with a JSON response schema that puts the evidence requirement in the schema instead of asking for it in a prompt.
- Grafana: the self-hosted
grafana/mcp-grafanaserver on Cloud Run, private to the runtime service account, its token never leaving Secret Manager. The investigator has no other route to Prometheus or Loki, so the MCP connection is load-bearing: remove it and the project does not degrade, it stops. The agent also writes back, and a finding lands on the Grafana timeline as an annotation, through MCP. - A published dashboard in two halves: the render farm, and underneath it the agent that reads the render farm, with its own token spend and latency. An agent trusted with a deadline is itself a pipeline.
- The renderer is real. Blender 4.5 renders actual frames in a Cloud Run job and a parser turns its stdout into typed events. The missing-texture case is induced for real, never mocked.
What driving it taught us
Built test-first, then driven against live infrastructure, which found defect after defect a green suite could not. The same shape every time: a wrong configuration produced an empty result rather than an error.
A Gemini model id that exists on the Gemini API and 404s on Vertex, while every test injected a fake model. A Cloud Run hostname the MCP server refused. A Loki stream selector on a label that is only structured metadata. A PromQL step wider than the staleness window. An OTel unit suffix appended to a metric name. A gcsfuse directory placeholder Gemini rejected as an invalid image.
The best example happened to this project itself. The board is rebuilt from telemetry on every load, so when Grafana briefly failed it went empty, and said "No shots are being watched yet. Run a render and this board fills itself." True for an idle farm, false for a broken telemetry source, and it was the reassuring answer. It now says which of the two happened, and that fix is what surfaced the intermittent Grafana 503 underneath it.
An empty result is not an absence, and a system that cannot tell them apart will confidently tell you everything is fine.
Honest about the alternative
Studios already guard against missing assets, and well: farms inspect scene files for unlinked dependencies before a job starts, and a good pre-flight path checker eliminates most of these failures.
Dailies is not a replacement and does not claim to be. A pre-flight check validates what is true at submission and cannot see the worker. A mount that drops, a permission change, a path valid on one node and not another, an asset overwritten after submit: those resolve at submit time and fail at render time, and the only place they appear is in telemetry and in the picture.
Built With
- blender
- cloud-run
- fastapi
- gemini
- google-adk
- google-cloud
- grafana
- grafana-cloud
- loki
- mcp
- next.js
- opentelemetry
- prometheus
- python
- terraform
- typescript
- vertex-ai
