-
-
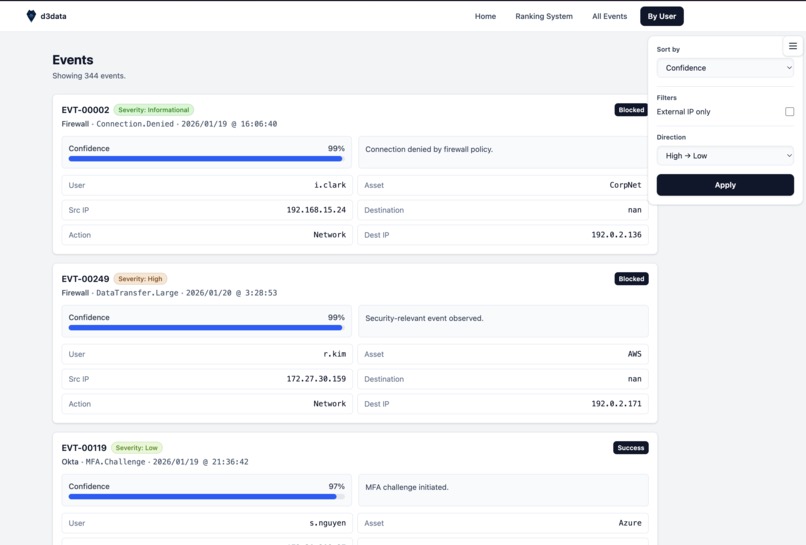
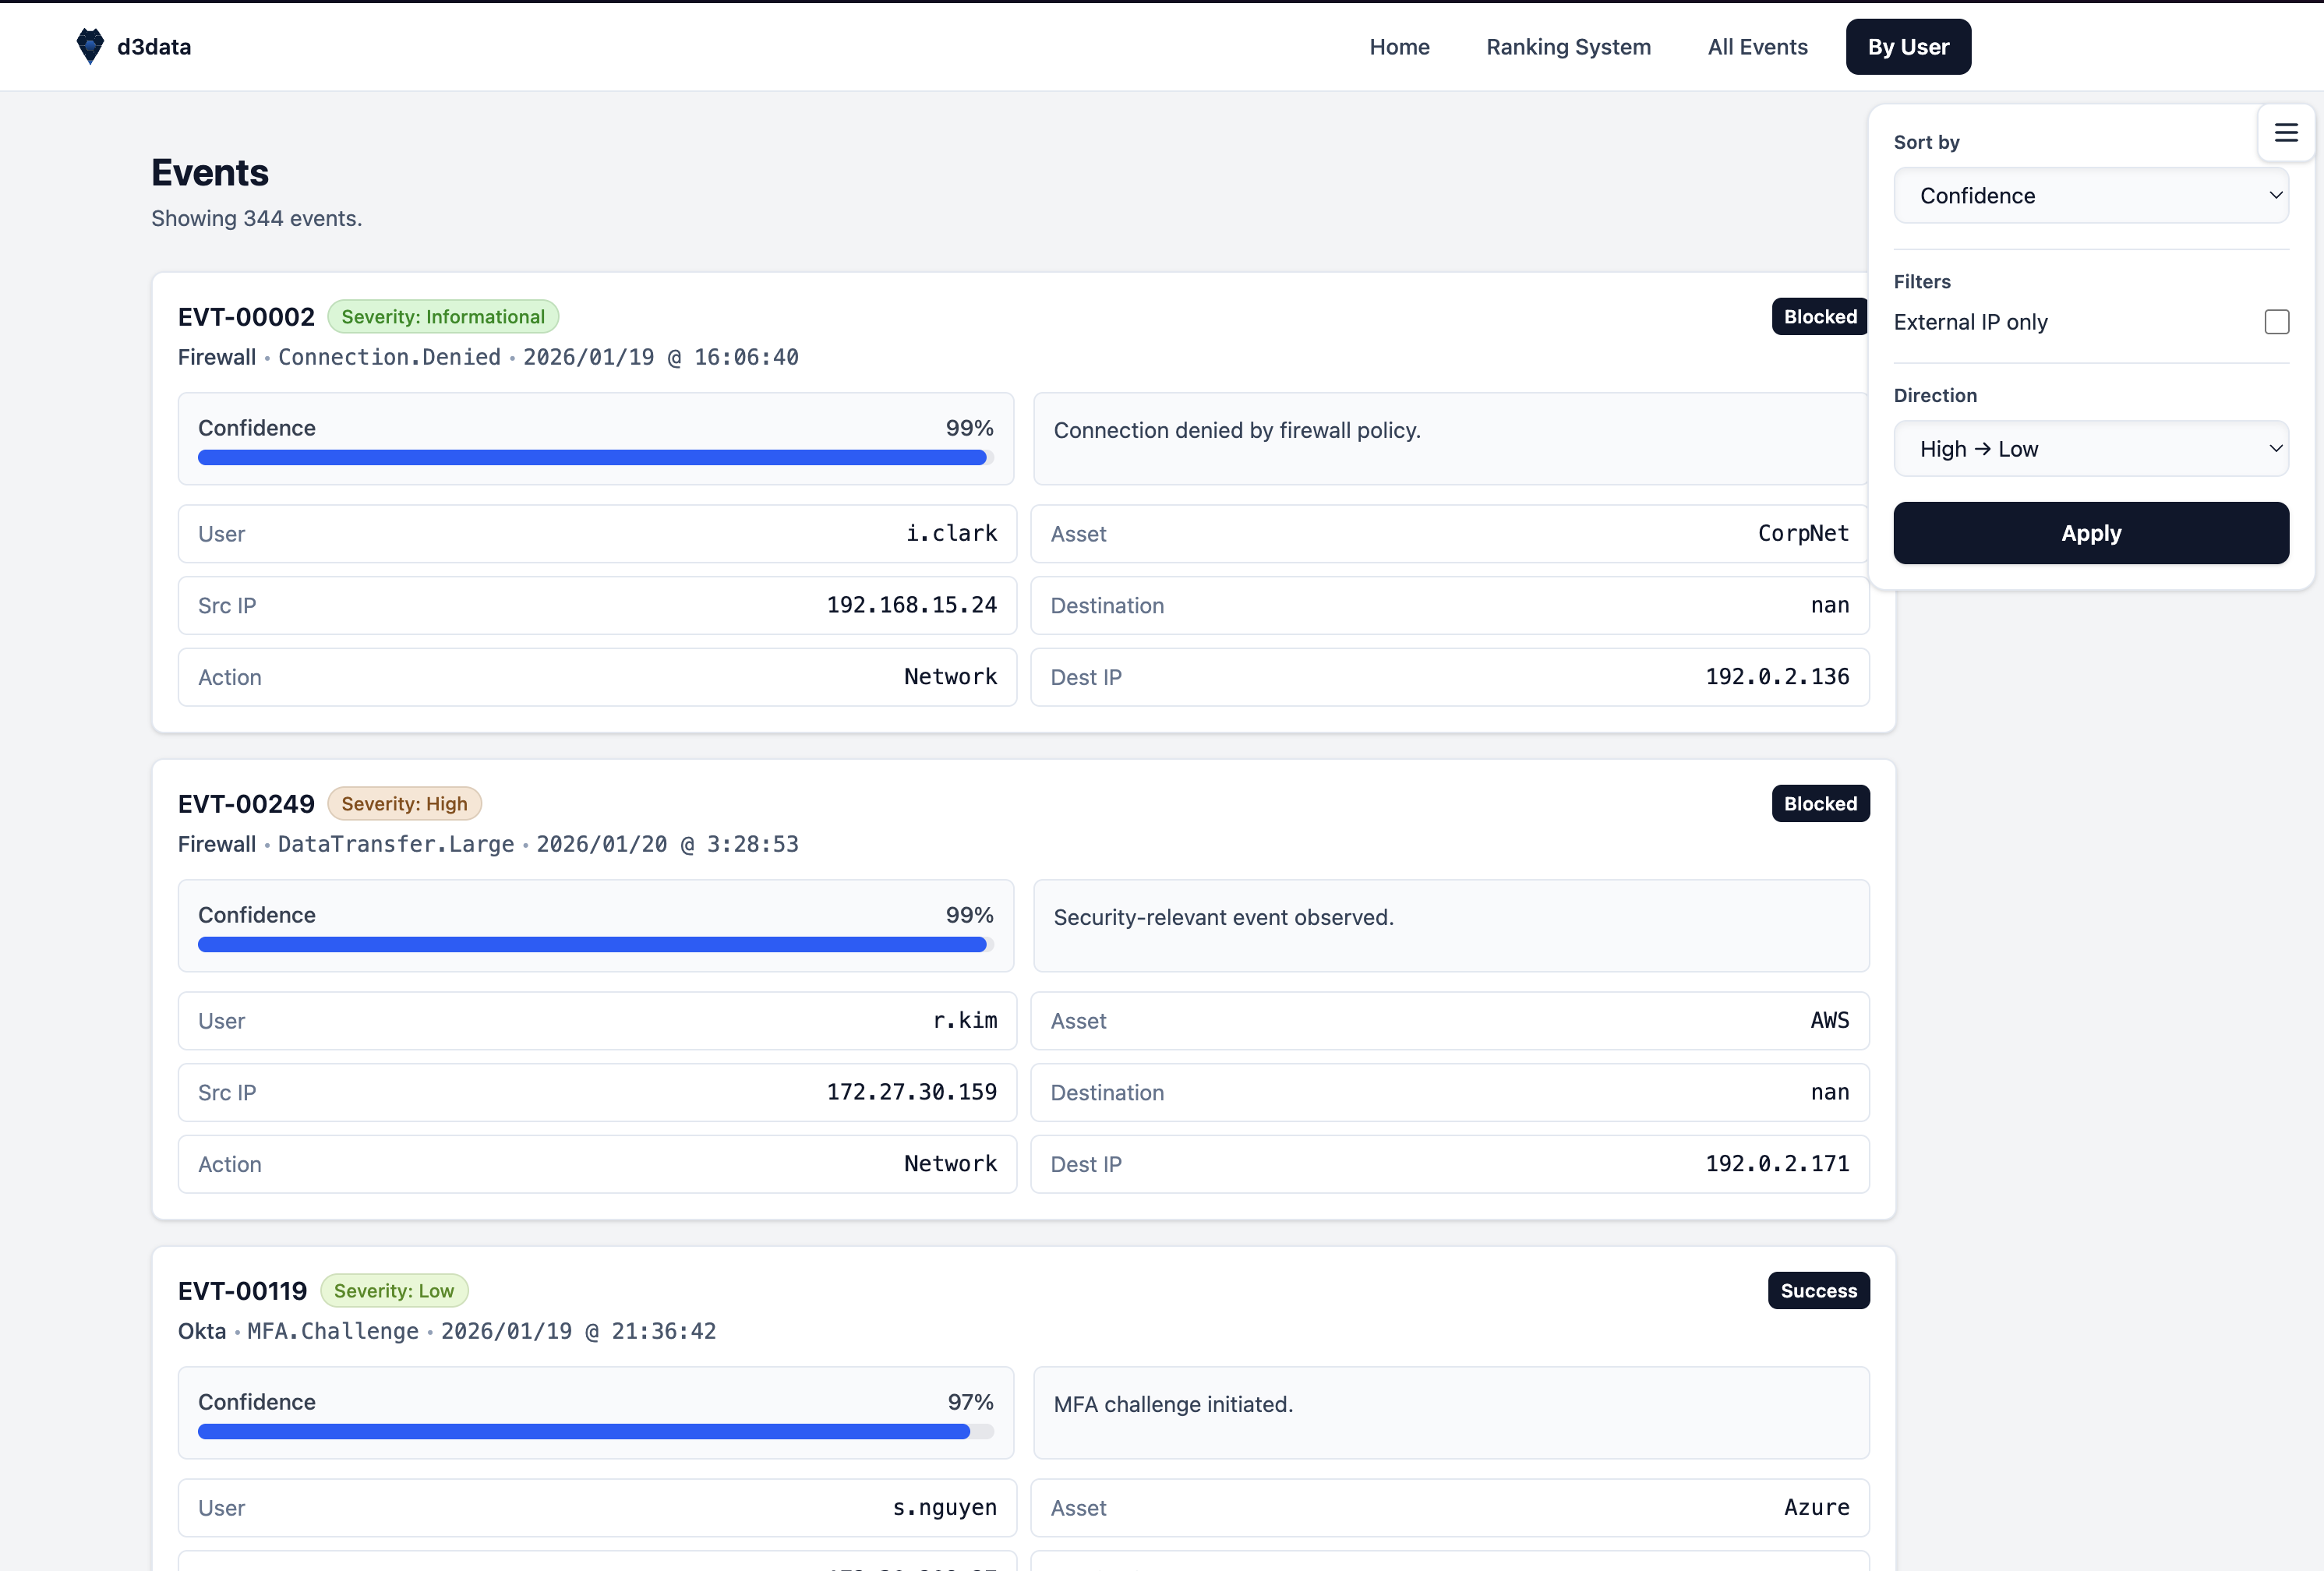
Page to see all the events.
-
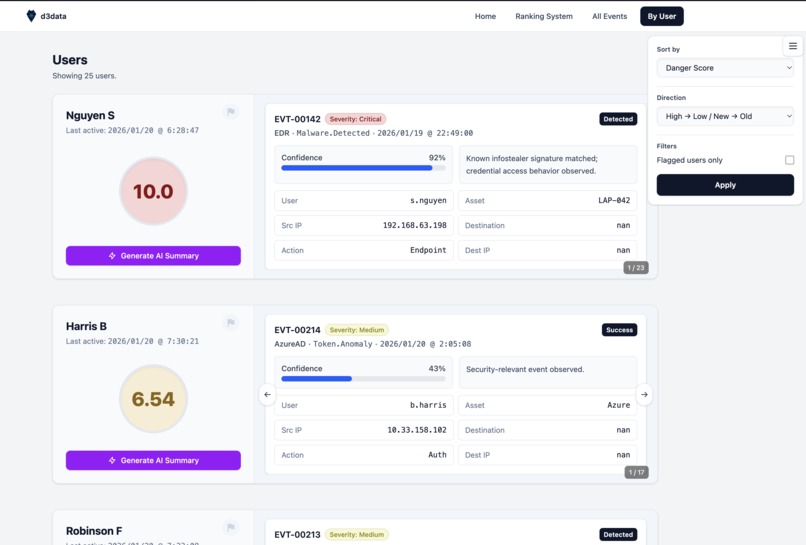
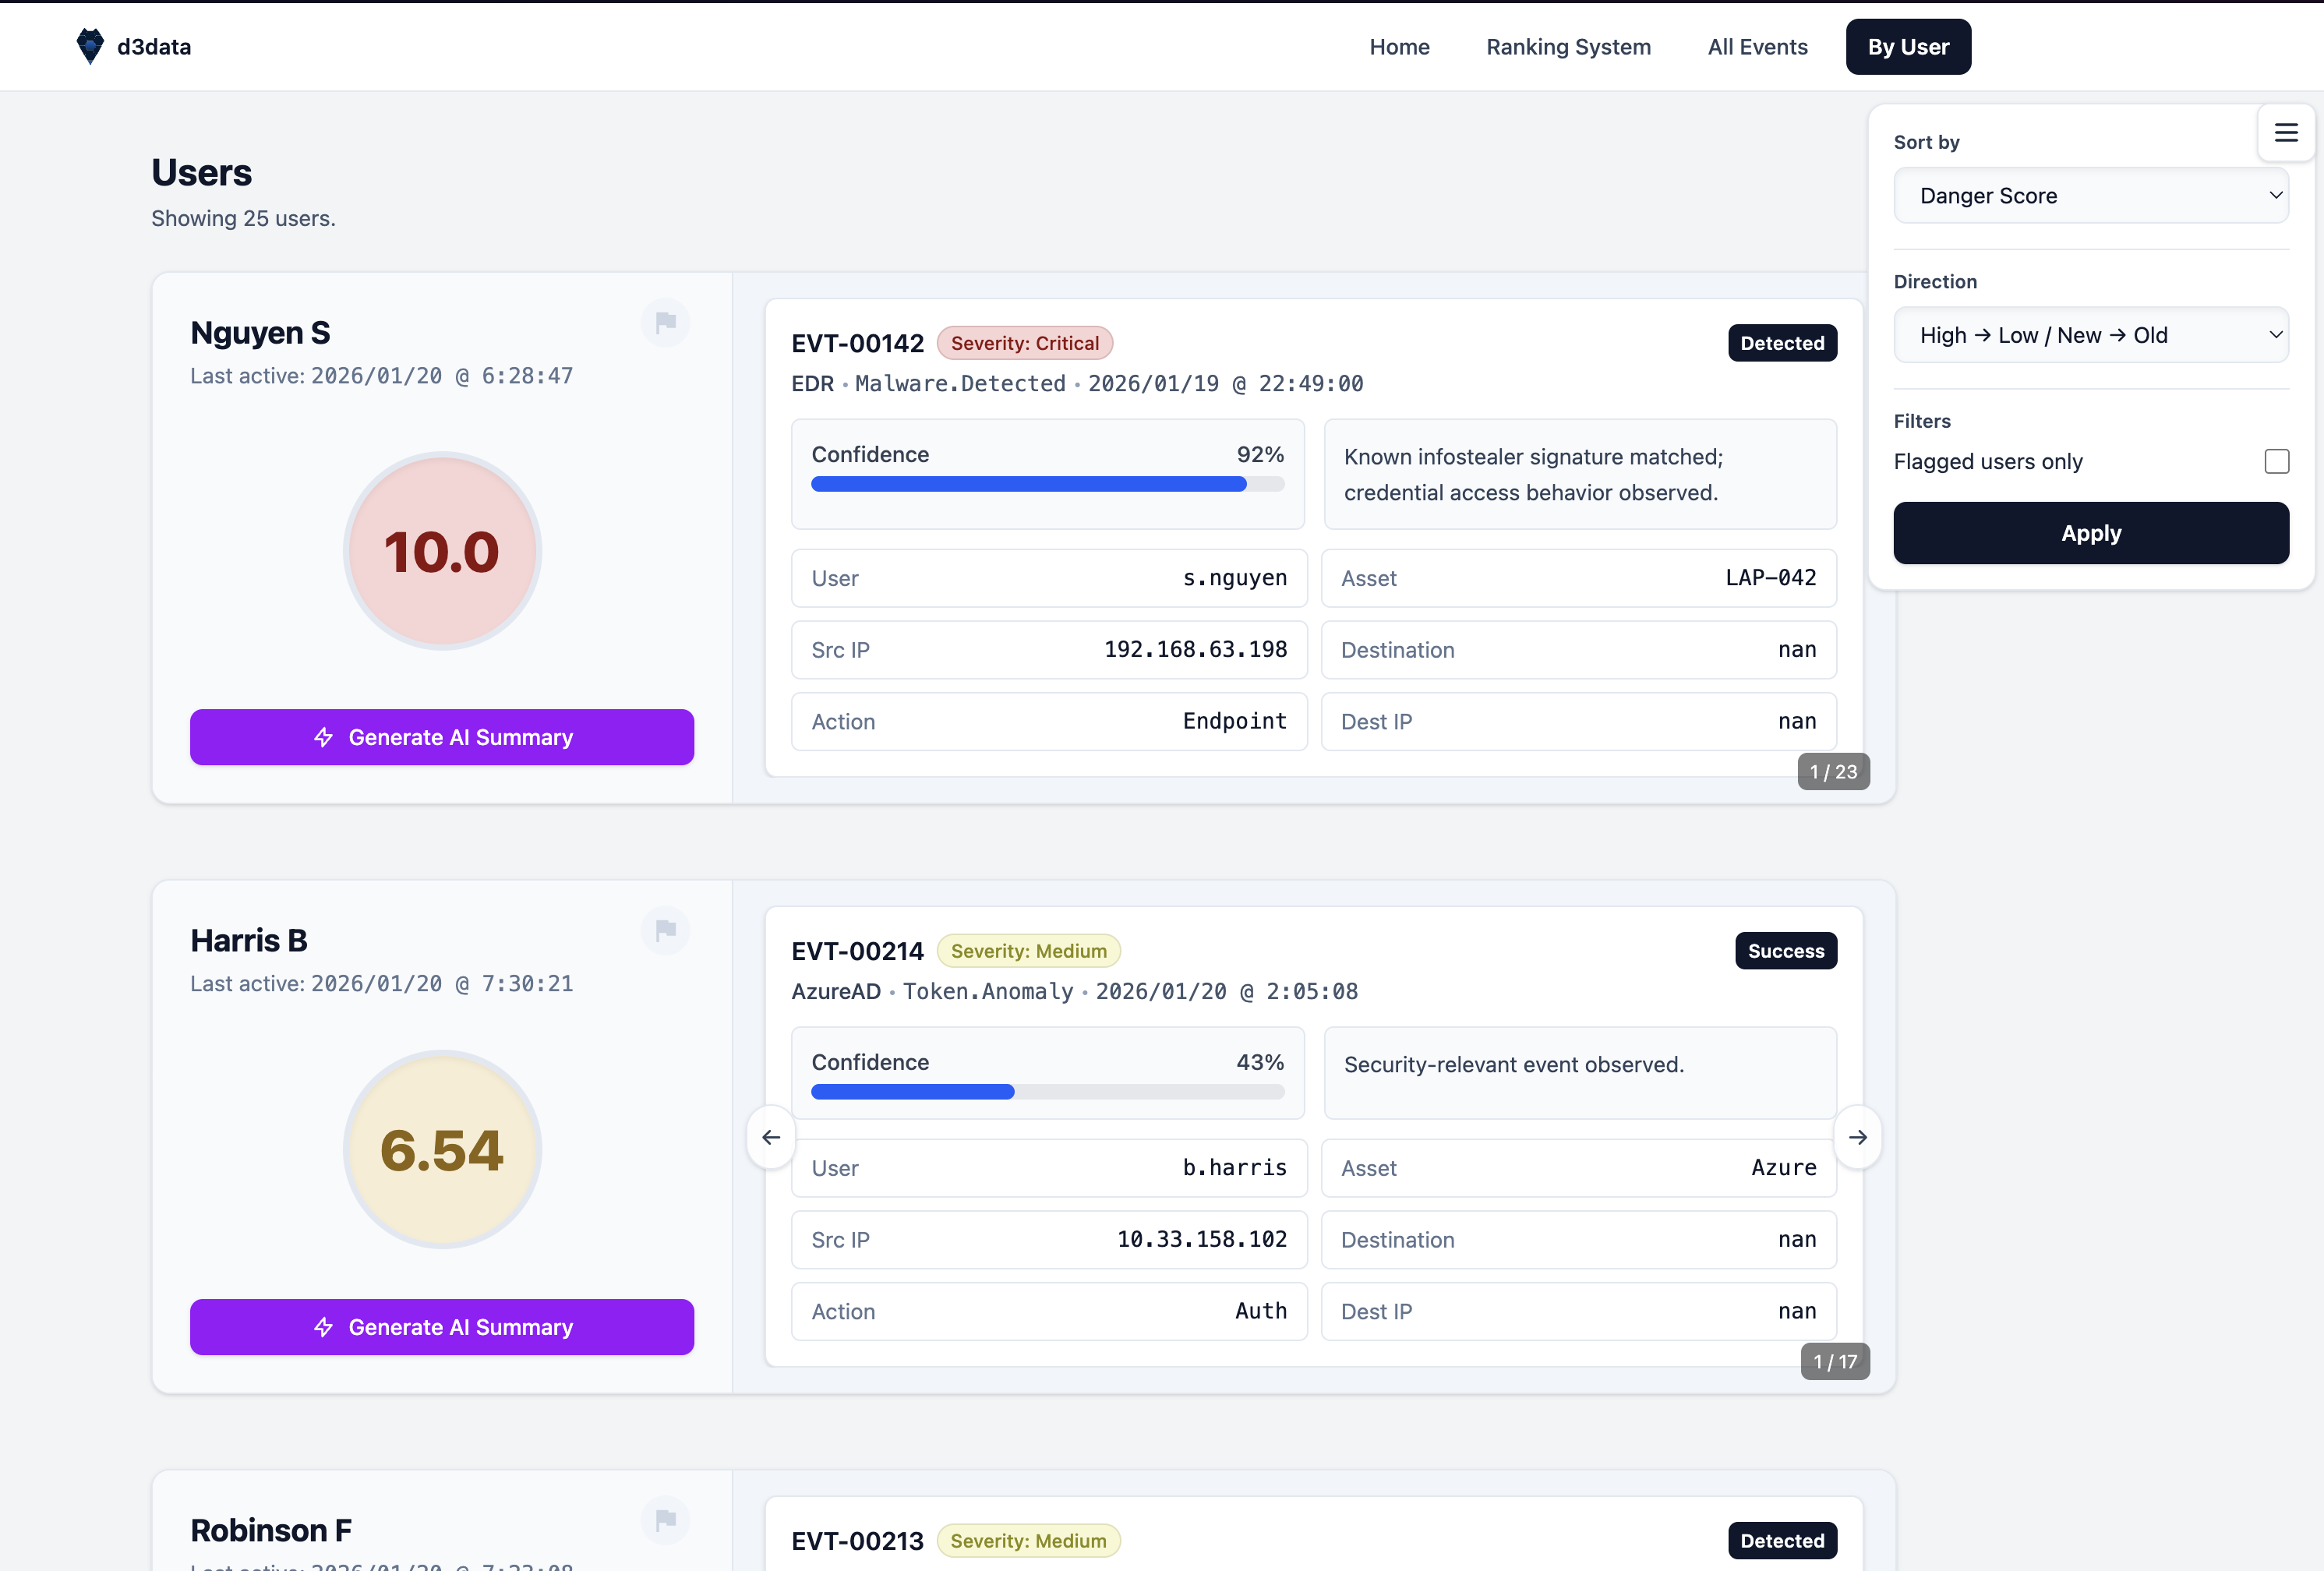
Main page to be used where it is sorted by user
-
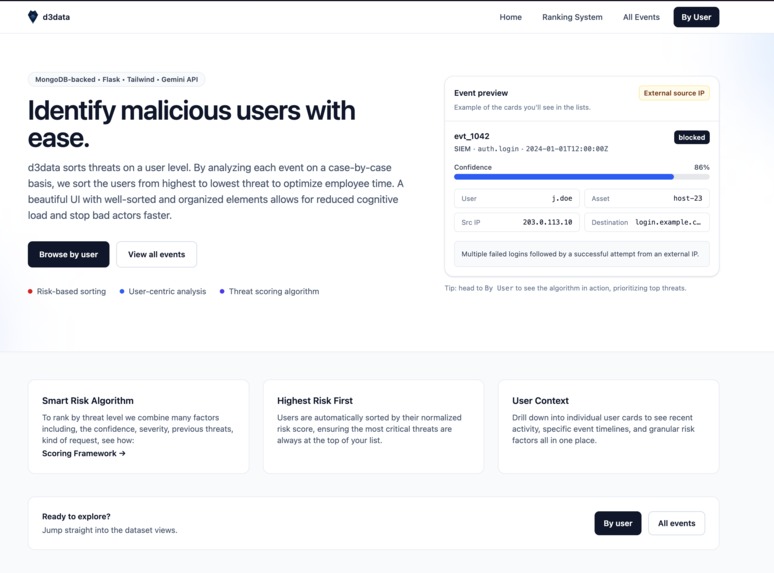
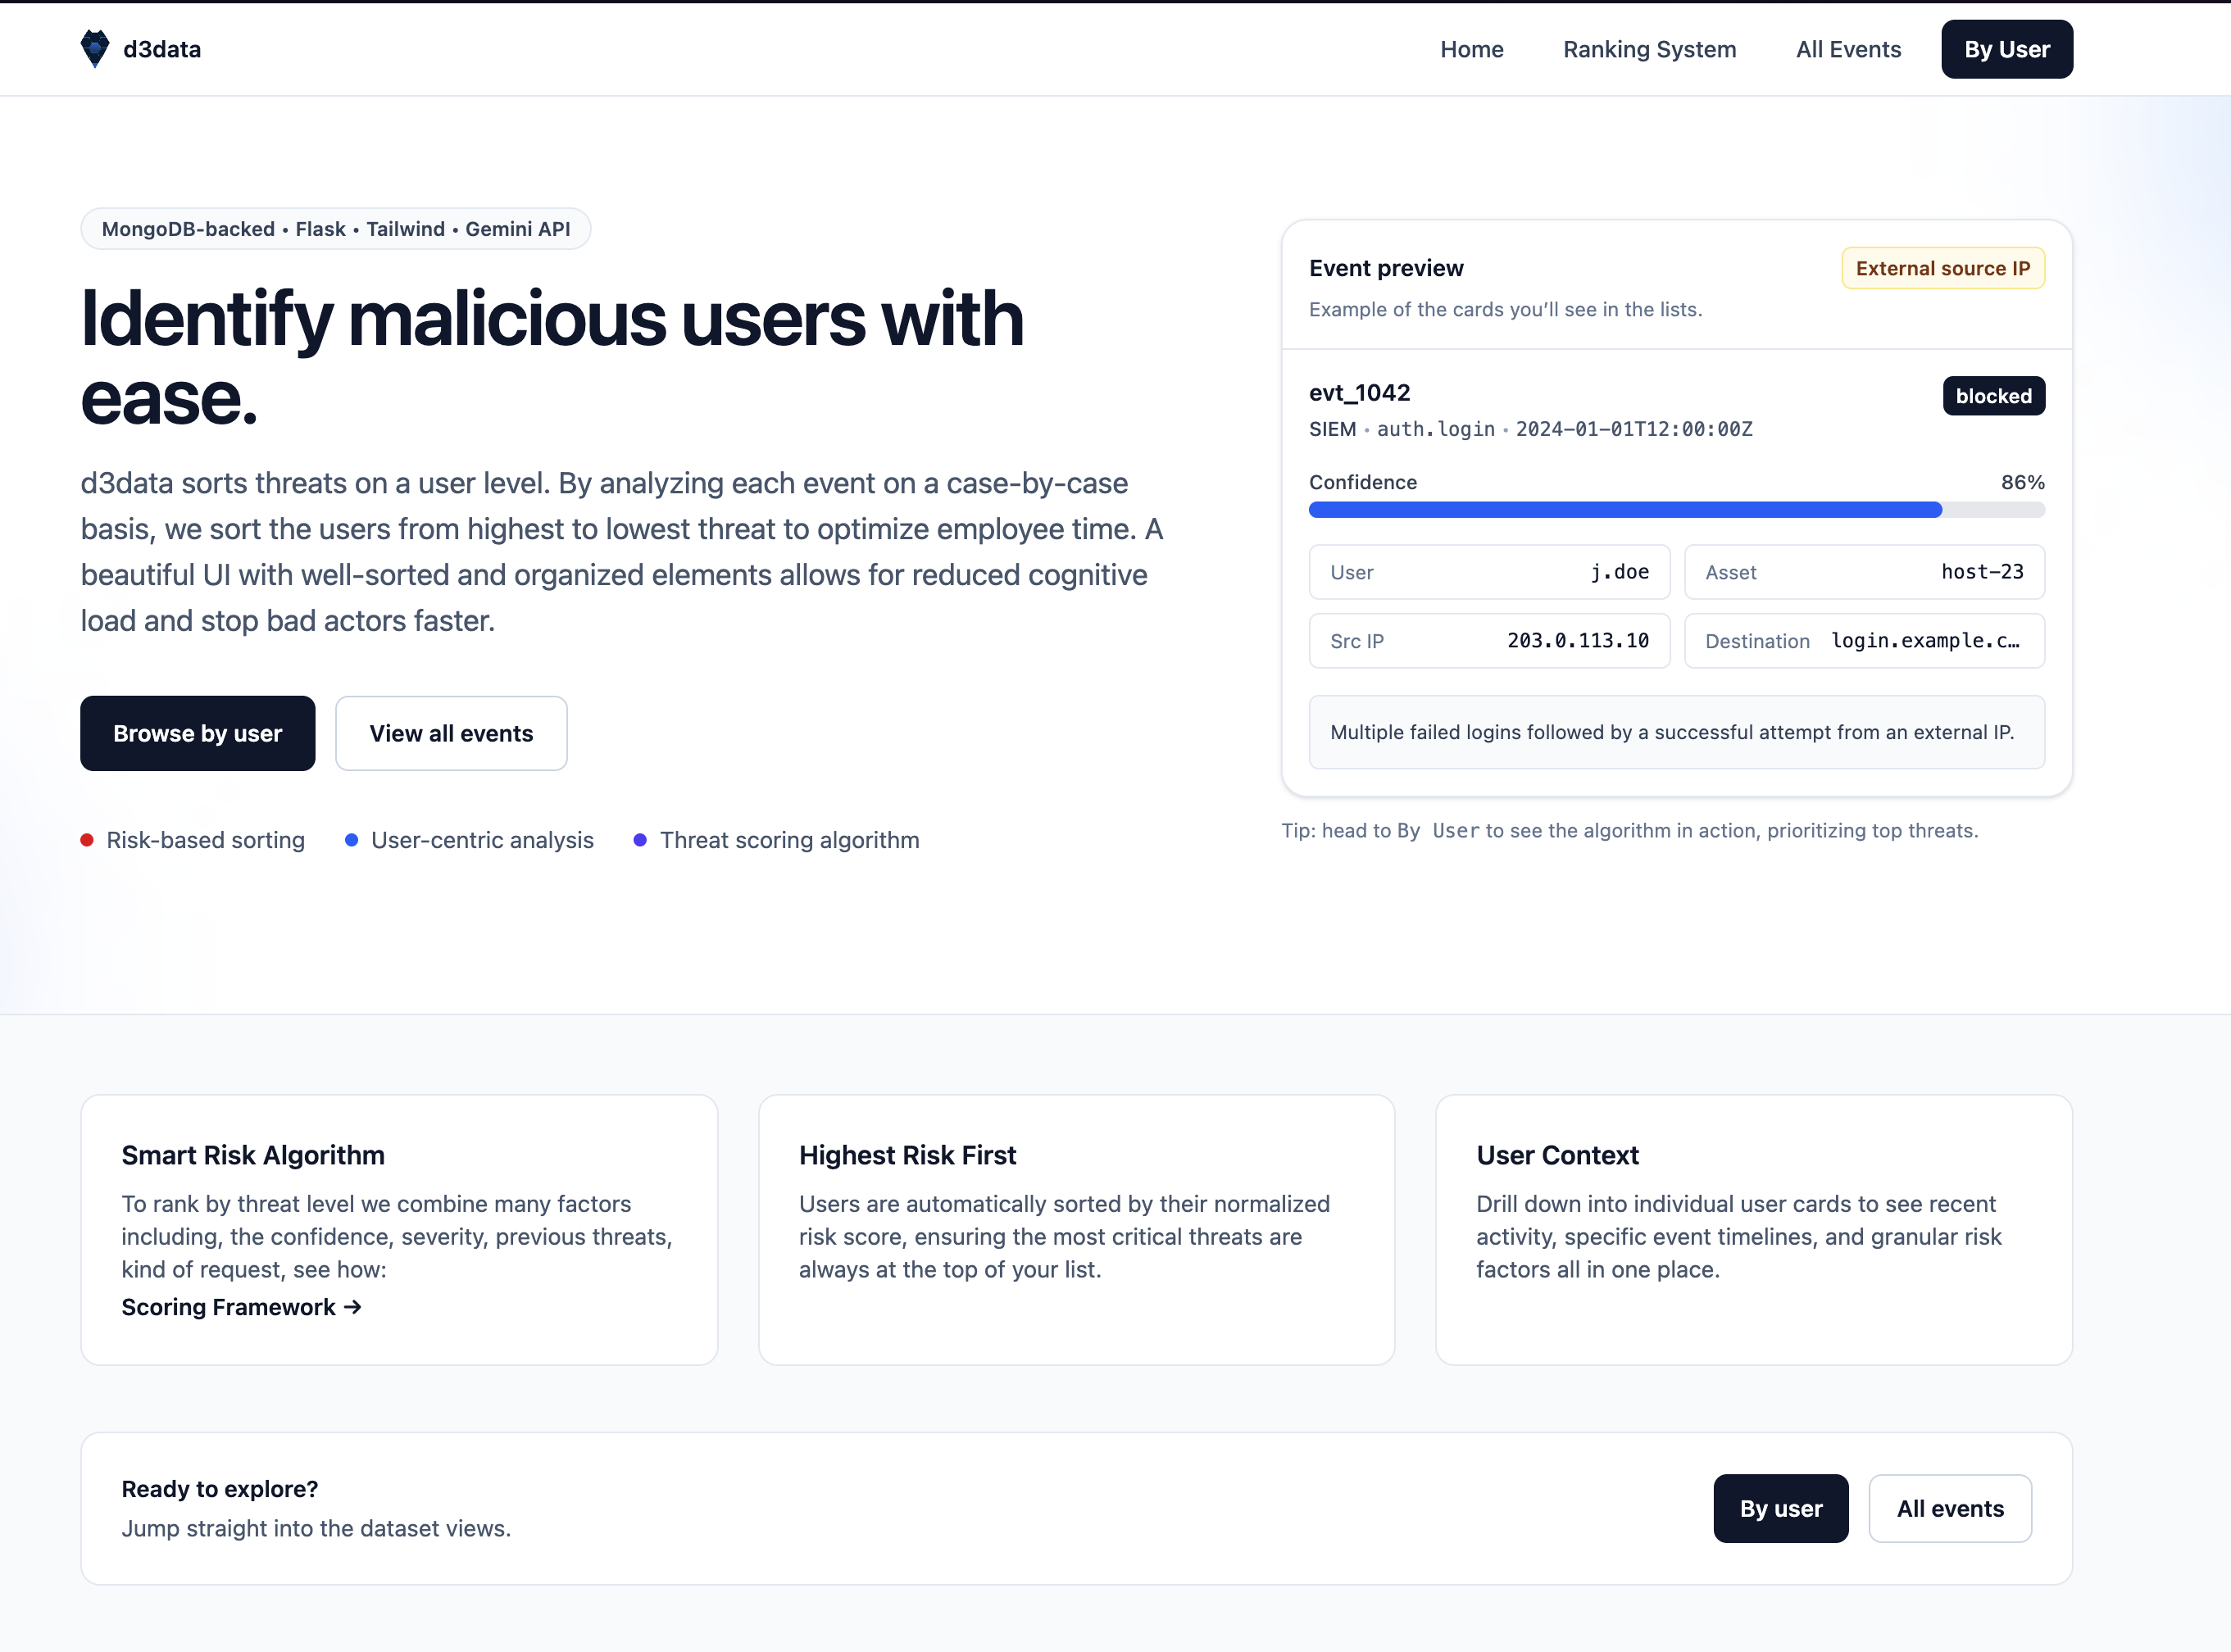
Landing page
-
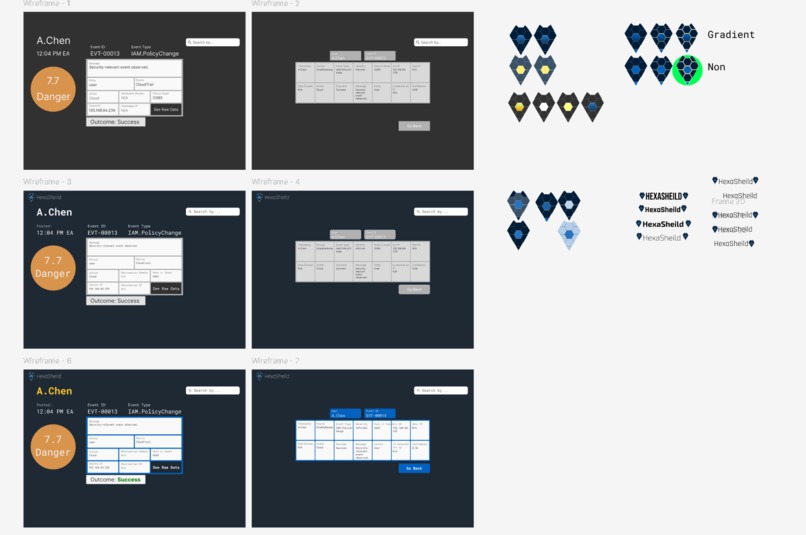
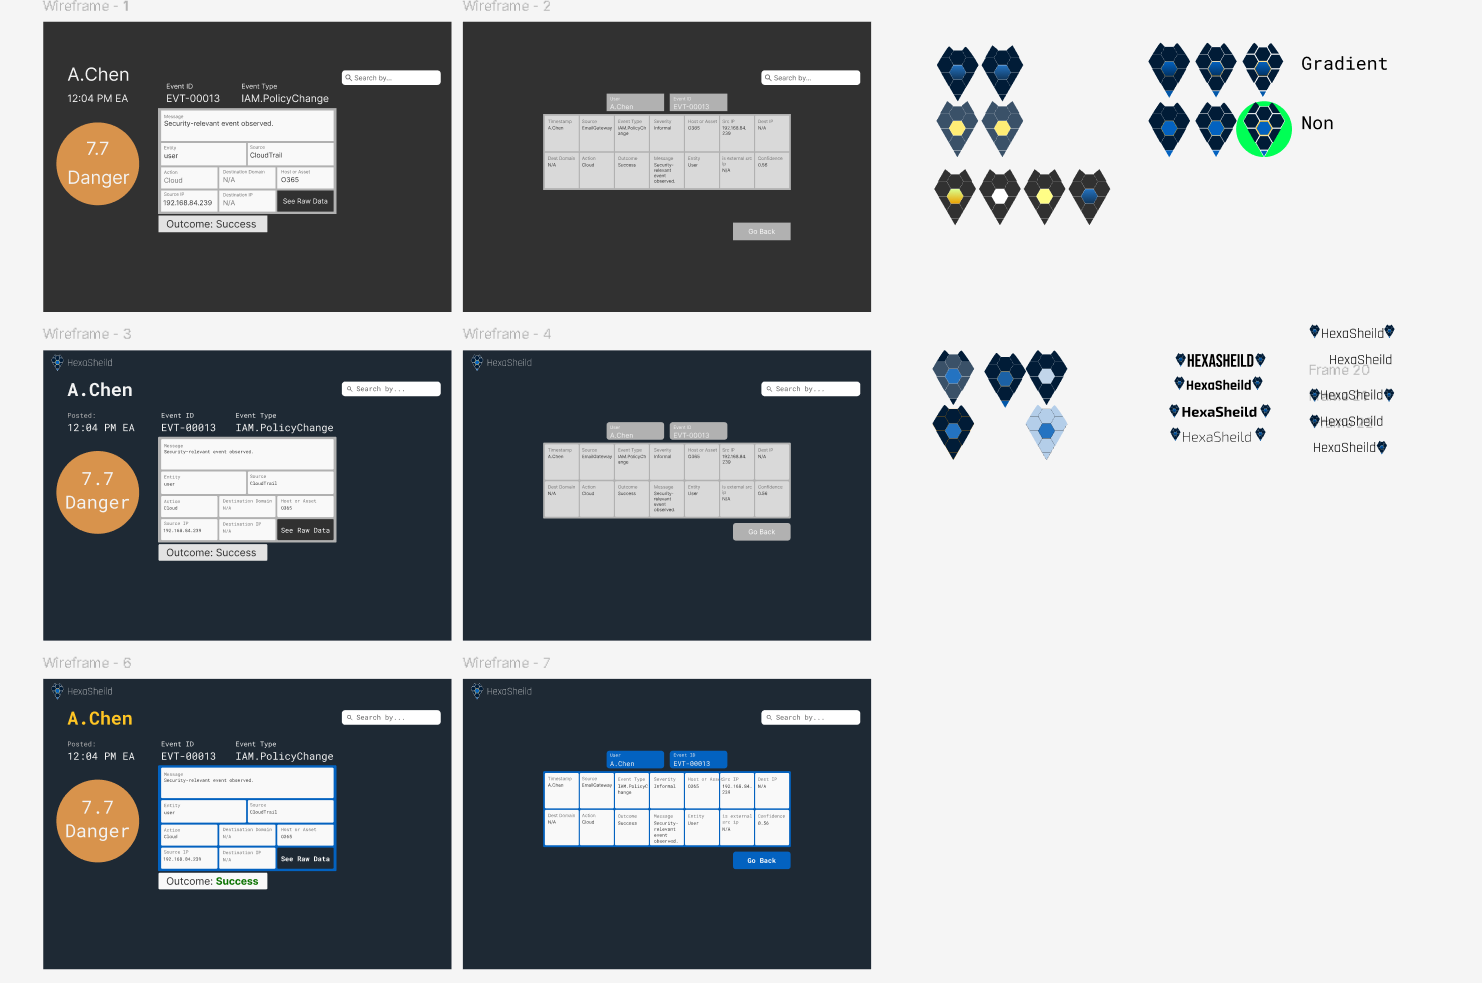
Our wireframe we used to plan
Inspiration
The story that is being told behind the data is more than just a confidence and threat level. When we looked at the data we realized that the combined actions each user carried out told a story. Therefore it is critical to organize the data by user. To further help the researcher prioritize their time all the events of the user are shown simultaneously along with a danger score which is comprised of an algorithm (PDF outlining it on our website). In short, by combining events together we can see the bigger picture of what users may actually be a threat and which my have accidentally just made one bad move.
What it does
d3Data uses a smart algorithm to sort events and users by smallest to largest threat. This allows security experts to most optimally use their time. By sorting by user, experts may quickly see the most relevant information while also having the option to dig deep into the data. This reduces cognitive load. By also ensuring a consistent and structured UI with the use of visual indications and colors the researches can quickly analyze each event with ease, further reducing cognitive load. The researchers may also flag users and later sort by these flagged users. By leveraging AI summaries, the researcher can see a suggestion of what a user is doing generated, powered by Gemini's API . This allows for a starting point for a researcher to create their own conclusions, or to have a second opinion. These summaries are fully based on the facts provided by each event. We also did not want the researcher to be limited by any means so we also included a page where they can see all the events and sort them in various ways. This allows for enhanced flexibility and for them to be able to drill down as much as they need on the data.
Hardware bonus section
As a side piece to our project we have also prototyped a piece of hardware to accompany to the software. We have designed a pager that could wake up on call security researchers in the case of a high level security incident. This allows the company to stay safe. At all times. This was created using an Arduino. The Arduino also comes equipped with an LCD screen to quickly show the confidence and threat level of the event to the researcher so they already know what to expect when they arrive at their desk. (see linked video below)
How we built it
We wrote the backend in Python using Flask for the server management. For the database to store all the events we used MongoDB. MongoDB also allowed for advanced searches and sorting which help the researcher quickly see what data matters most to them. For the frontend we used Tailwind CSS. To host the server we used Vultr. For the AI summaries we used Gemini's API.
What we learned
We learned how to use databases, configure DNS, develop ranking systems, build Tailwind websites and many more.
What's next for D3Data
D3Data has room to grow, by adding different metrics to group data by or more options of what to do with the data. D3Data is currently ready for use in production with its robust code base.


Log in or sign up for Devpost to join the conversation.