-
-
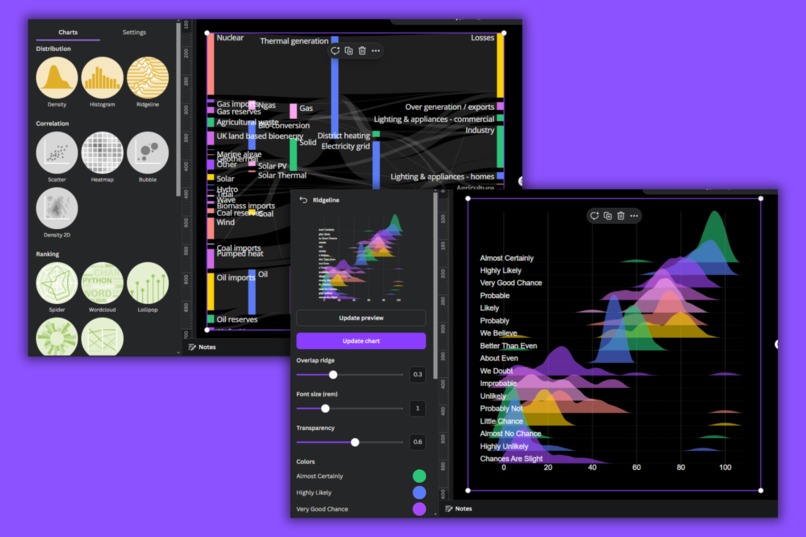
App element interface
-
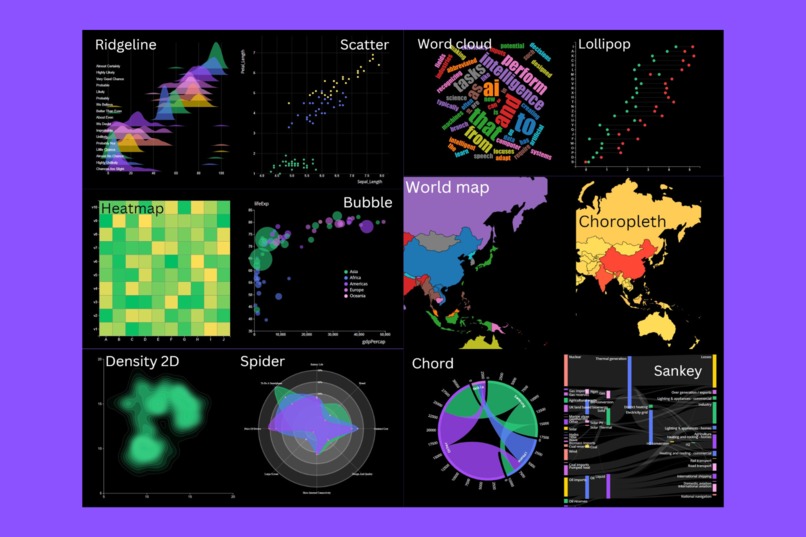
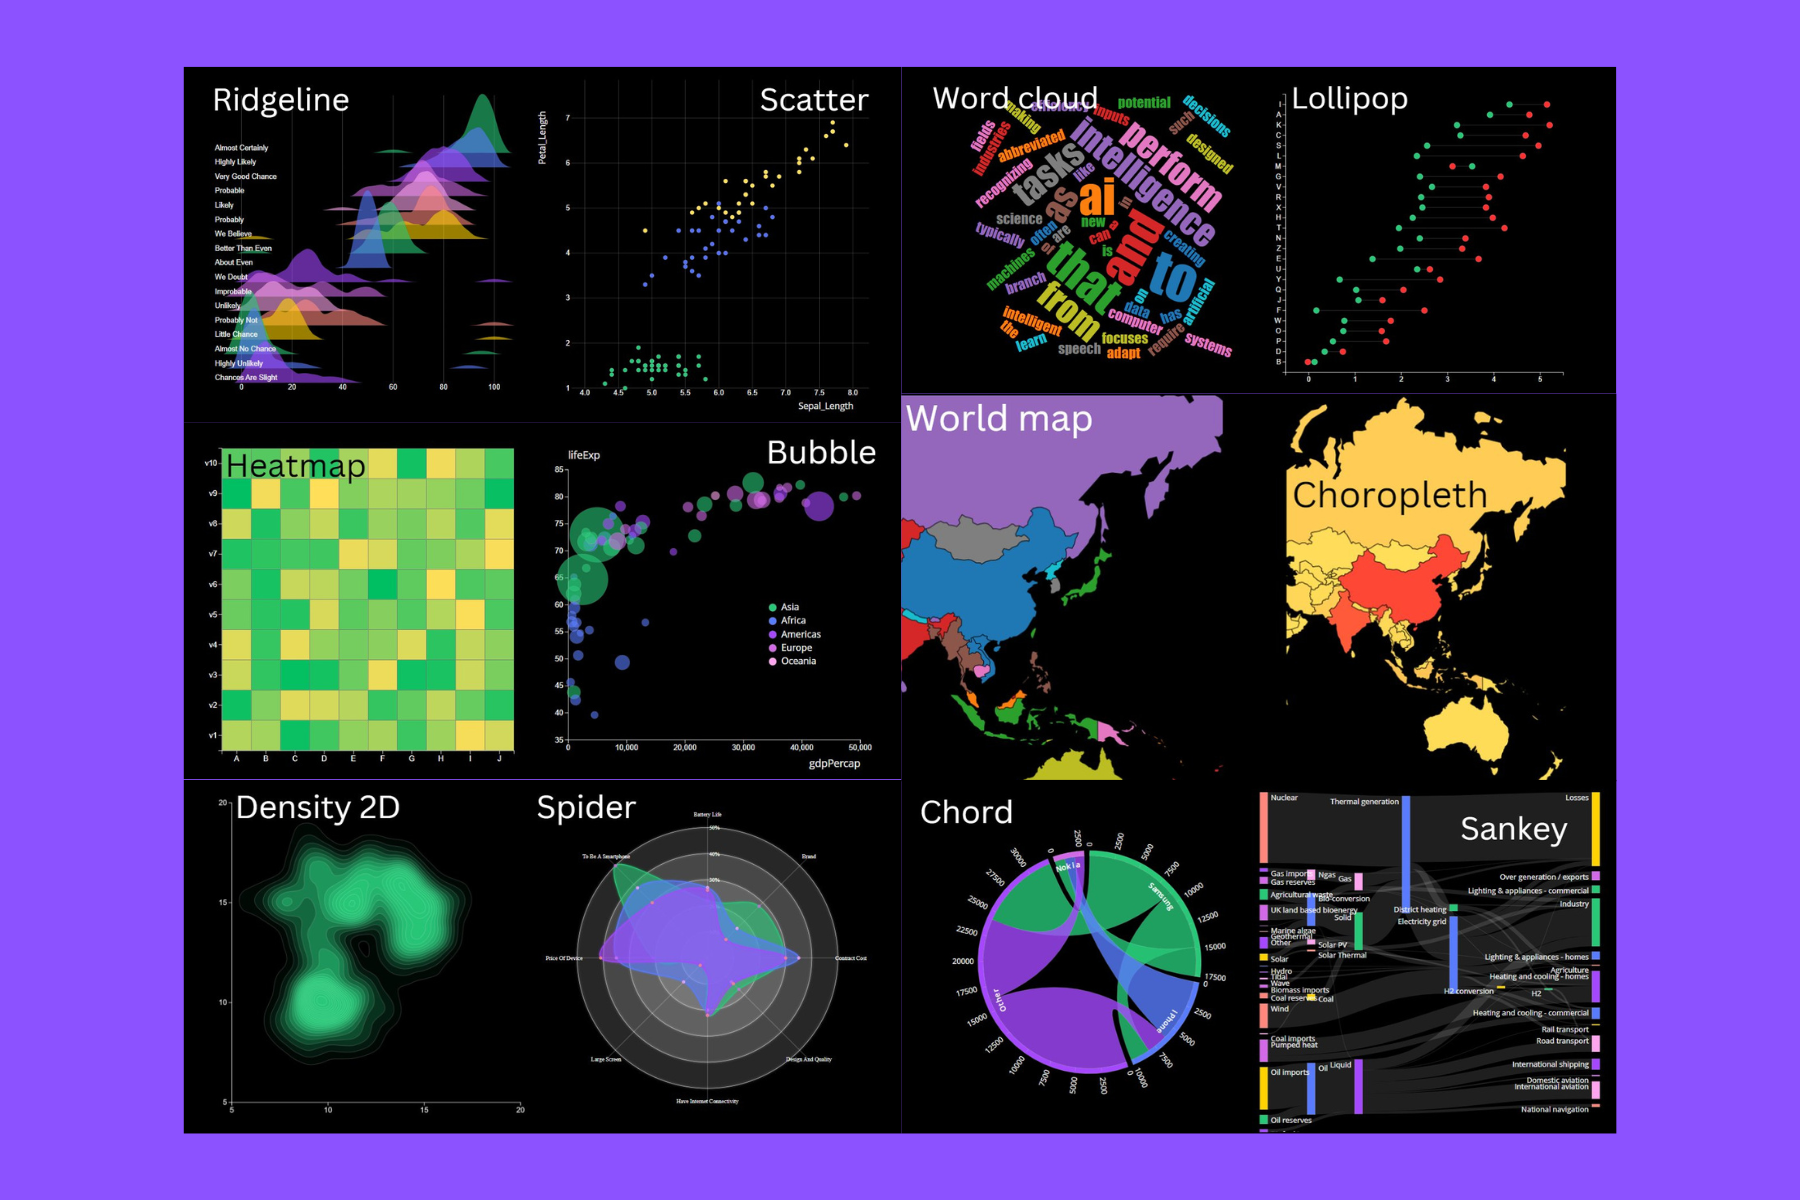
All the rendered chart types
-
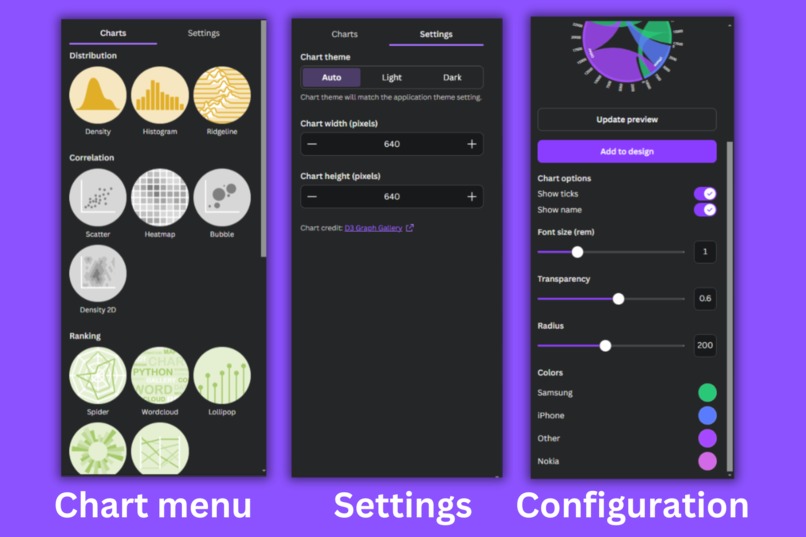
Different kind of pages
-
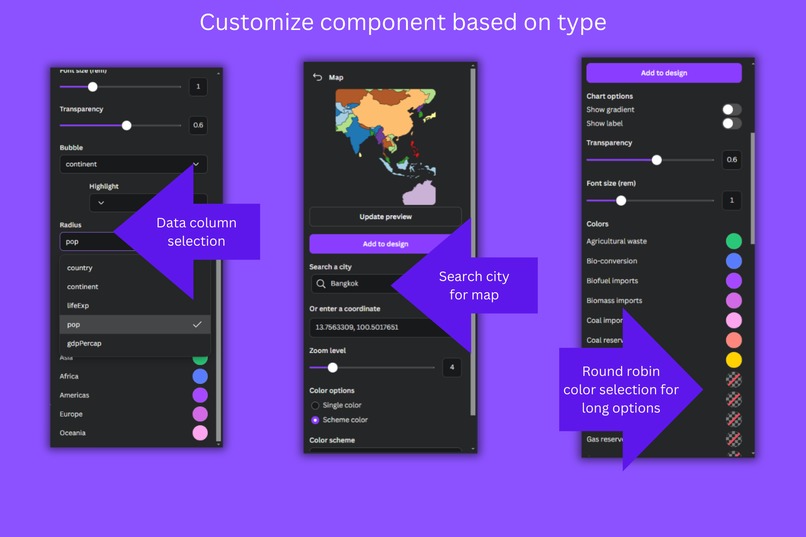
Features to cater the small needs


Inspiration
While Canva offers built-in charting capabilities, we found that these native options often fall short of complex, data-driven presentations. Our discovery of the D3.js library's potential inspired us to bridge this gap in the Canva marketplace, aiming to provide more sophisticated visualization options.
What it does
Canva Chart Plus elevates your Canva designs with advanced visualizations. By integrating the powerful D3.js library with Canva, we've unlocked a world of possibilities that go beyond basic charts. Our app enables users to create stunning, custom graphs that bring data to life, making it perfect for engineers, storytellers, salespeople, and anyone seeking to enhance their data presentation.
The simple-to-use and tailor-made chart interface allows users to easily deploy their data in the form of charts for their design work.
How we built it
We developed Canva Chart Plus primarily using online resources as references. We're particularly want to give credit to D3 Graph Gallery, from which we replicated most of the core D3 charts. We did it by extracting input parameters that allow users to adjust configurations and customize their charts.
The app works by generating an SVG data URL and uploading it to Canva as an image asset. We carefully selected data types to store within the App Element that enable users to re-render charts without reconfiguring settings.
By managing everything within the Canva platform, we've ensured that our app is free from data privacy concerns.
Challenges we ran into
Structuring D3.js: The vast flexibility of D3.js posed a significant challenge in creating a structured approach. The D3 Graph Gallery provided a valuable framework, though we've only scratched the surface of its 400+ chart types.
Canva constraints: We faced several limitations within the Canva platform:
- A 5KB data size limit within the App Element.
- The
initAppElementrender's lack of async load support. - Sanitization of metadata in SVG data URLs, preventing raw information retention.
Releasing on the marketplace: It has been hard work going back and forth to fix and touch up the app for the marketplace. Nevertheless, feeling proud of the Canva reviewers' work, where their feedback has been constructive and awesome. In return, the app now feels more polished and is ready for release on the marketplace.
Accomplishments that we're proud of
Despite the constraints, we're proud to have produced a compelling app. Everything works as expected with a high degree of configuration to match the charts with the theme of any Canva design.
Our current architecture supports the main use cases we aimed to solve, as explained in the "How we built it" section. We've decided to delay implementing some advanced features, viewing them as potential future enhancements.
What's next for Canva Chart Plus
Canva Chart Plus is still in development, with a long roadmap ahead. Considering D3's extensive library of over 400 chart and graph types, each requiring careful configuration and maintenance, we have ample room for expansion.
Our long-term vision includes exploring ways to accommodate larger datasets (>5KB) and streaming data from external sources. This approach may involve external services while ensuring robust data privacy protection.
Built With
- canva
- canva-sdk
- d3.js
- node.js
- typescript


Log in or sign up for Devpost to join the conversation.