-
-

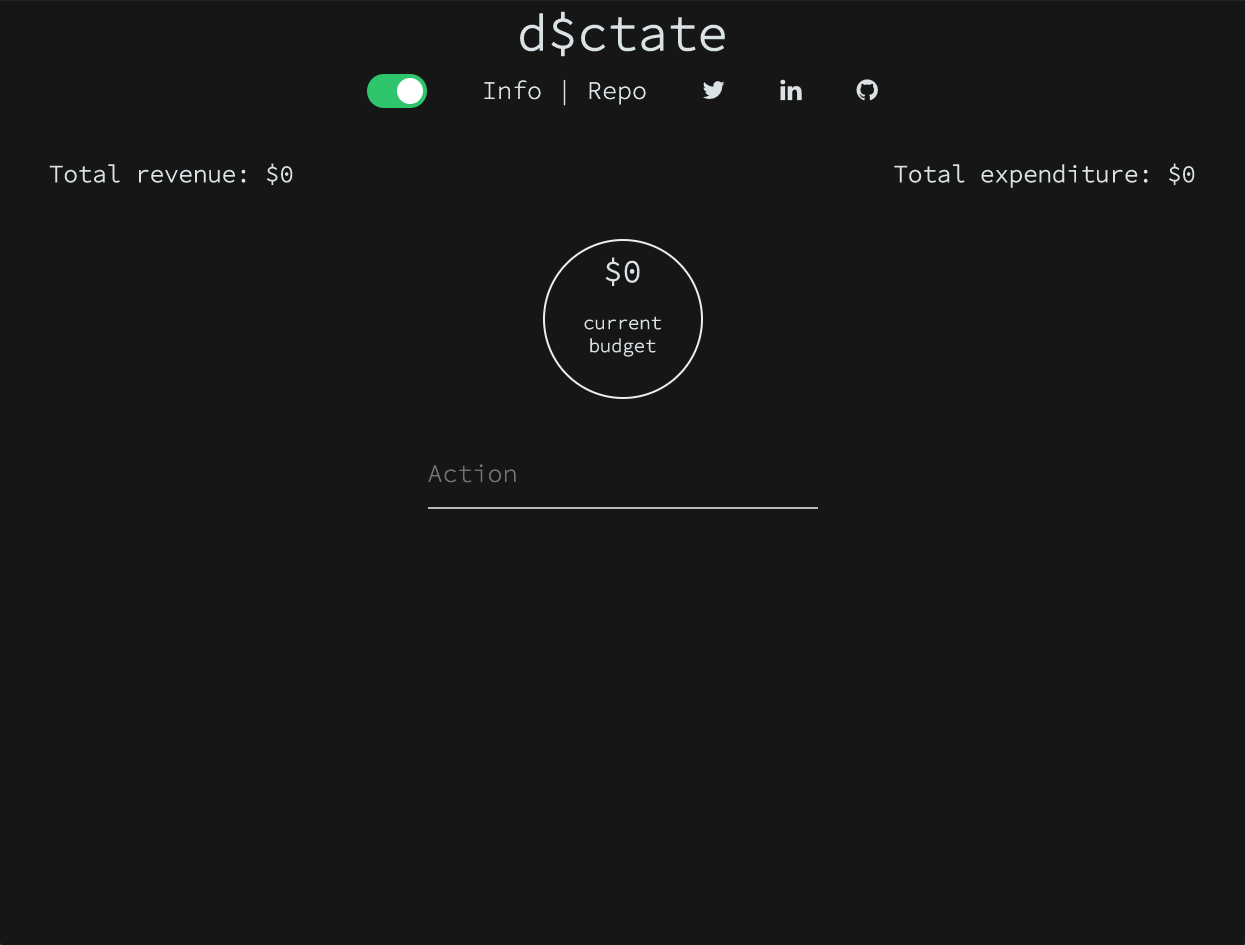
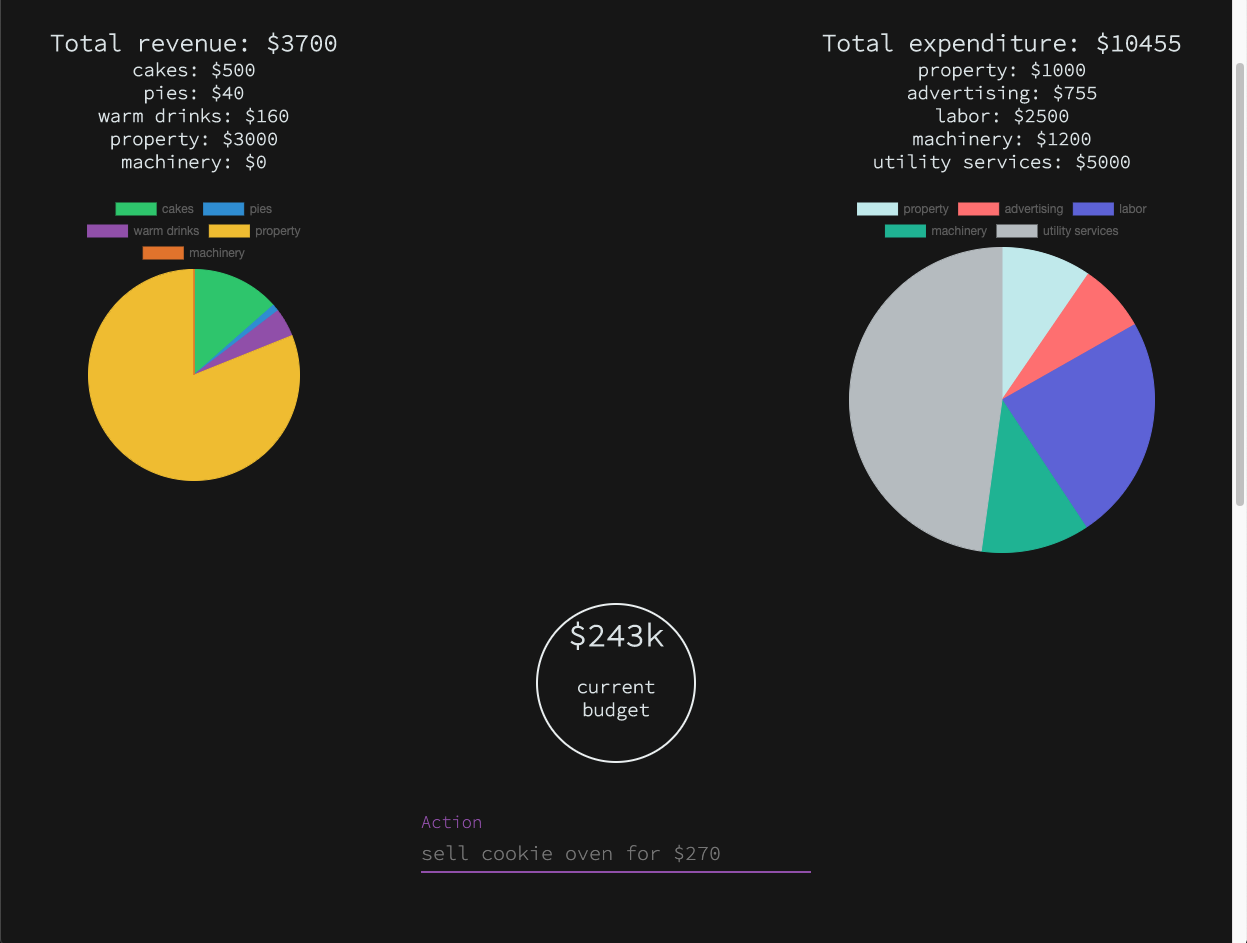
Home Page Dark
-
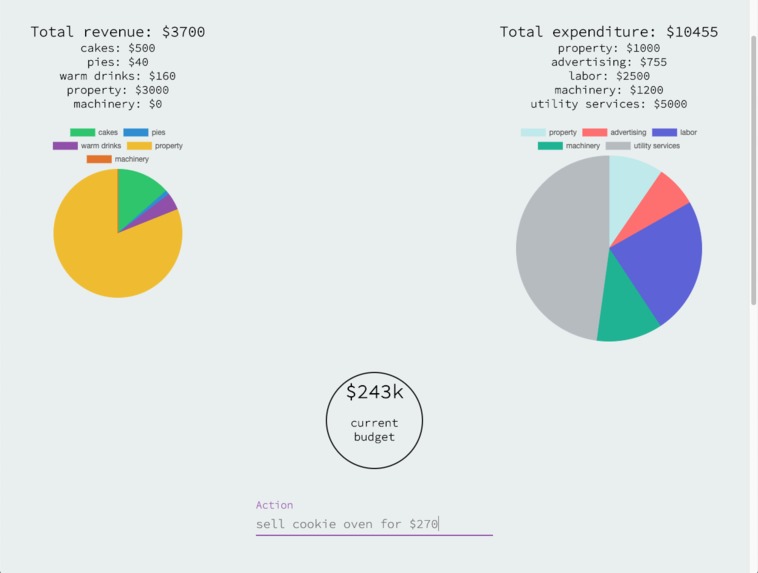
Graphs Light
-
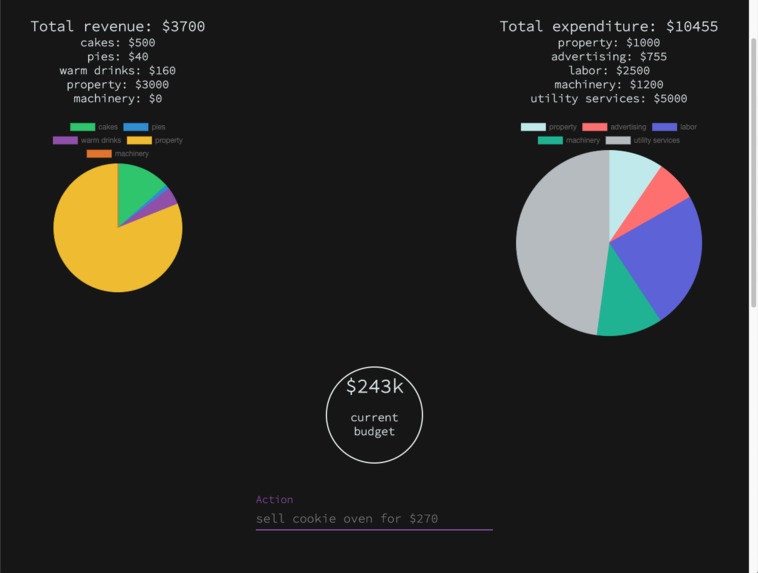
Graphs Dark
-

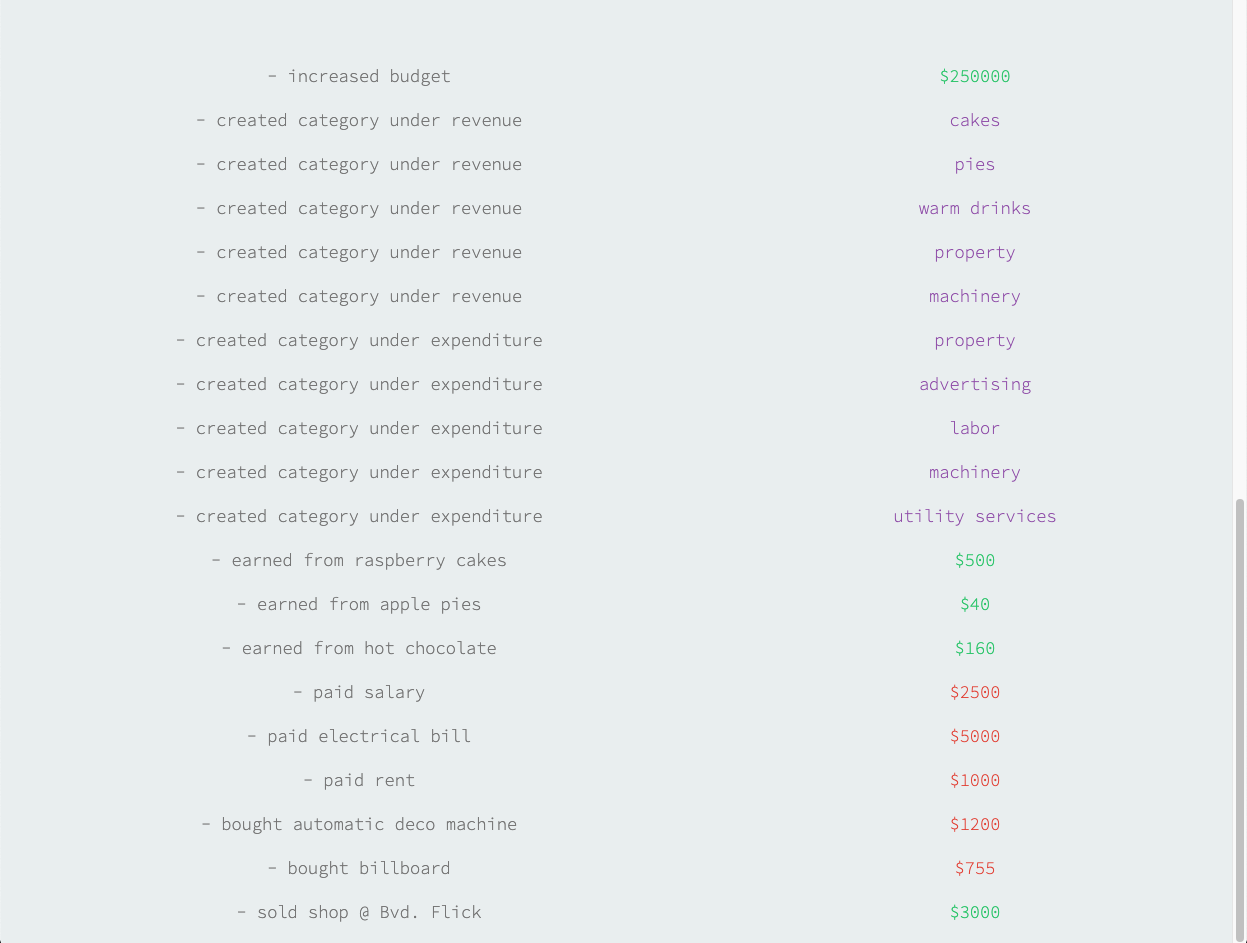
Log Light
-
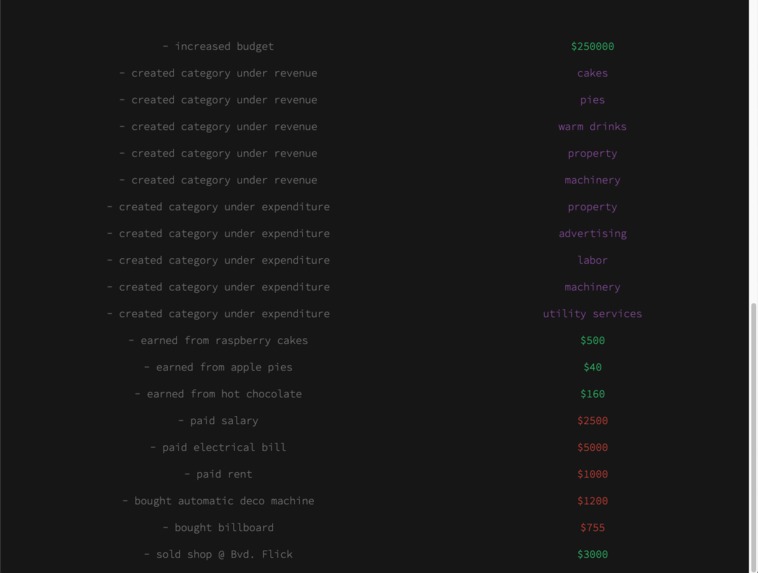
Log Dark


Inspiration 💡
You never know if a business plan is great until you see it in action. It's also very time-consuming to manually build charts and allocate resources to individual categories. That's why I built d$ctate.
What it does 💻
The entire purpose of d$ctate is that you only need to type in phrases and it takes care of the rest: adding the correct sum of money to the correct category and subcategory, updating the piecharts, and appending to the log.
From there, you can copy the piecharts as well as all other stats and the detailed log and share with your collegues in order to adjust your business plan or confirm that it works.
The user has 6 functions at their disposal:
make: creates a new subcategory under either revenue or expenditure => "make iphone sales r" implies make a new subcategory called iphone sales under revenue
add: adds the specified amount of dollars to their budget => "add 30000" increases your budget by $30k
buy: decreases budget and increases expenditure overall and in particular subcategory if included, the item bought and its prize are logged => "buy water filtration system for 7500 (2)" will subtract $7.5k from overall budget and add $7.5k to both expenditure and the second sub-category in expenditure
earn: adds money to revenue and particular sub-category if indicated, logs how the money was earned => "earn $500 from strawberry cookies (5)" adds $500 to both revenue and the 5th sub-category of revenue
pay: subtracts indicated amount of money from budget and adds to expenditure and specific sub-category if specified => "pay electrical bill 210" will simply add $210 to expenditure and decrease the budget by $210, and what was paid for how much will be logged
sell: same as buy except money will be added to the specified subcategory and total revenue => "sell NY office for 164000 (3)" will log that NY office was sold for $164000 and that amount will be added to revenue as well as the third sub-category under it
Constraints: 1. decimal numbers are floored, 2. largest sum of money possible for all $-amount displayers is <10 billion
How I built it ⚙️
The entire front end is developed using HTML, CSS, and JS. Essentially the backend is a Natural Language Processing (NLP) model trained with Wit.ai, which takes all the user inputs and returns to d$ctate what function they are using and what each parameter in the input's context is. I also made a python program that automatically generated training data for 2 of the functions to save time. The website was deployed with and is hosted on Heroku.
Challenges I ran into ⚠️
I experienced a few issues with the pie charts as they acted abnormally and would change size arbitrarily.
Accomplishments that I'm proud of 😺
I feel as though the more projects I see from others as well as complete myself, the better my taste for styling gets. As a result, it becomes more natural and straightforward for me to think of compatible color schemes, appealing layouts and intelligent UX, and overall I can understand the user better. In this project, I was really able to create a minimalistic design that fulfilled all objectives and was still intuitive and not lacking in any aspects.
What I learned ✏️
This project taught me that sometimes it isn't such a bad idea to overestimate how long it will take until you finalize the project, as you're more than likely to finish beforehand. Ultimately, that will mean you mentally and logistically prepared to dedicate more time yet you feel very joyful once you realize you're way ahead of your own schedule.
What's next for d$ctate 🔮
- Continuous improvement of the NLP model
- Speech recognition
- Additional functions to be implemented
- Variety of graphs to choose from
- Exportable log and stats


Log in or sign up for Devpost to join the conversation.