-
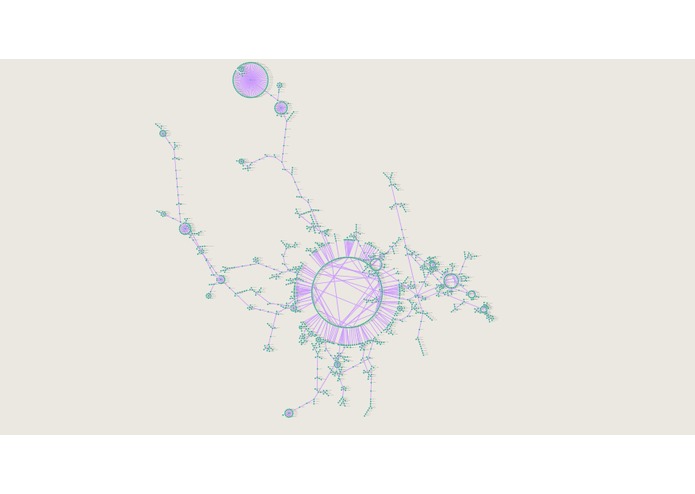
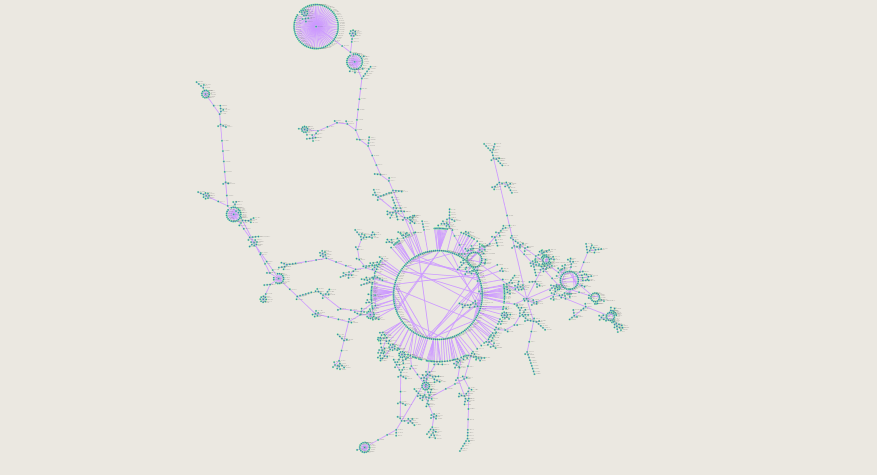
Full causal network of CYP450 mutations showing delineating treks representing subpopulation development
-

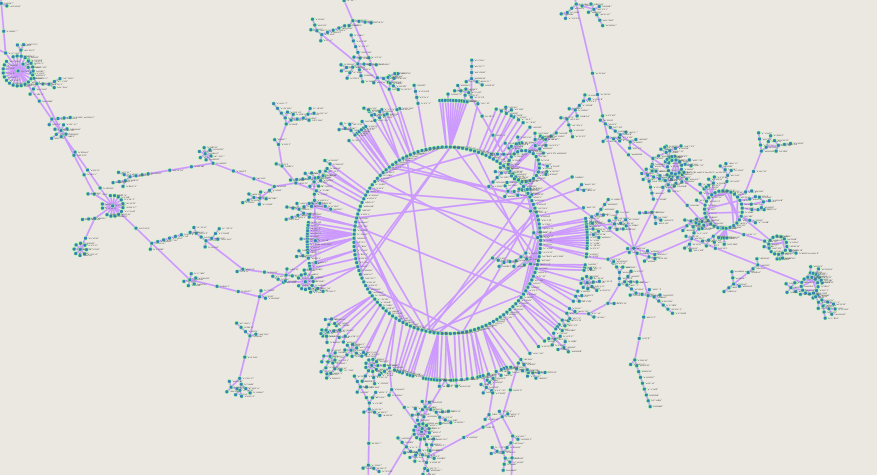
causal network of CYP450 mutations zoomed in to most commonly shared variants among populations
-
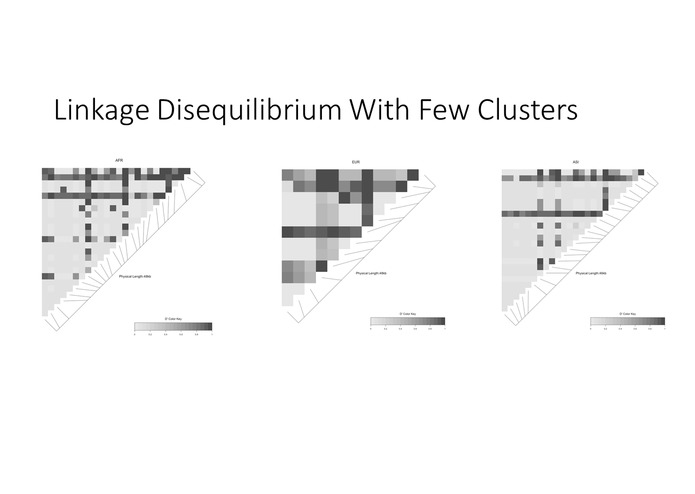
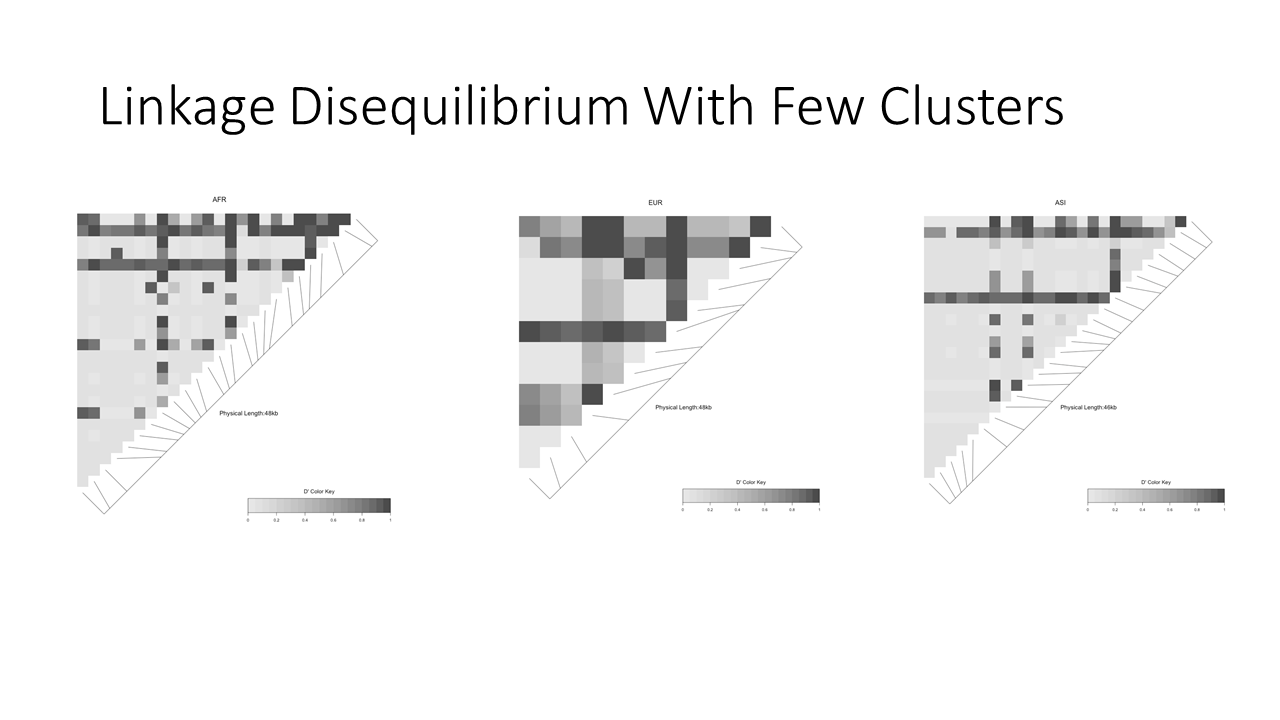
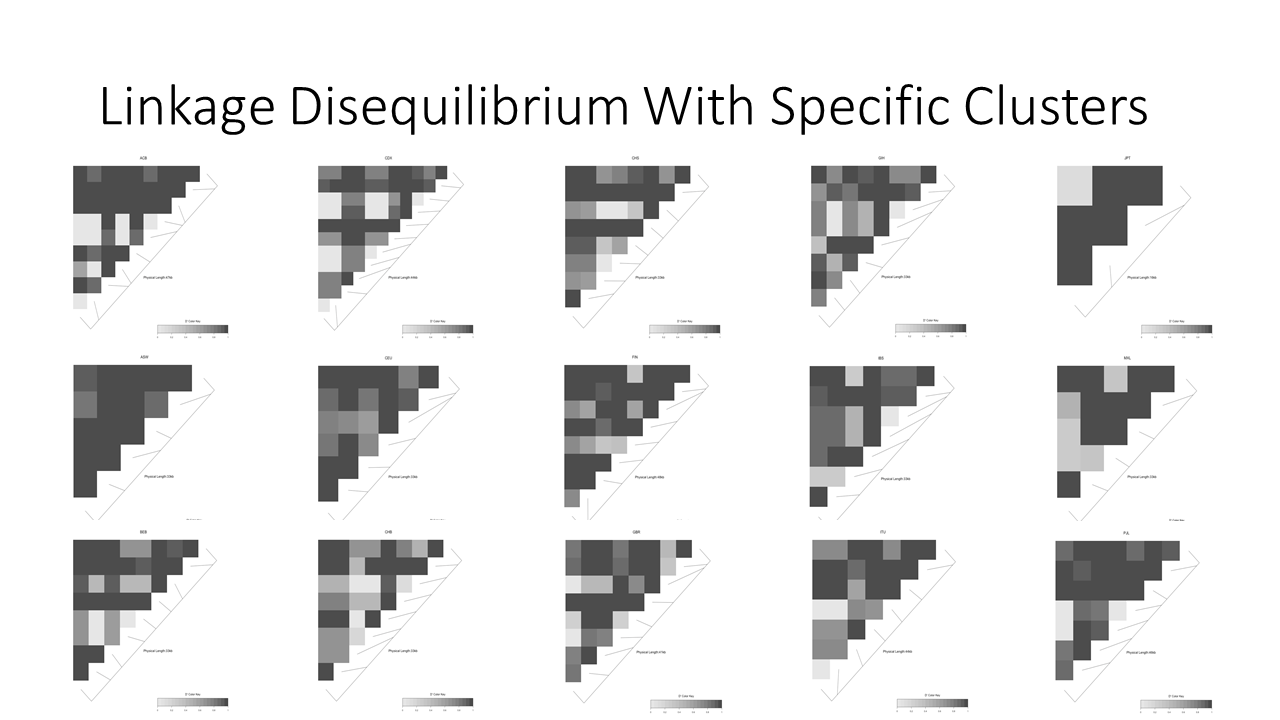
Linkage disequilibrum plot in major subpopulations demonstrates that more linkage is observable when we cluster
-
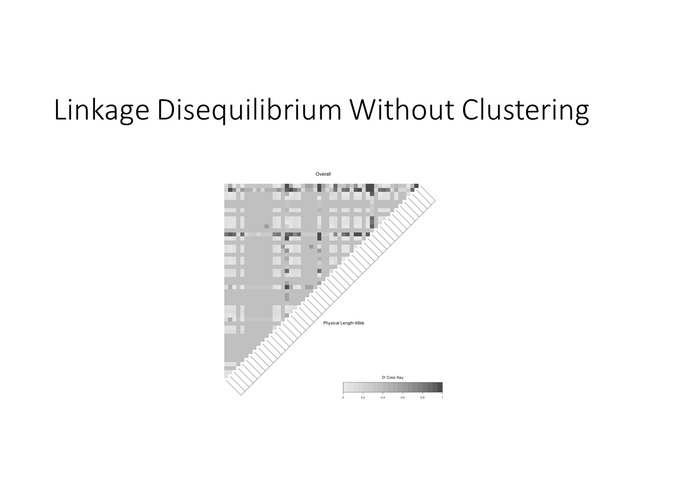
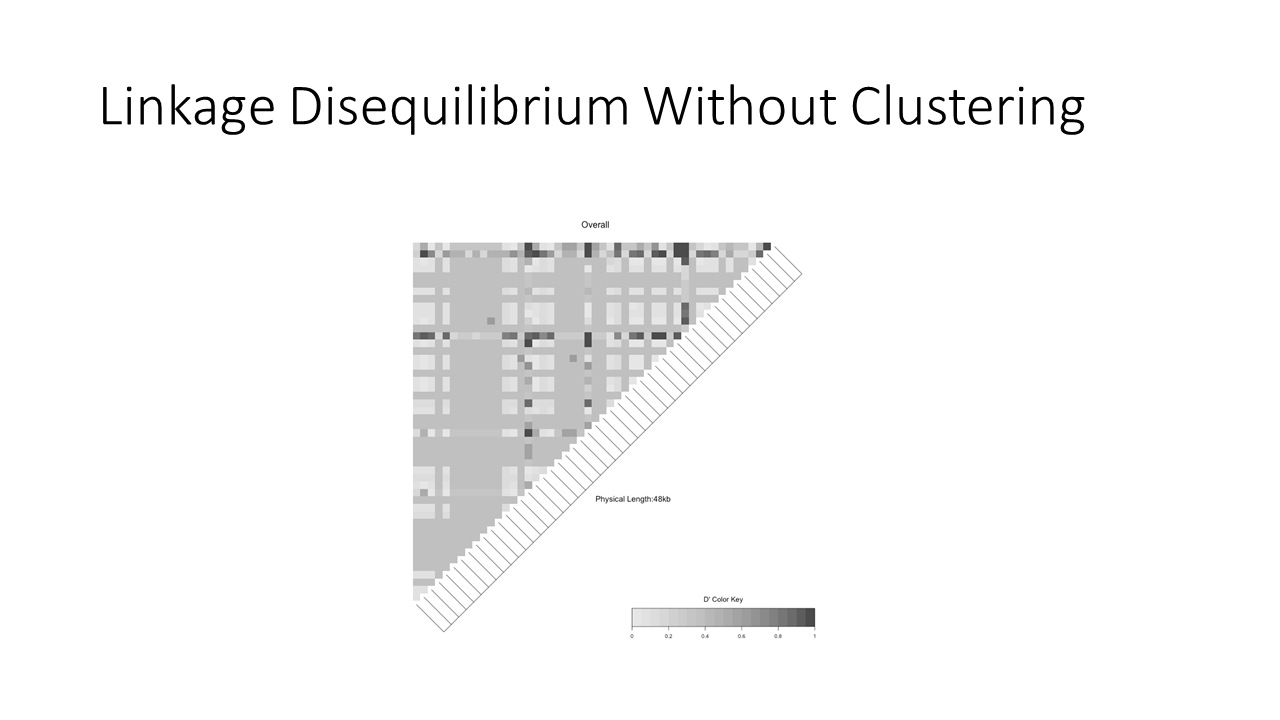
Linkage disequilibrium is entirely hidden when we observe all participant data together without clustering first
-
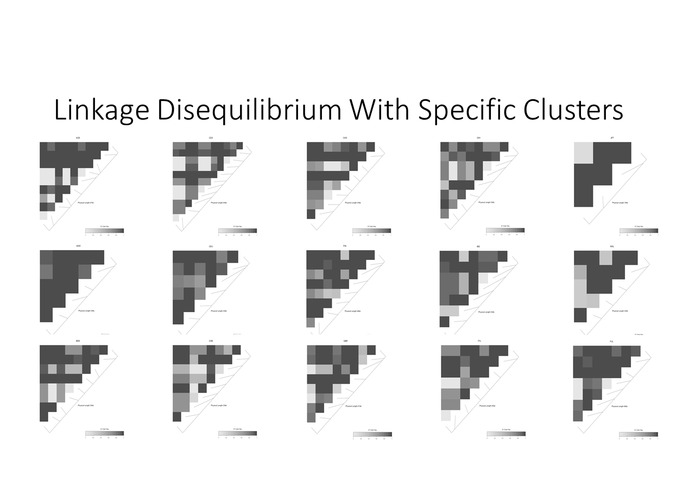
Linkage disequilibrium presents expected associations when we look at each ethnic groups separately
Inspiration
Determine whether causal discovery methods can be implemented in population genetics produce phylogenetic trees of mutations Currently, this is done with stochastic modeling techniques (i.e., Markov Chain Monte Carlo), which are very computationally heavy.
CYP450: super-family of over 50 proteins that are involved in the metabolism of many drugs; just six of these proteins metabolize 90% of drugs. Understanding ethnic differences in drug response is an important area in pharmacogenomics.
What it does
The information produced can be useful for precision medicine hypothesis testing. For example, it can assist in moving away from the "one SNP, one disease" association hypotheses and towards a more comprehensive notion that sets of mutations together contribute to disease. In the latter case, it is important to consider ethnicity (or relatedness) of individuals in order to account for the proper linkage and progression of mutations. In the causal plot, we can observe the direction (or order) in mutation acquisition and how the separation of populations into subgroups leads to isolated chains of mutation development.
How I built
The dataset was obtained from the 1000 Genomes Project, which contains whole genome sequencing of 2,504 individuals belonging to one of 26 different ethnic groups. I accessed this publicly available data through 1000 Genomes Browser and downloaded it as VCF files containing SNPs for the entire CYP450 locus (7,274 base pairs).
I used R for data curation and conversion of the data format into TSV. Tetrad GUI (v6.5.3) was used for model determination and computation using FGES algorithm with discrete BIC scoring. Cytoscape for visualizing directed mutation causation.
Challenges I ran into
Variant calling files (VCF) are quite complicated in structure, so it was challenging to parse it out into a data frame that is readable in R.
Accomplishments that I'm proud of
I am proud of the fact that I was able to take the approaches learned in the Causal Discovery Short Course to find a more robust means of producing ancestral phylogenetic trees of mutation than traditional stochastic modeling.
What I learned
I learned the theoretical and computational approach for causal discovery using directed paths and treks for modeling causal relatedness of variables, implementing algorithms that determine a Bayesian Network. Additionally, I learned to do this using the Tetrad graphical user interface software developed by the Center for Causal Discovery.
What's next for CYP450 Mutations Phylogenetic Tree using Causal Model
The next step of this project is to annotate the phylogenetic tree with ethnic information. This can be done in many ways, but first I will try annotating each SNP (node) with the ethnic group that has the highest prevalence of the mutation. Additionally, I will seek out a way to annotate entire treks so that I can look at the delineating treks and find out which ethnic group best matches this divergence based on their genotypes.
Built With
- cytoscape
- r
- tetrad-gui


Log in or sign up for Devpost to join the conversation.