Inspiration
Cybersecurity teams often face an overload of vulnerability data spread across reports, CVE feeds, and dashboards that focus on raw numbers rather than decision-making. We were inspired to build a solution that transforms complex vulnerability data into clear, actionable intelligence that helps organizations prioritize risks faster and respond more effectively.
What it does
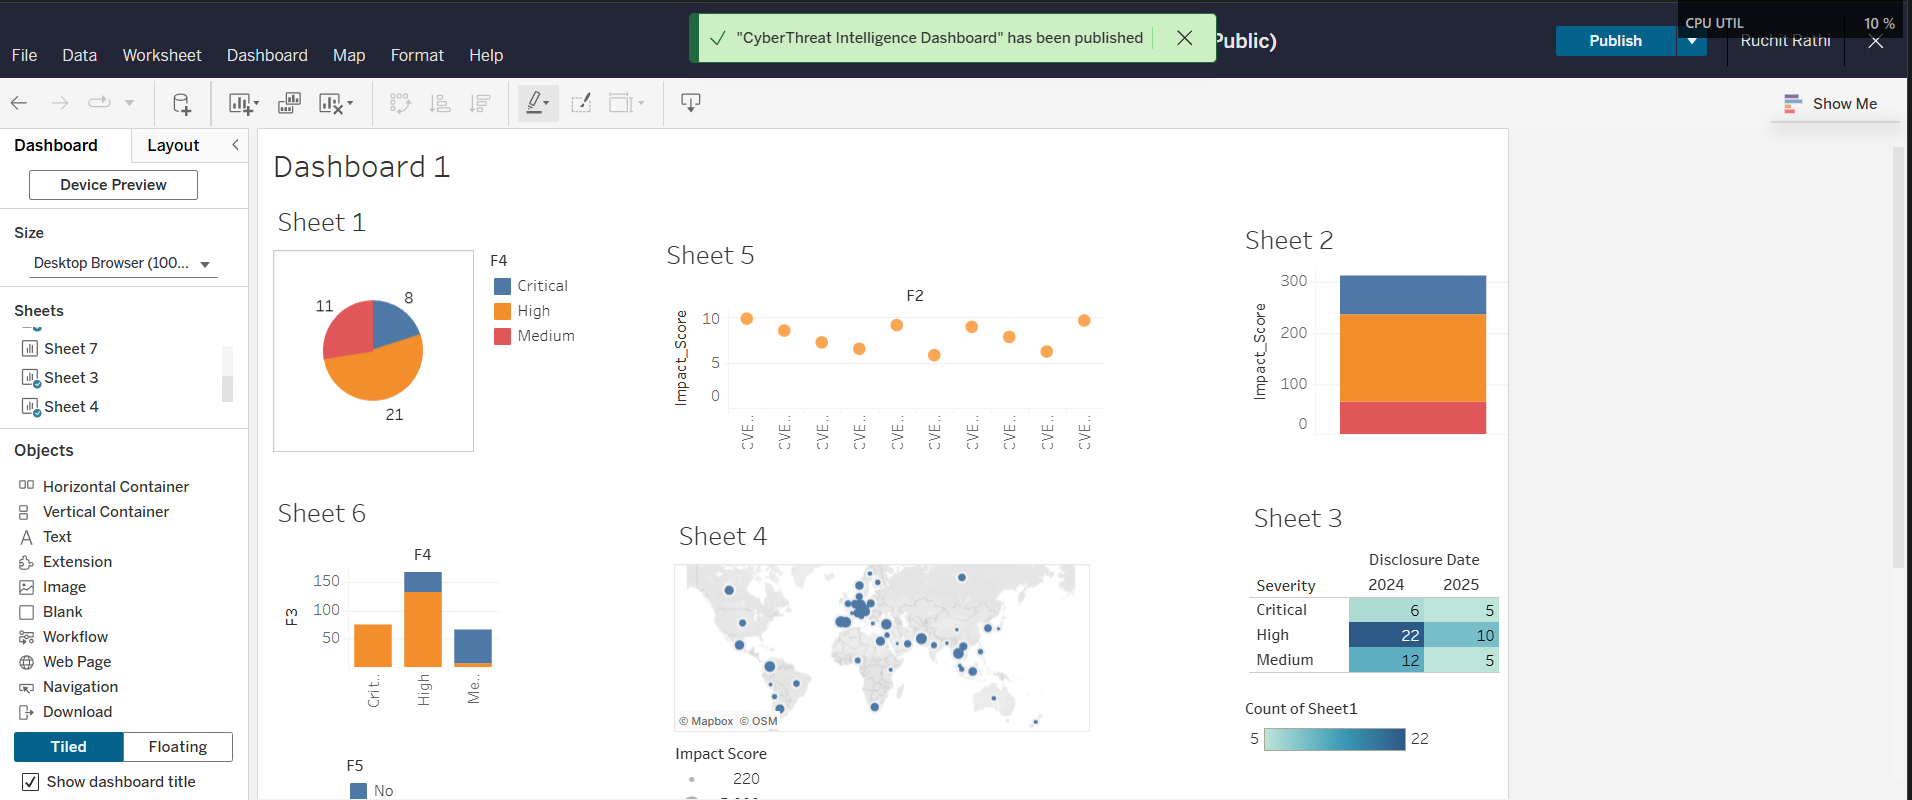
The CyberThreat Intelligence Dashboard provides a comprehensive, interactive view of global cybersecurity vulnerabilities. It visualizes vulnerability severity, impact scores, geographic distribution, patching status, and year-to-year trends. By consolidating these insights into a single dashboard, it enables security analysts to quickly identify high-risk vulnerabilities, understand their global impact, and make informed remediation decisions.
How we built it
We built the dashboard using Tableau, focusing on data modeling, calculated fields, and interactive visualizations. Multiple charts—including severity distribution, impact analysis, geographic mapping, patching status, and year-to-year comparison—were integrated into a single analytical view. Filters and visual hierarchies were designed to make insights easily accessible without requiring coding or external tools.
Challenges we ran into
One of the main challenges was transforming raw vulnerability data into meaningful insights without overwhelming the user. Balancing clarity with depth required careful chart selection and layout design. Another challenge was ensuring that severity, impact, and geographic data could be analyzed together in a way that supports quick decision-making rather than just descriptive reporting.
Accomplishments that we're proud of
Designed an end-to-end cybersecurity intelligence dashboard without writing external code
Successfully combined severity, impact, geography, patching, and time-based analysis in one view
Created a dashboard that emphasizes actionable insights, not just visual appeal
Built a solution that can realistically support SOC teams and security decision-makers
What we learned
We learned that effective cybersecurity analytics is more about clarity and prioritization than complex tooling. Strong data storytelling, intuitive design, and well-chosen metrics can significantly improve how quickly insights are understood and acted upon. We also gained hands-on experience in using Tableau for real-world analytical problem-solving.
What's next for CyberThreat Dashboard
Future enhancements include adding automated risk scoring, real-time data integration from live CVE feeds, predictive trend analysis, and alert-based insights for emerging threats. We also plan to tailor the dashboard for specific industries and integrate AI-driven summaries to further support proactive cybersecurity decision-making.

Log in or sign up for Devpost to join the conversation.