-
-
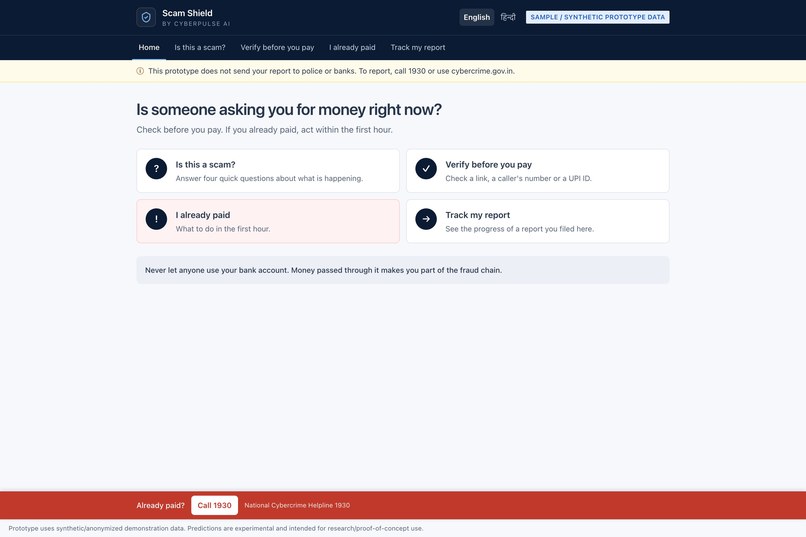
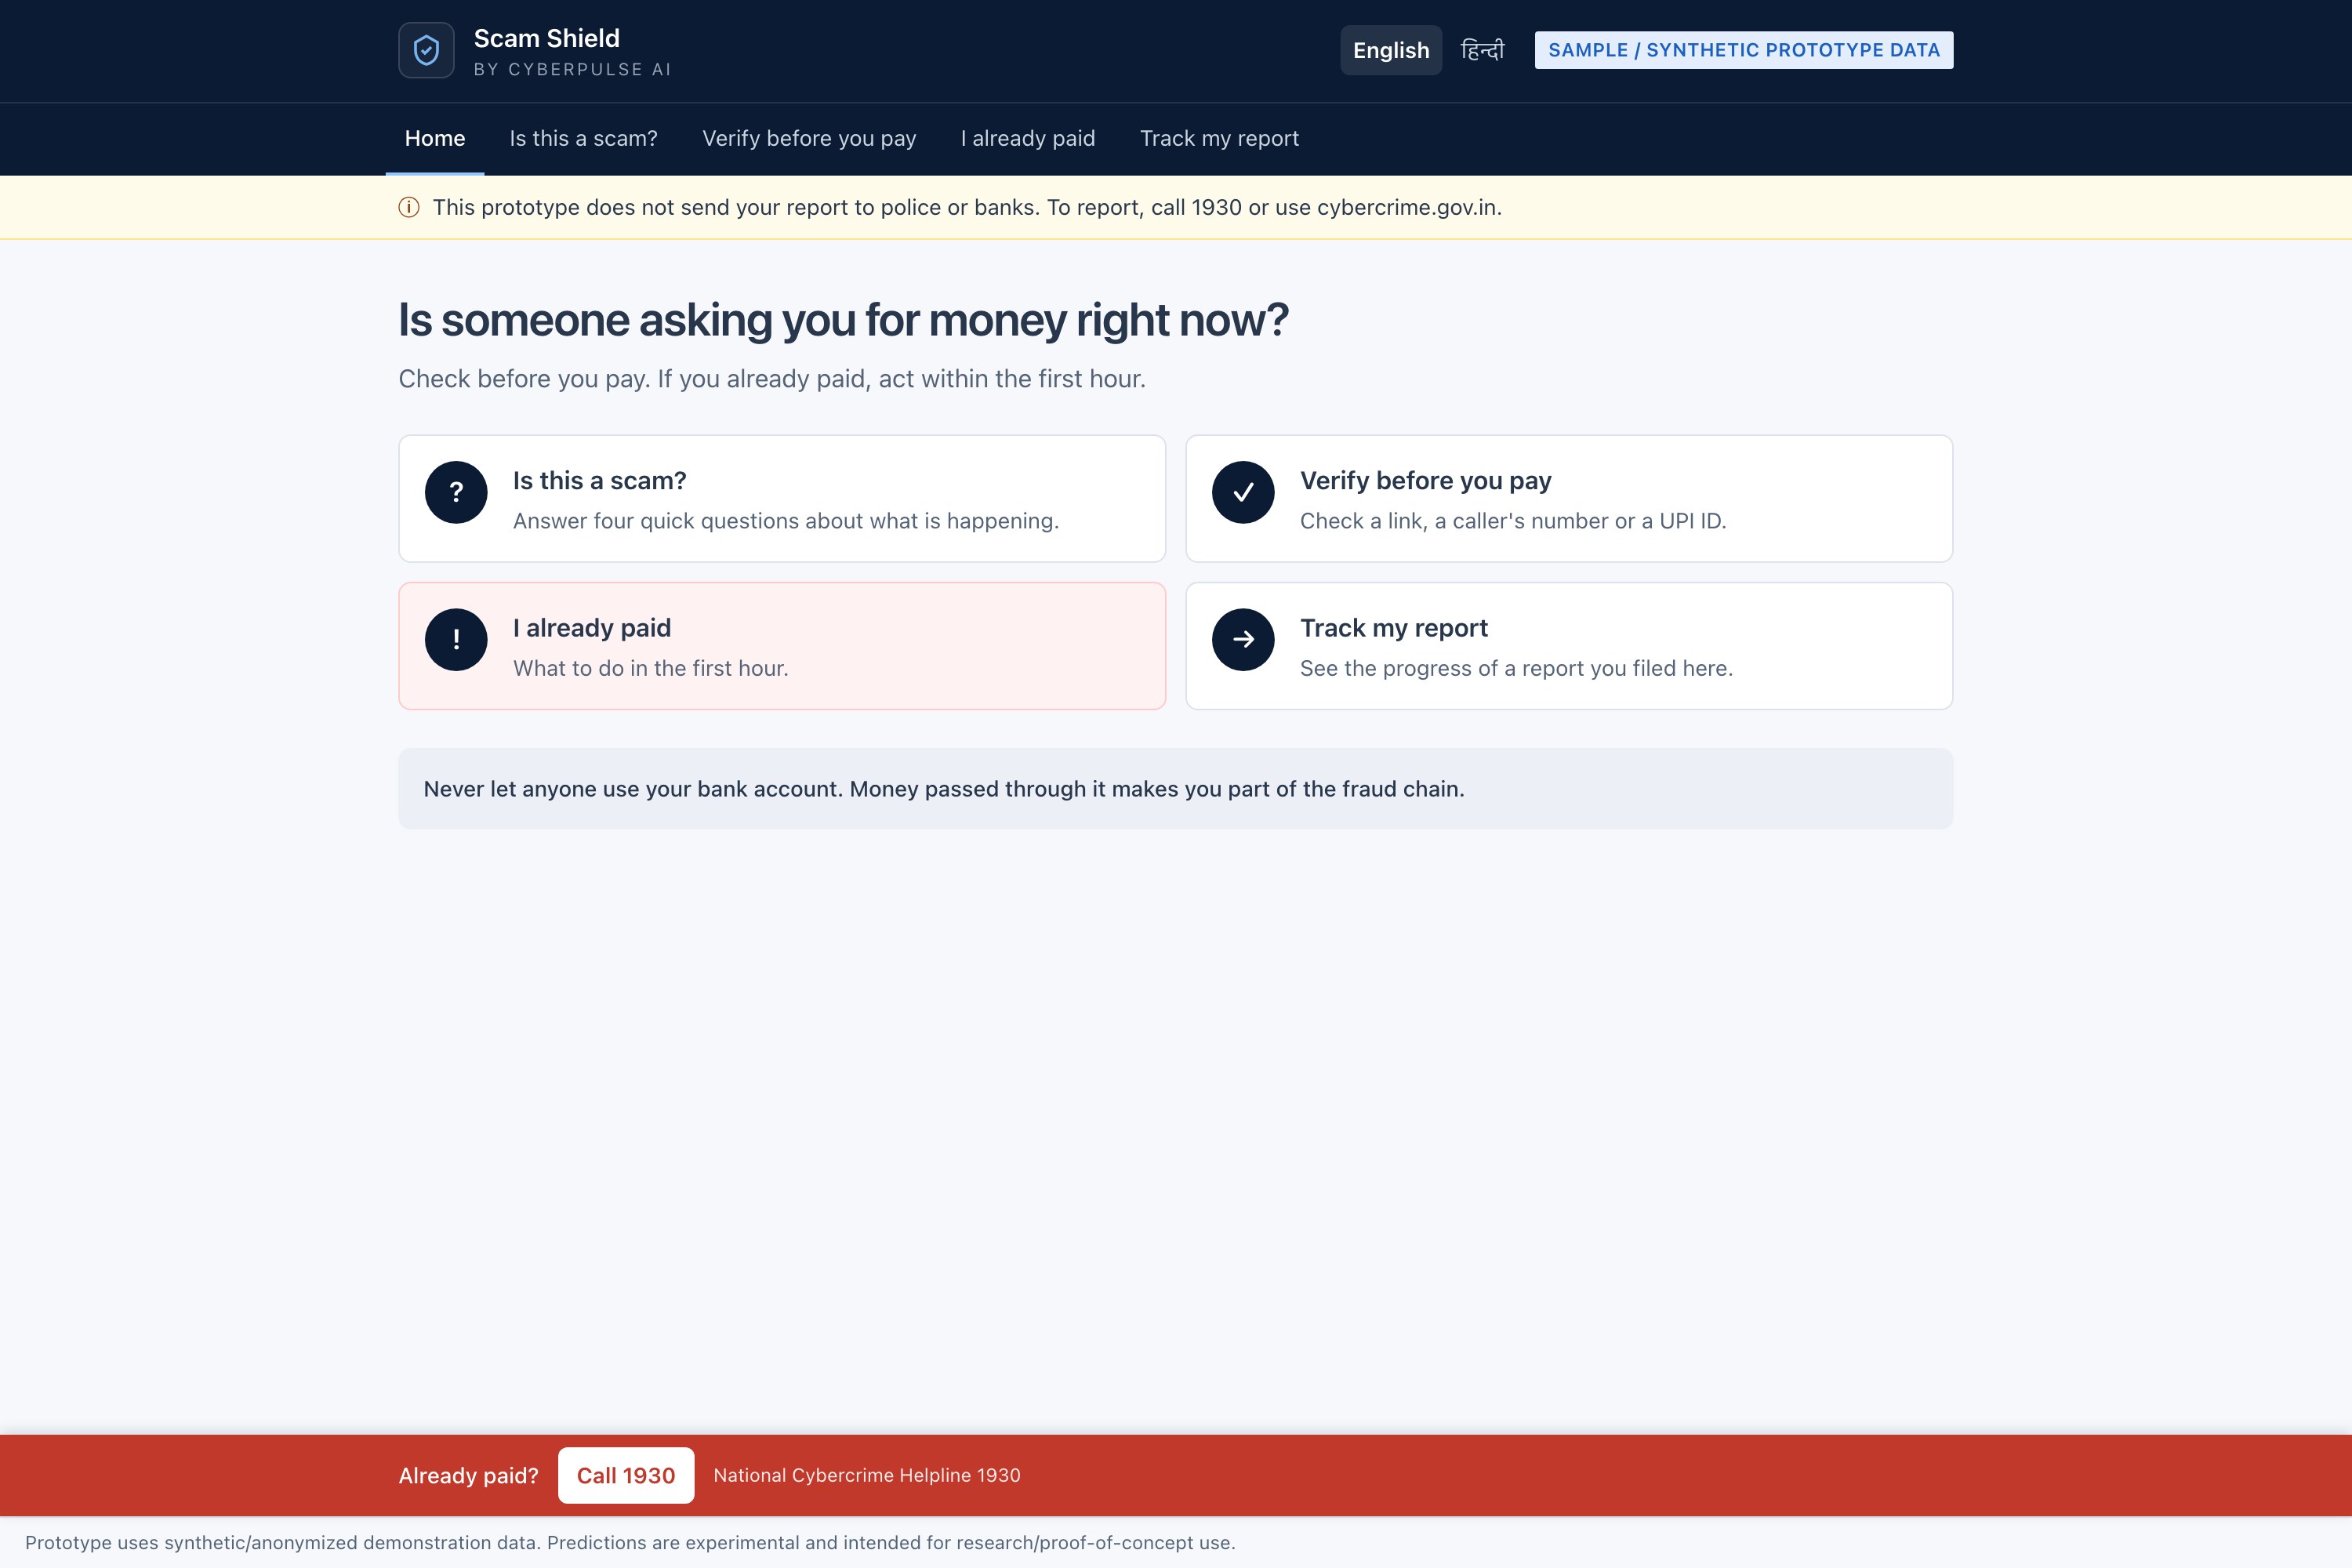
Scam Shield, the citizen /safety page
-
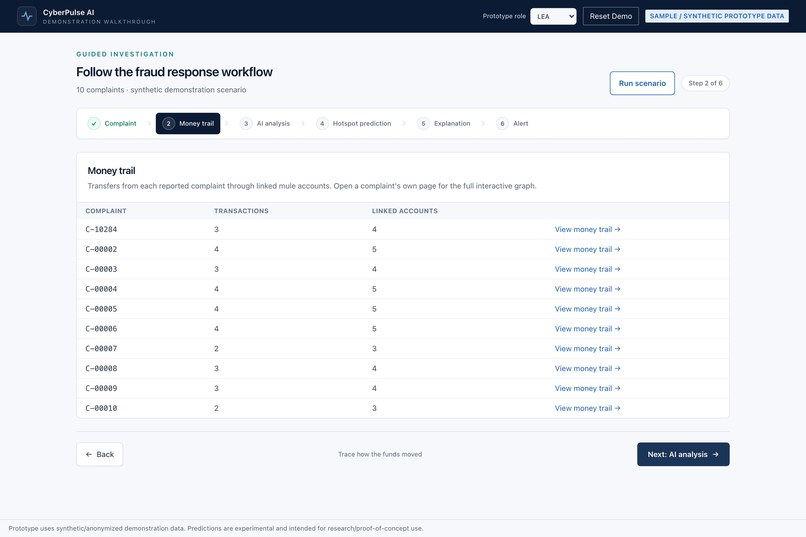
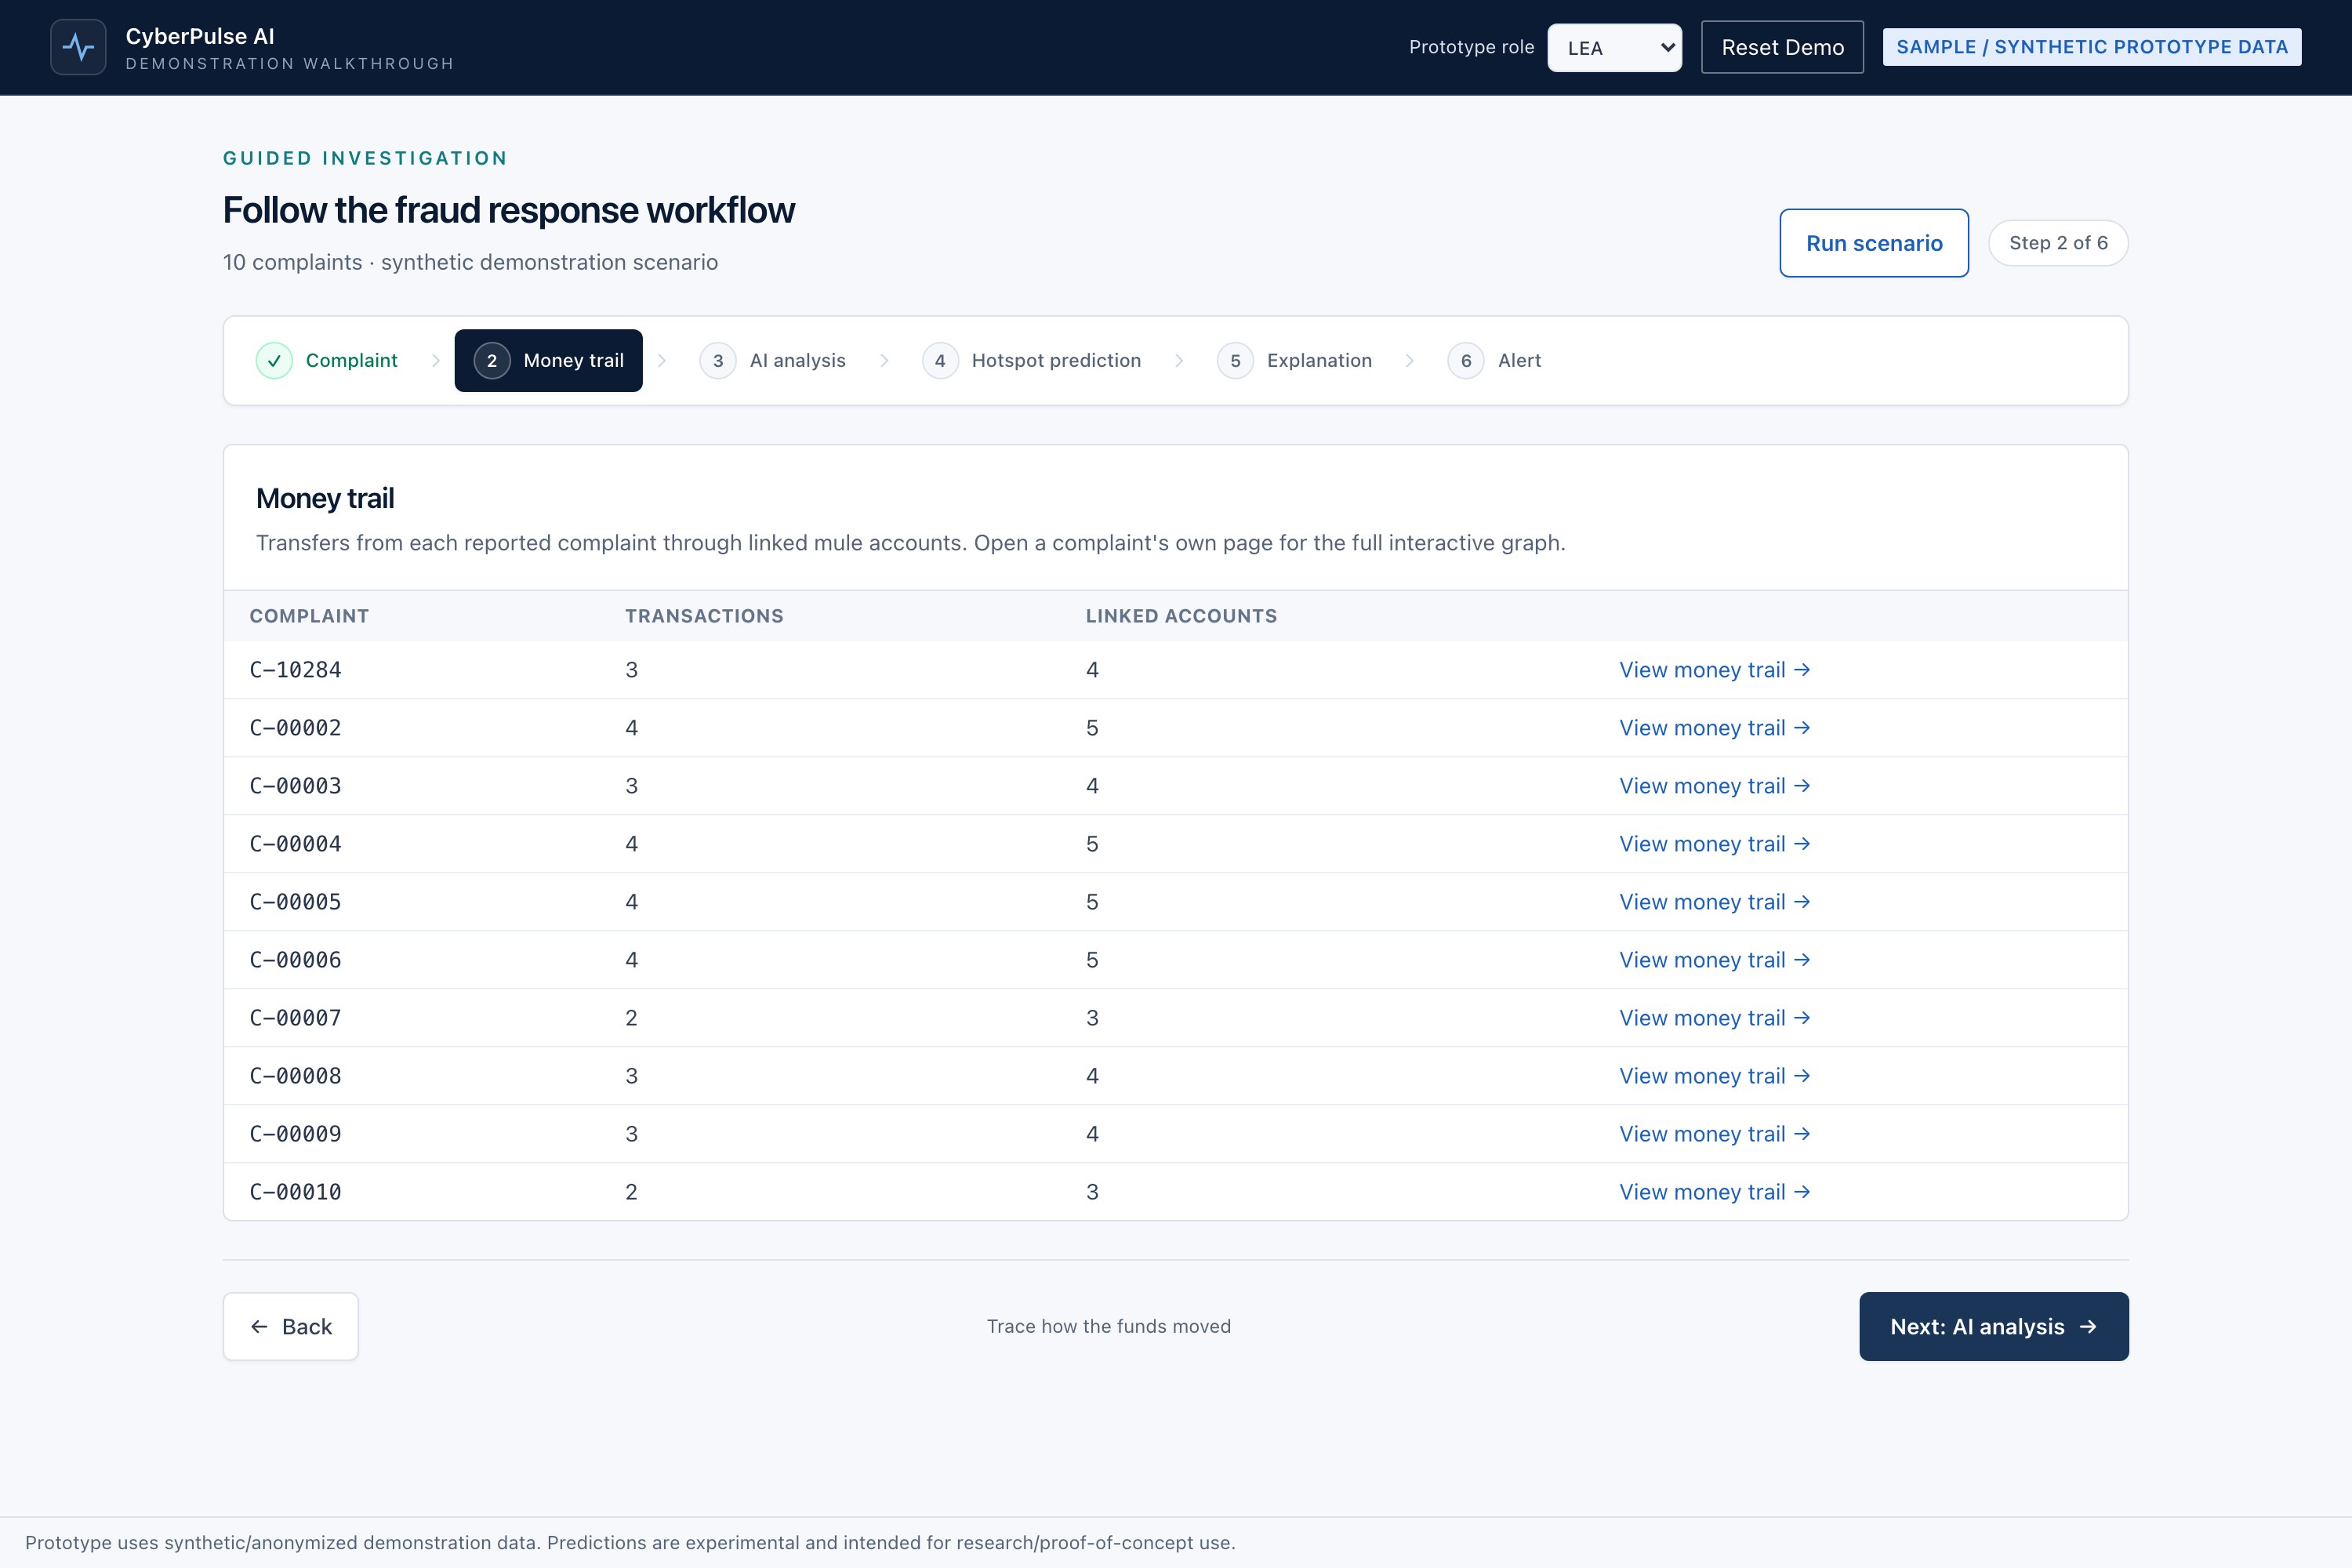
Guided demo, step 2: money trail through mule accounts
-
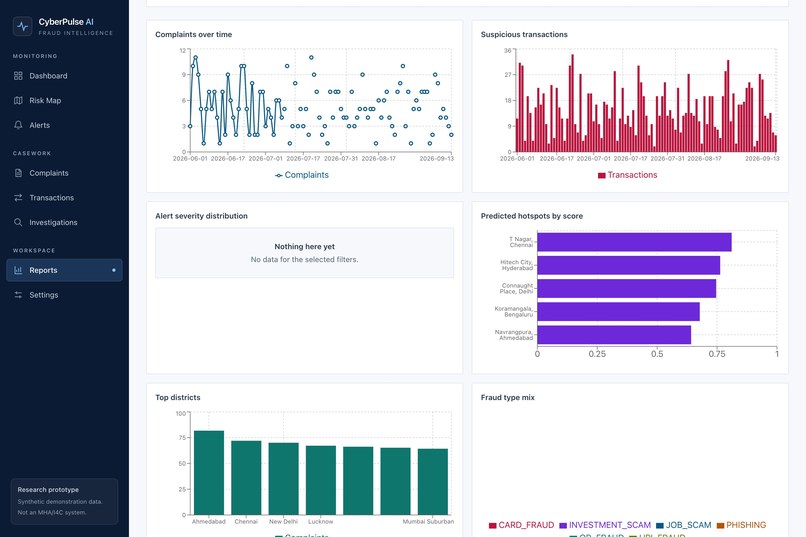
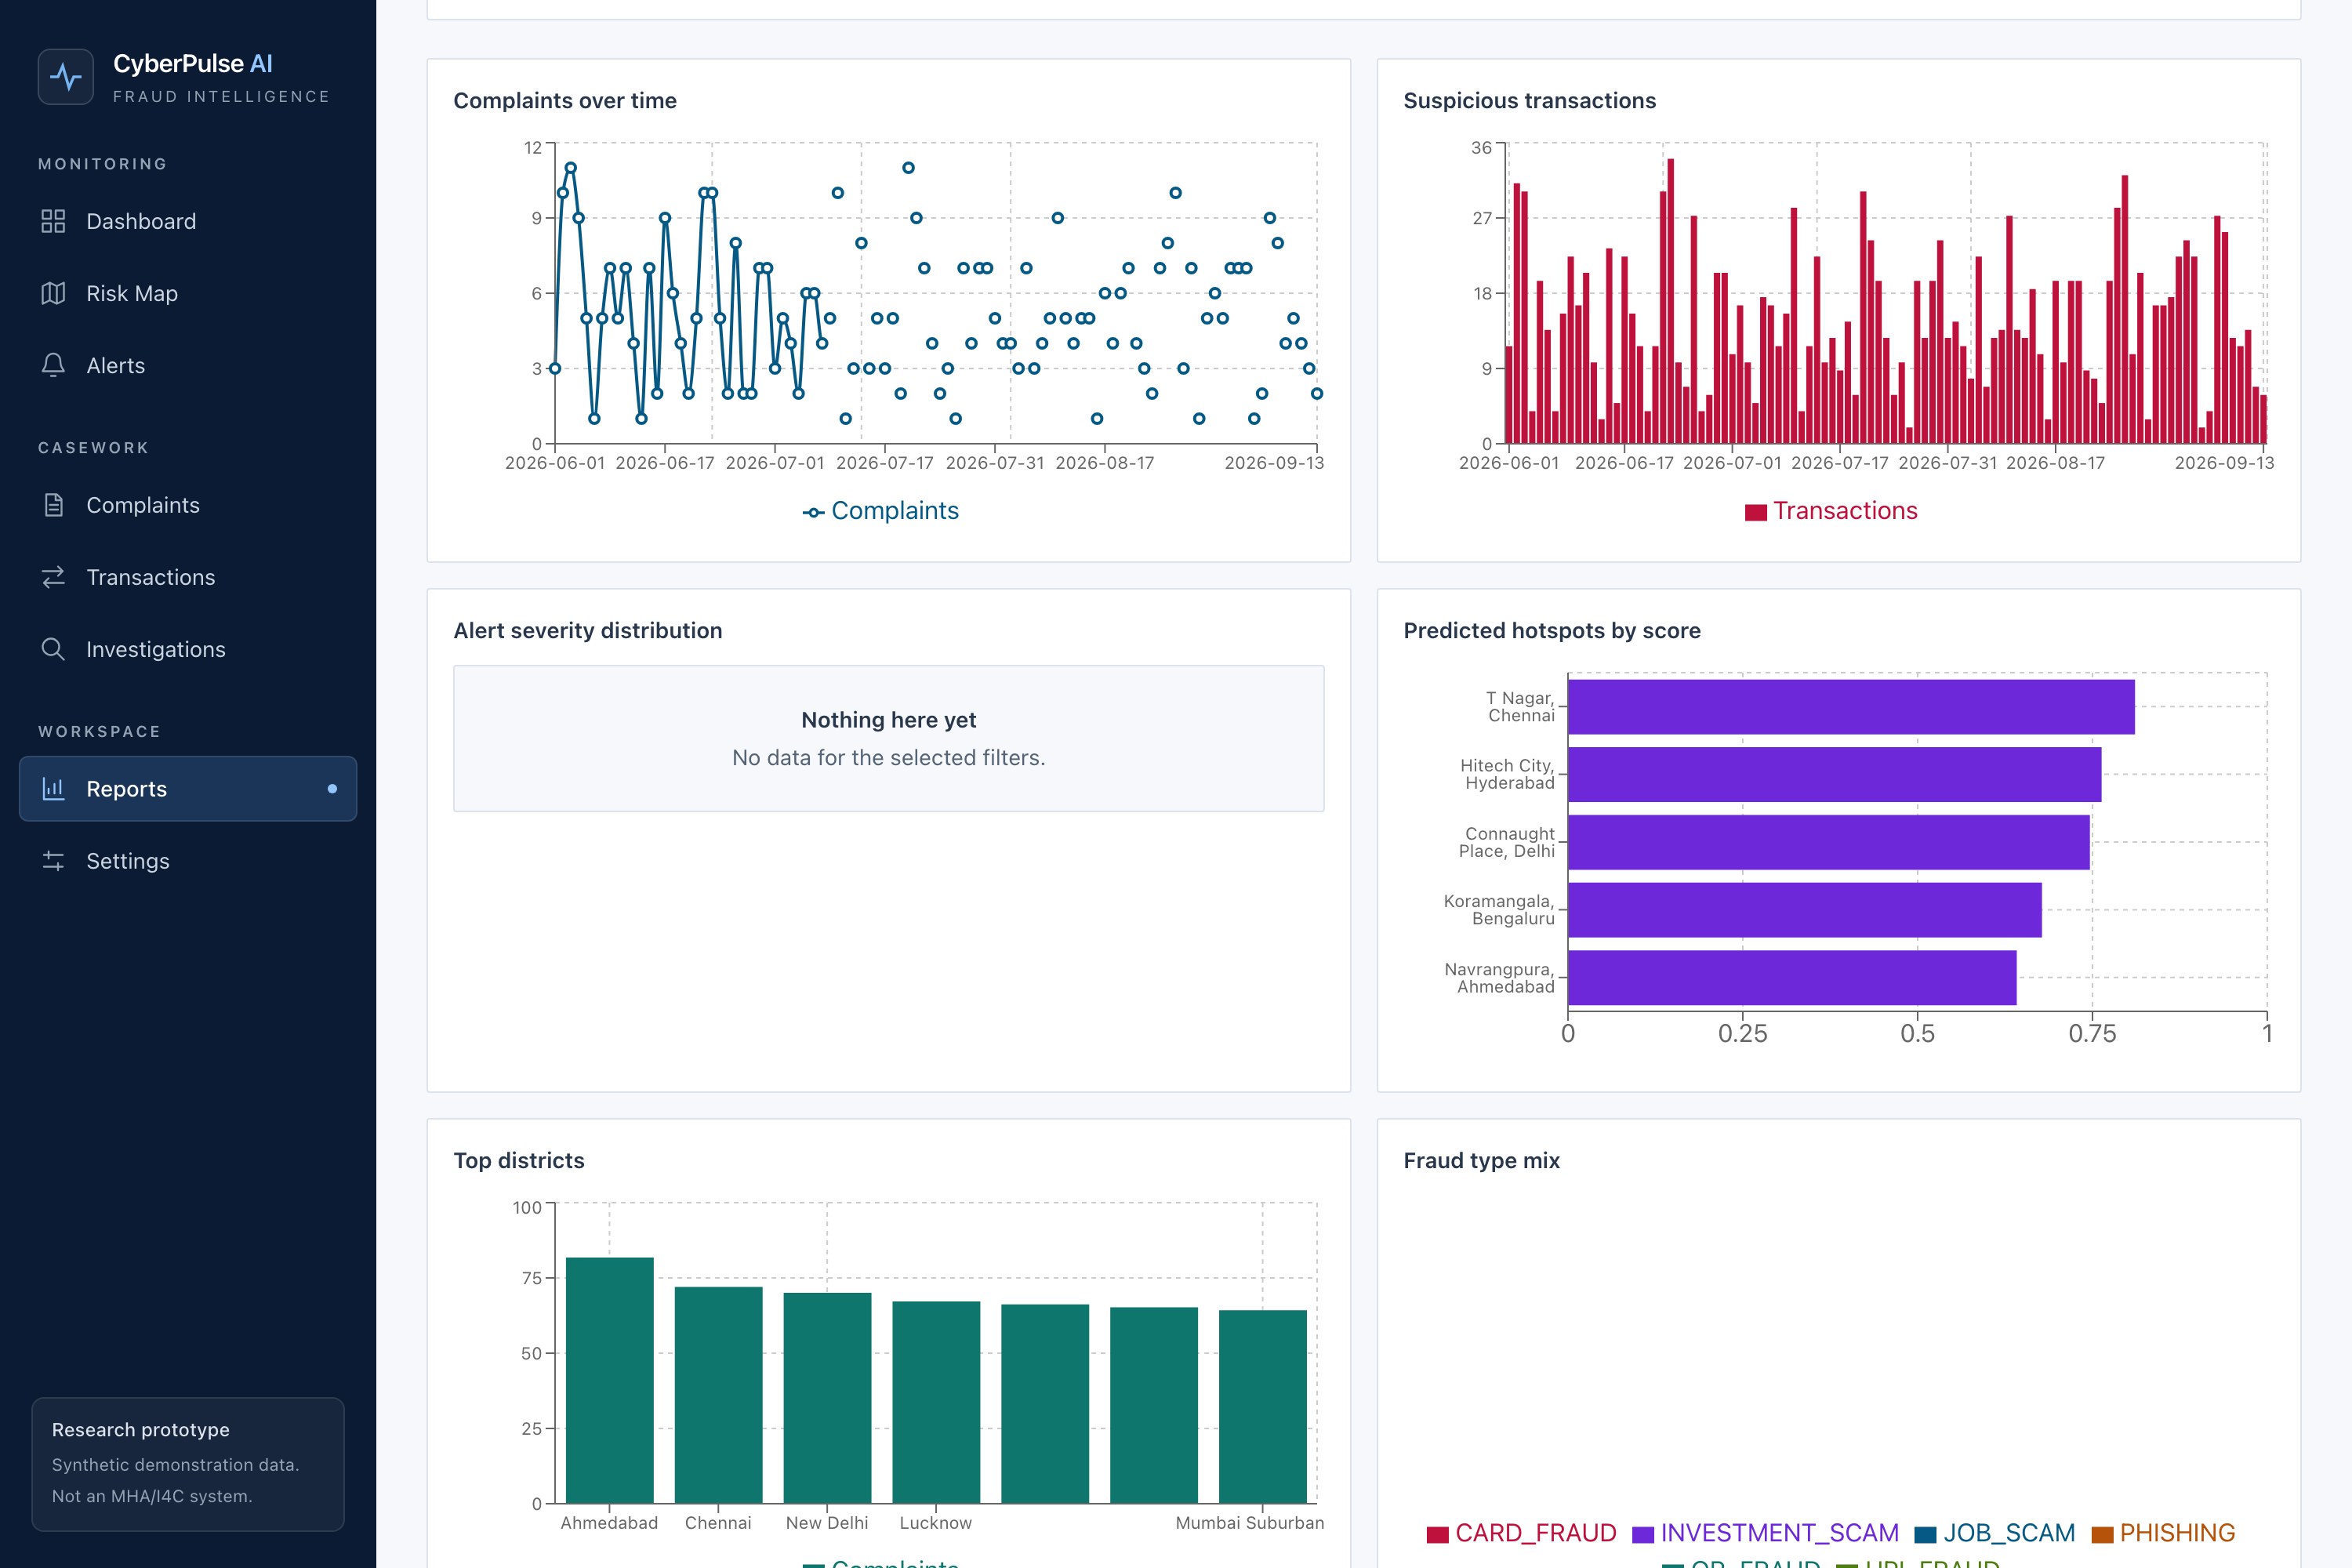
Reports page: hotspots by score and top districts
-
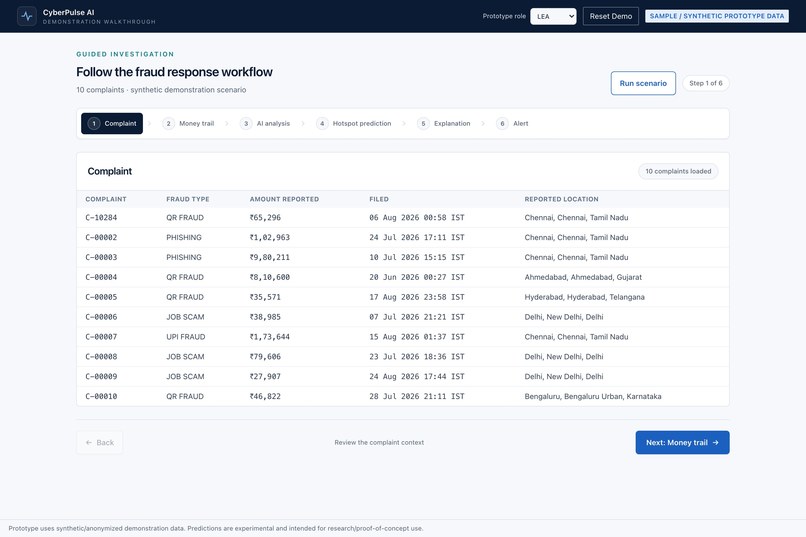
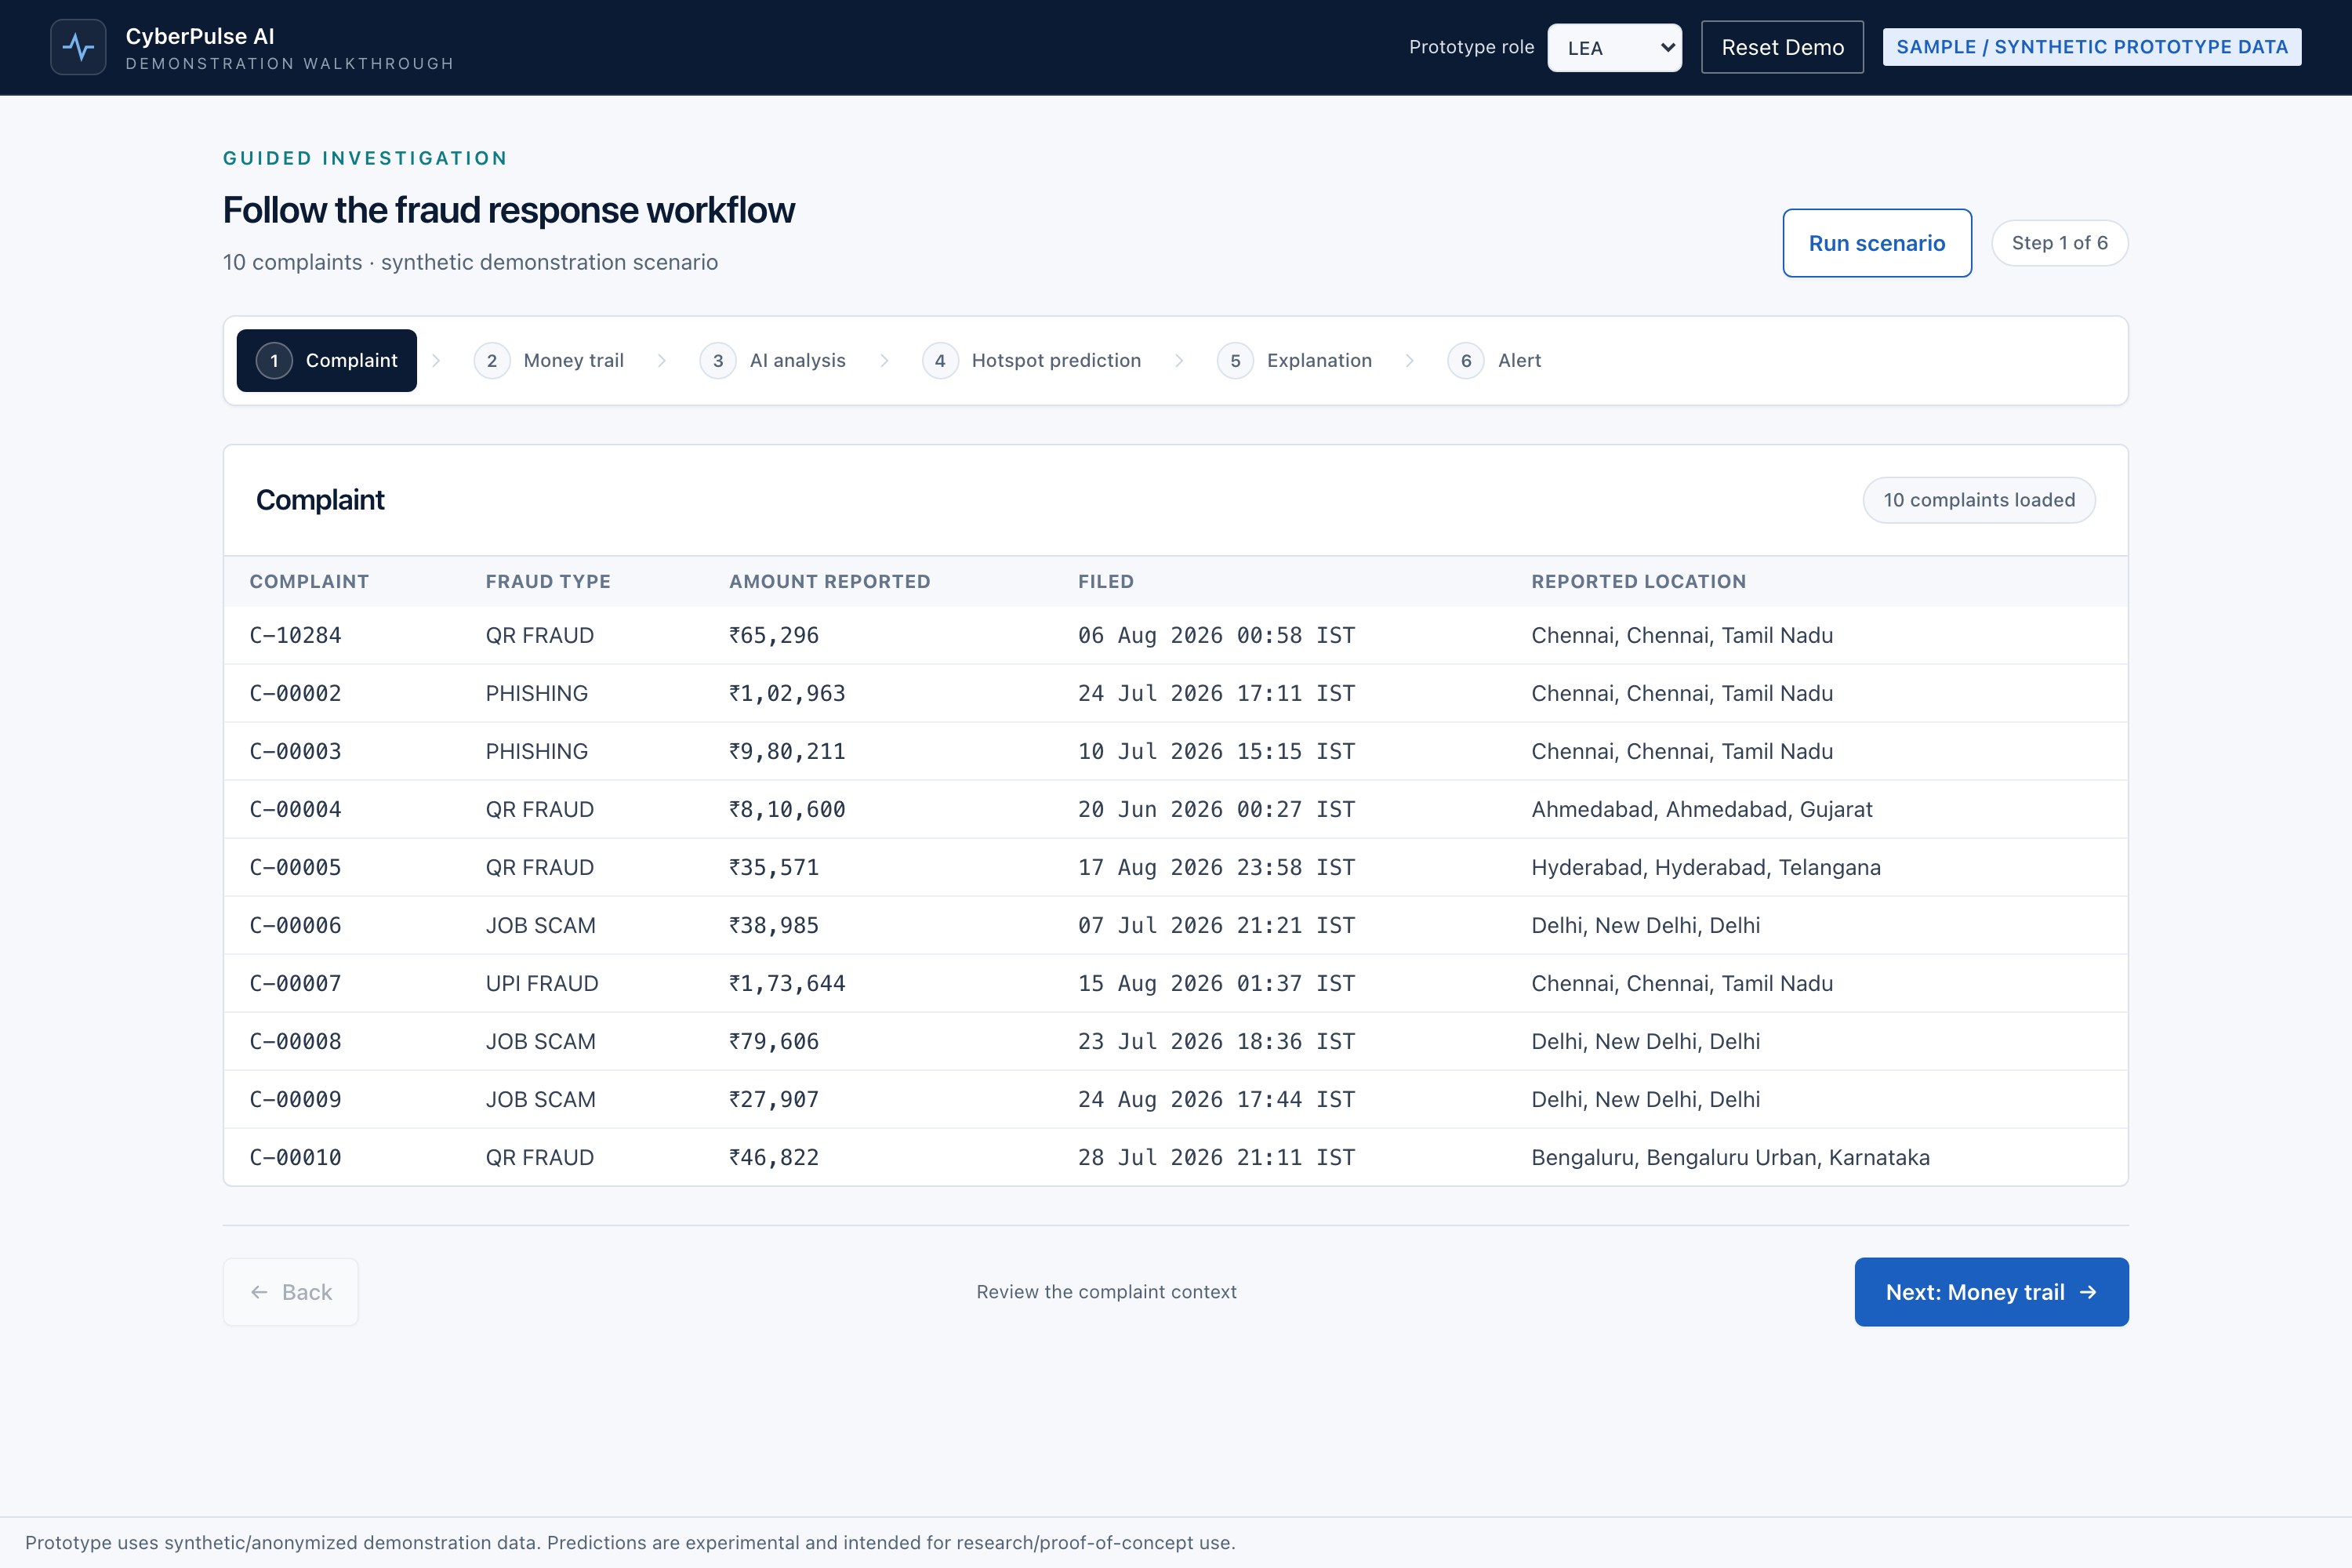
Guided demo, step 1: the 10 scenario complaints
-
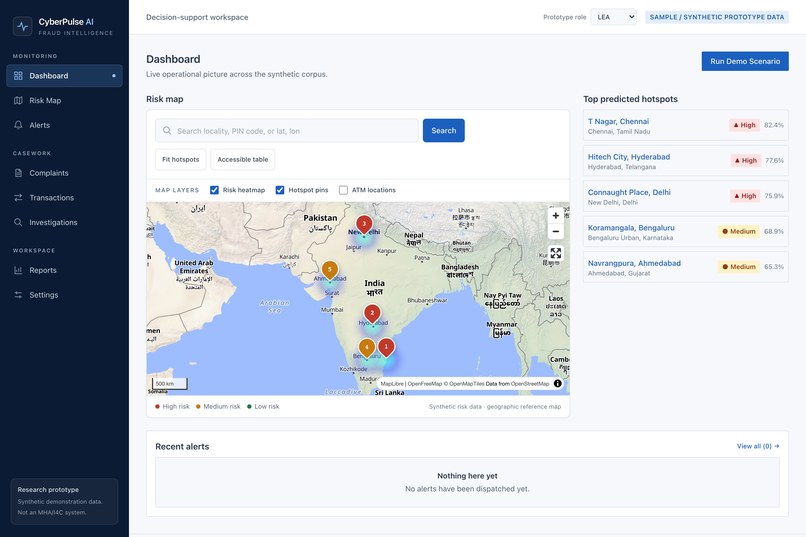
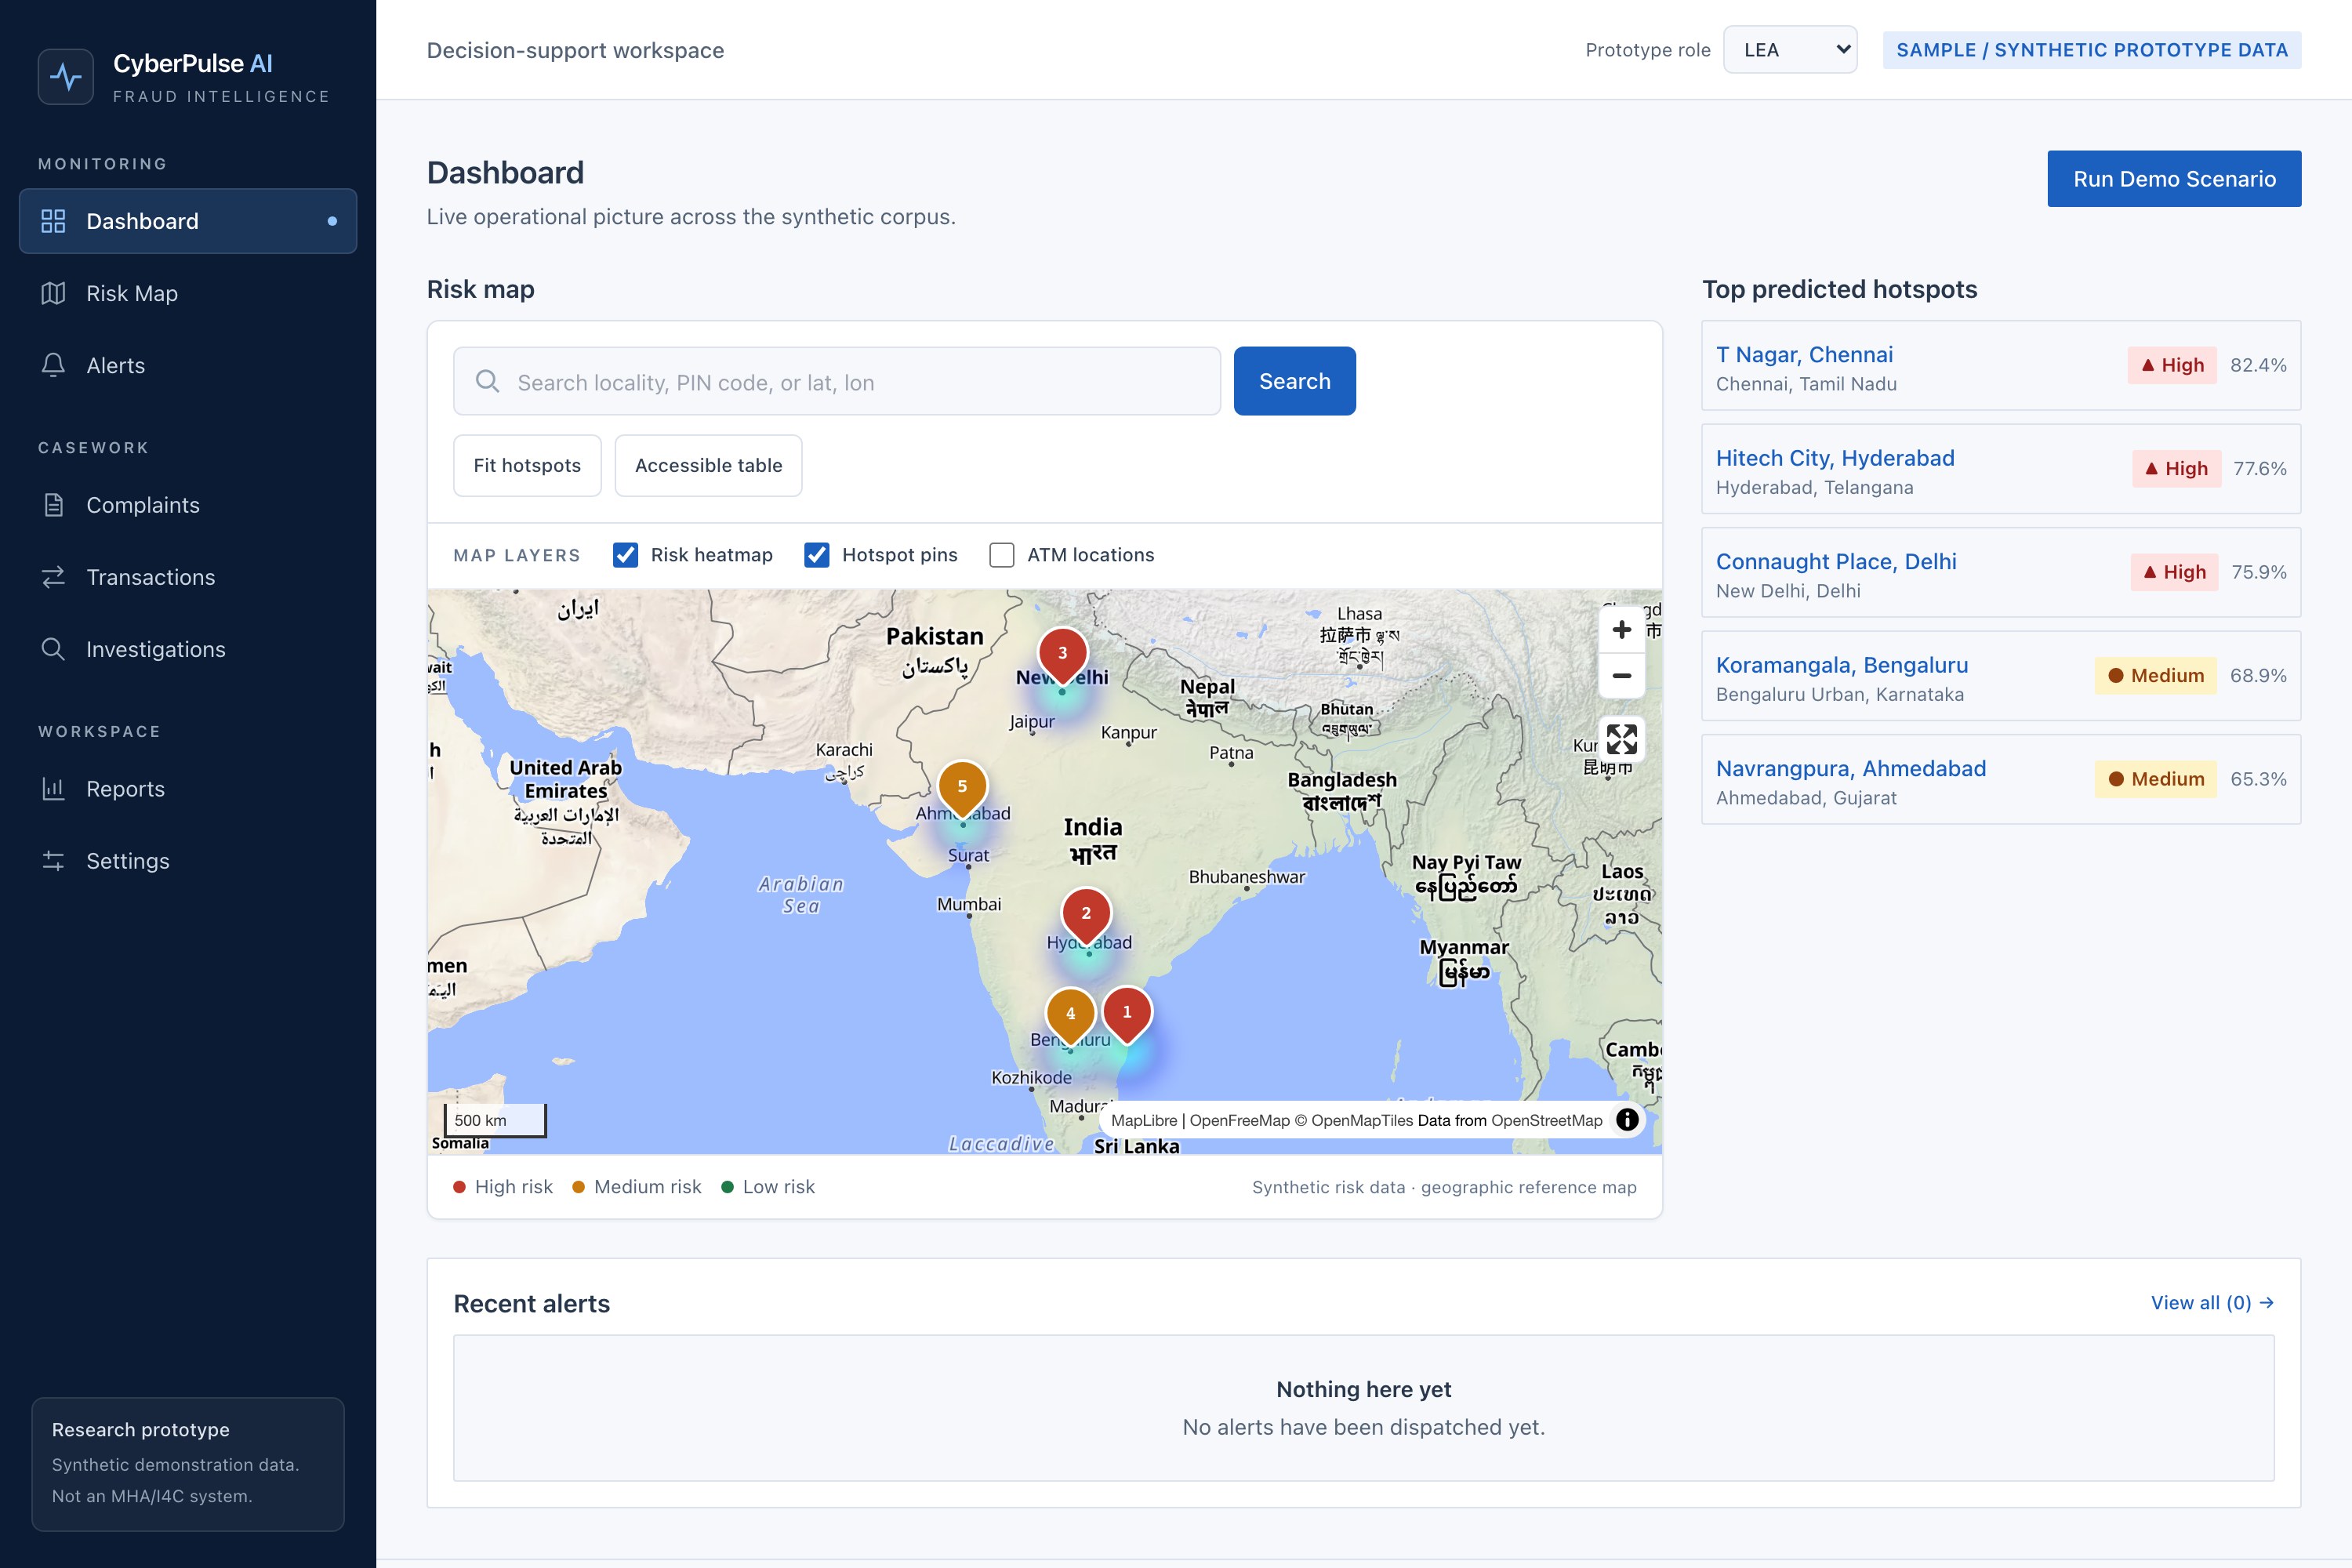
India risk map with the top 5 predicted hotspots
-
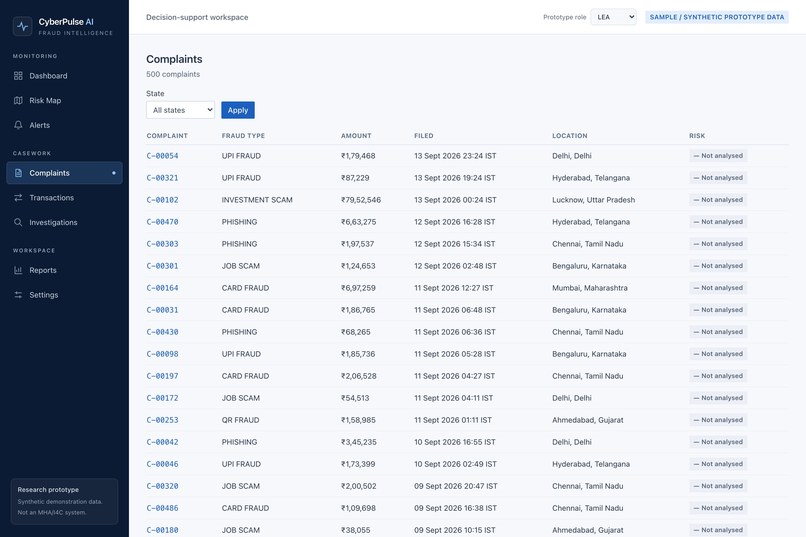
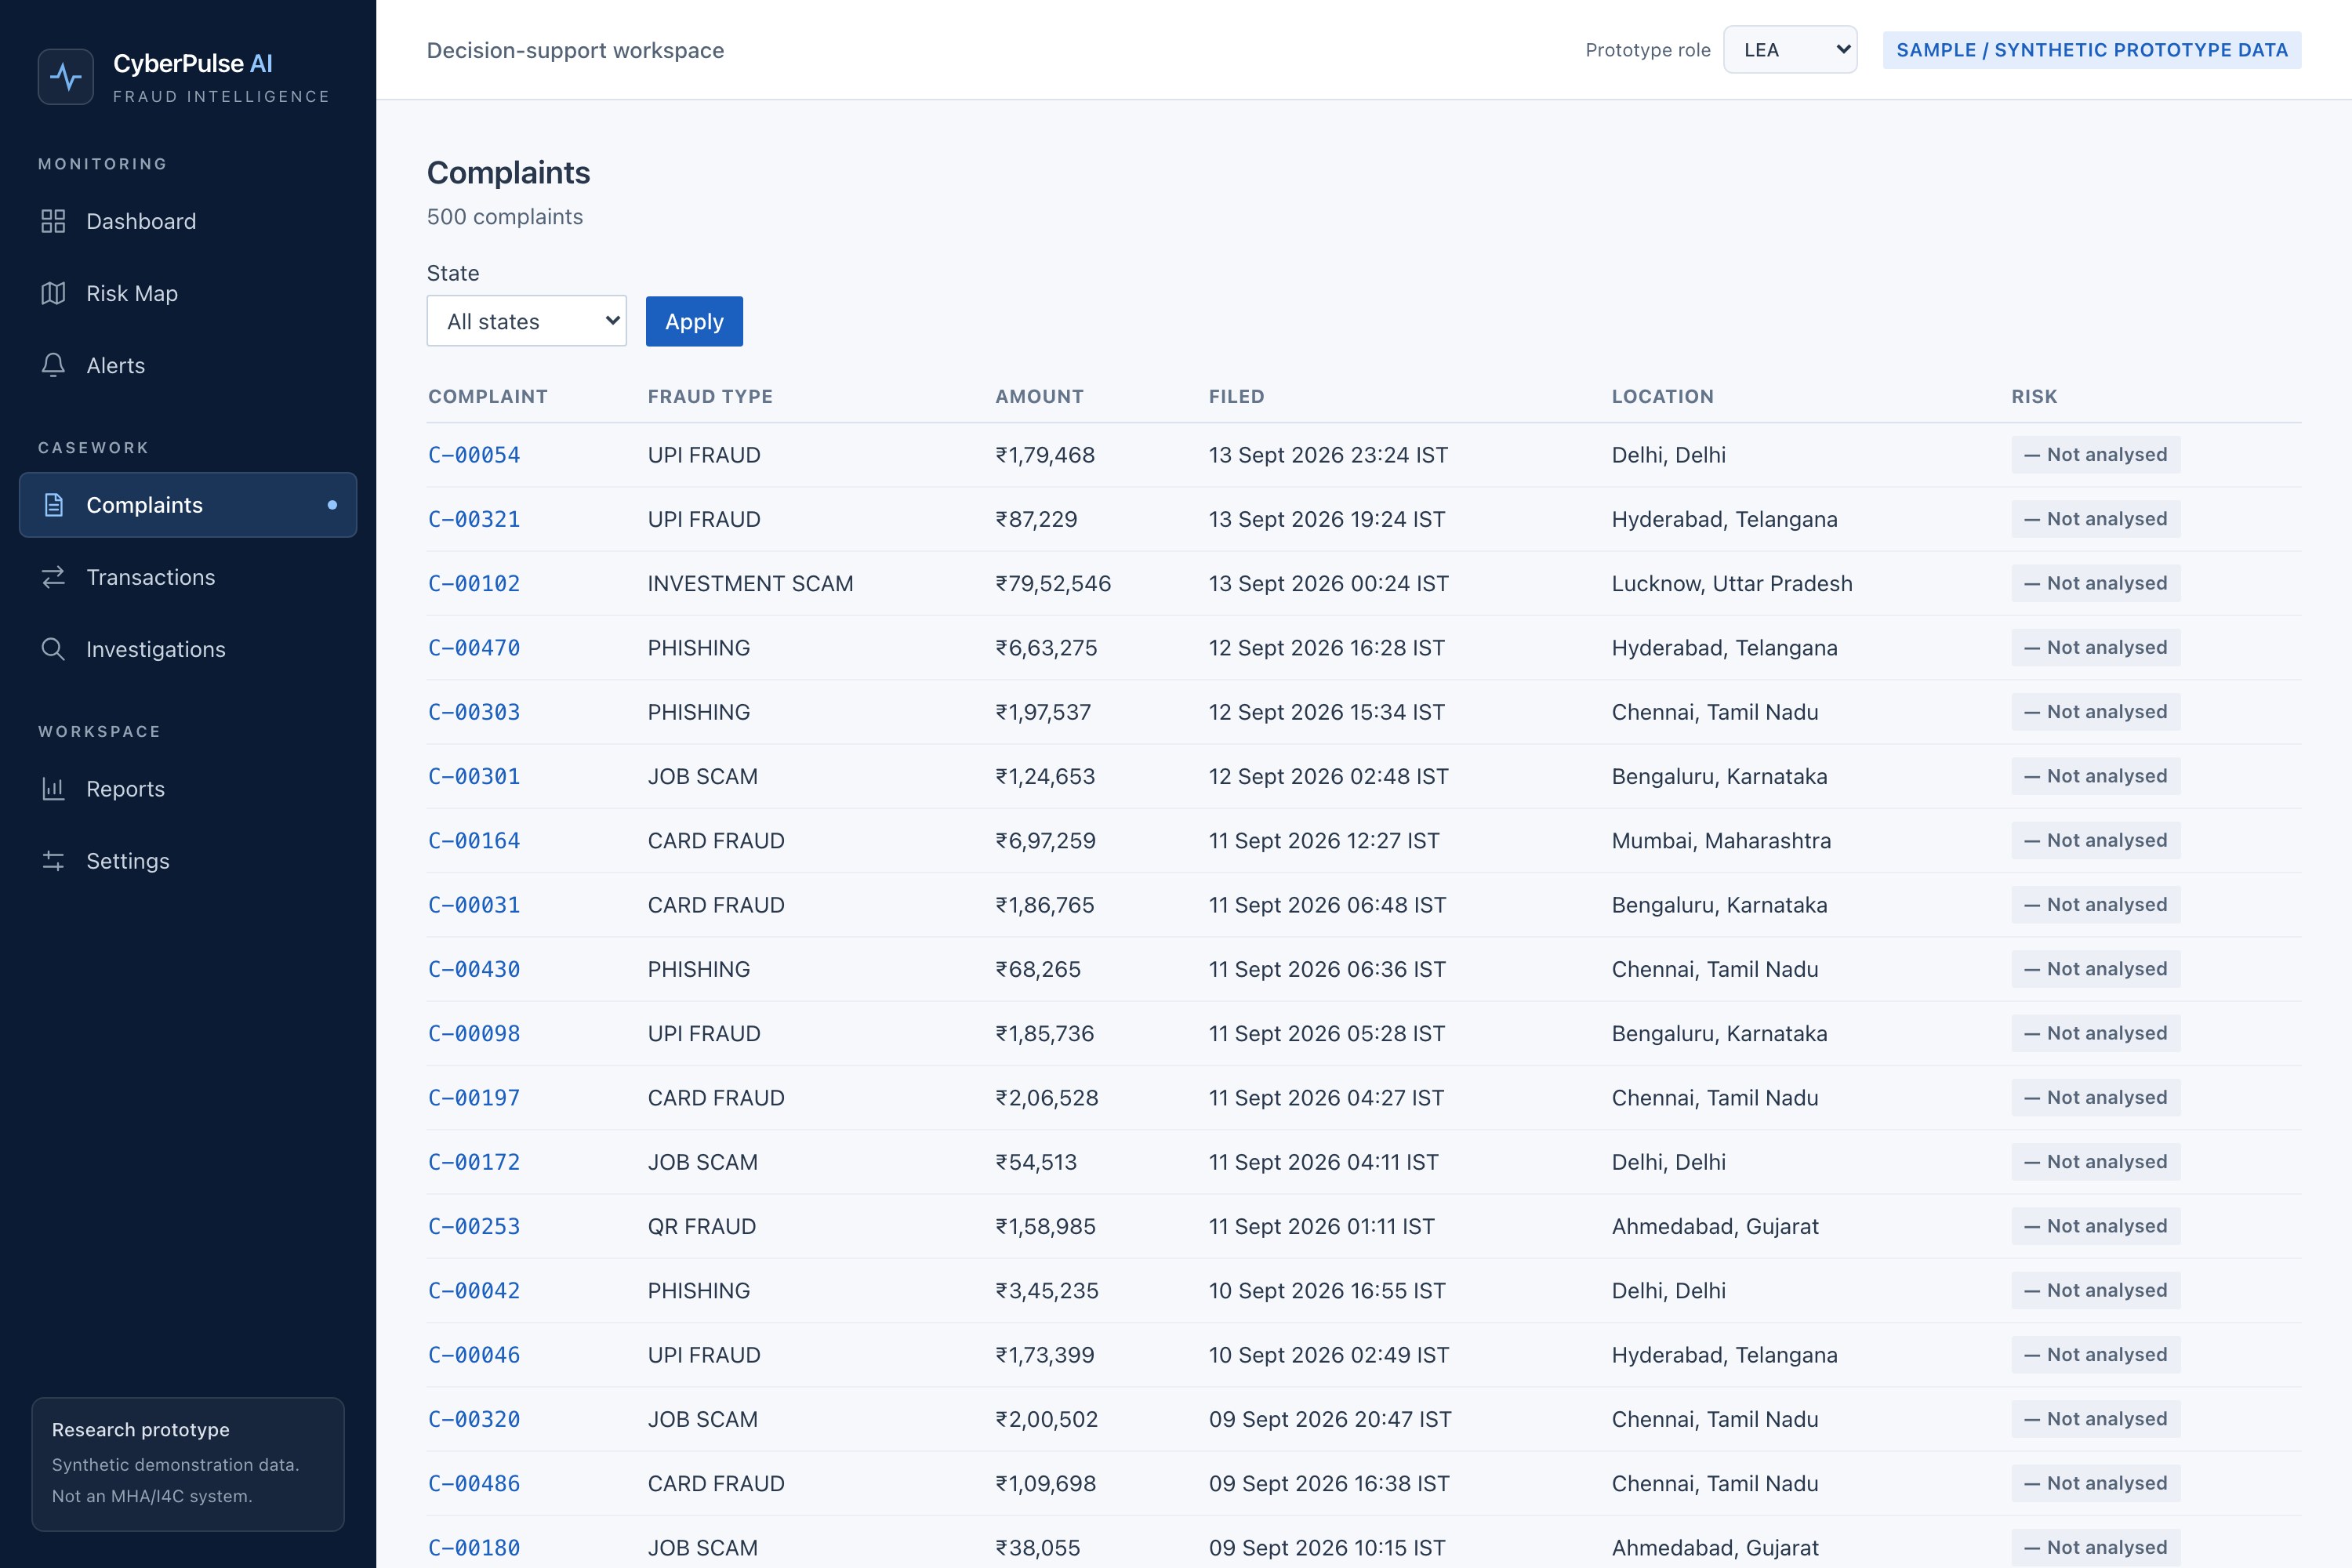
Complaint list (500 synthetic complaints)
-
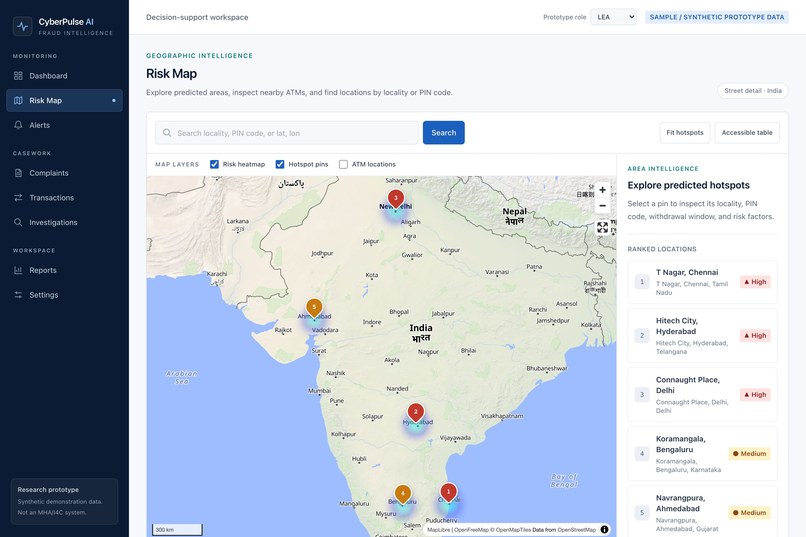
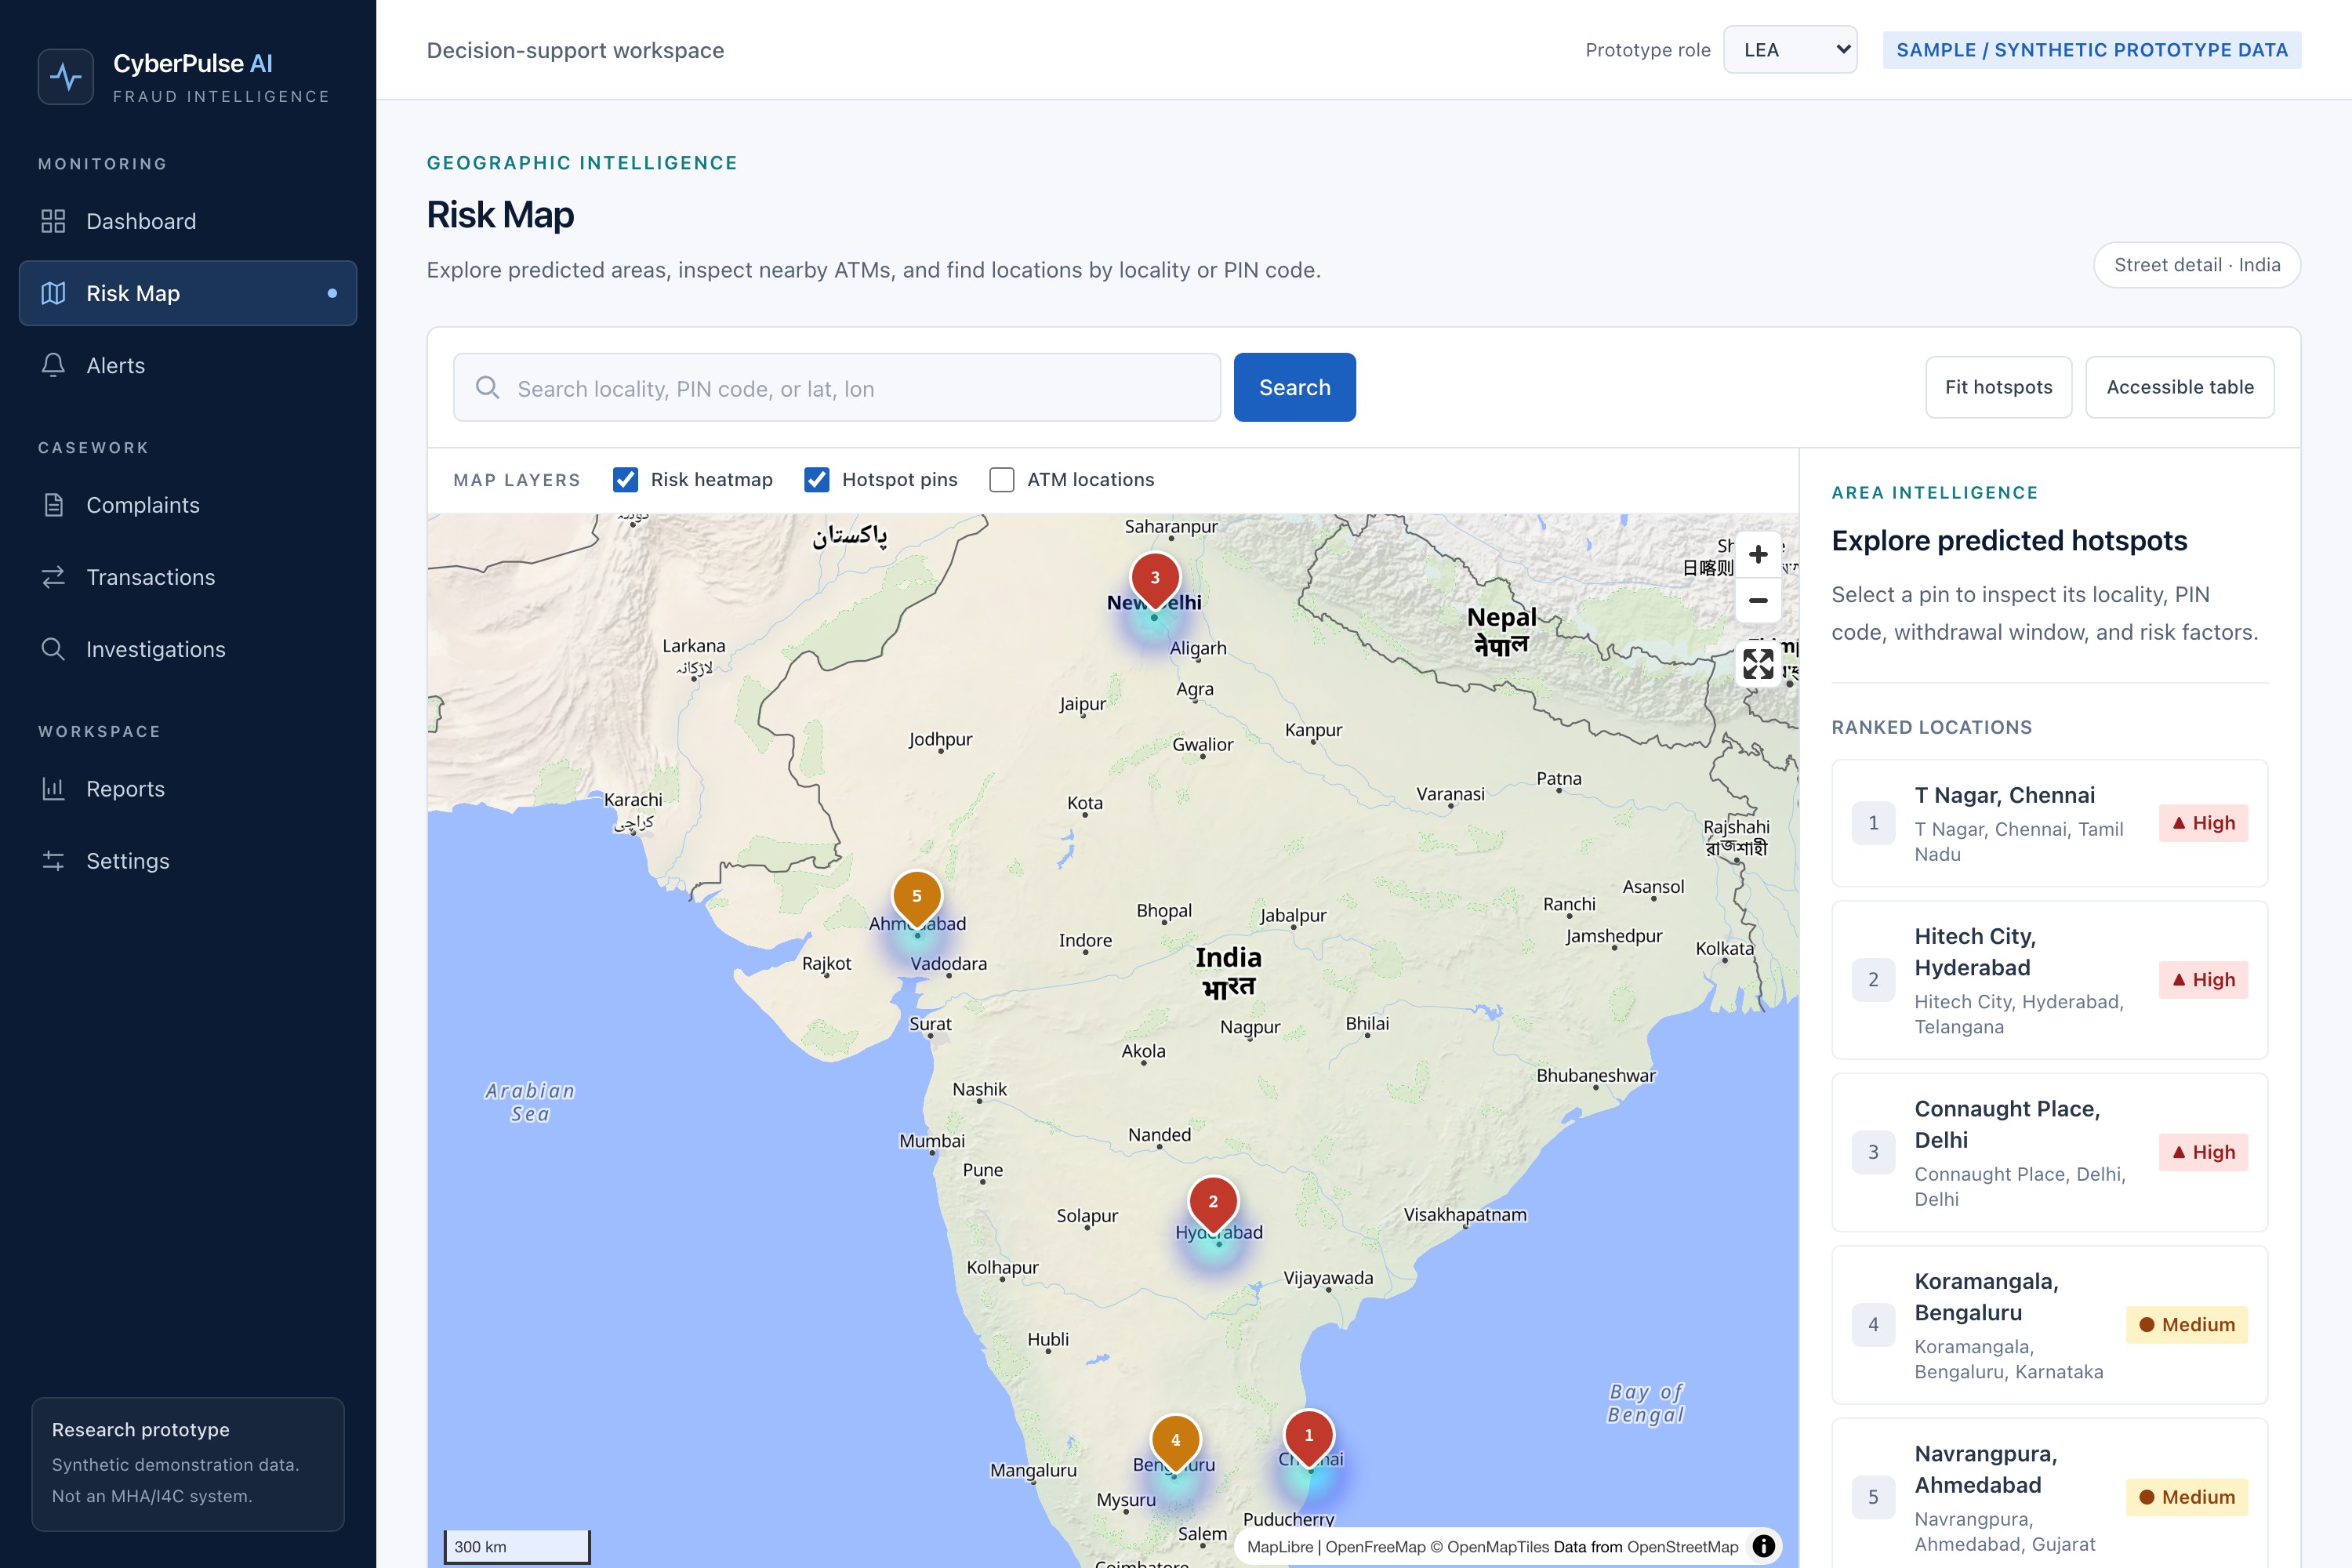
Full risk map with the ranked locations panel
-
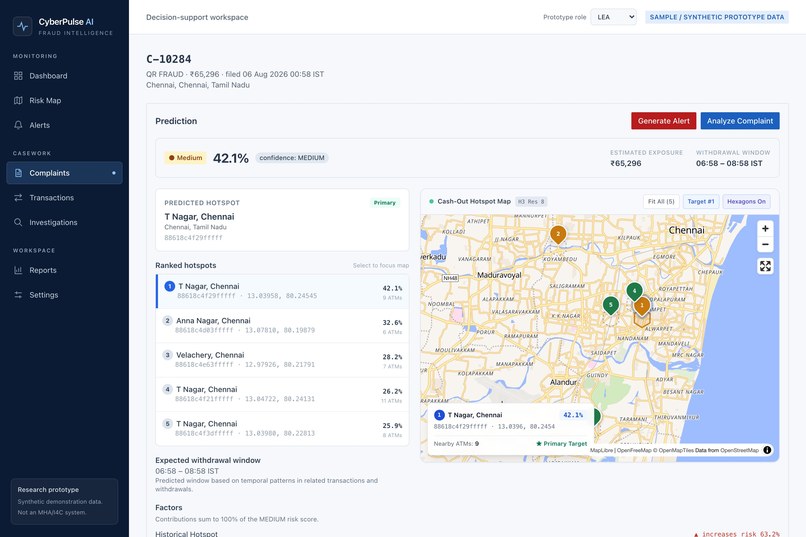
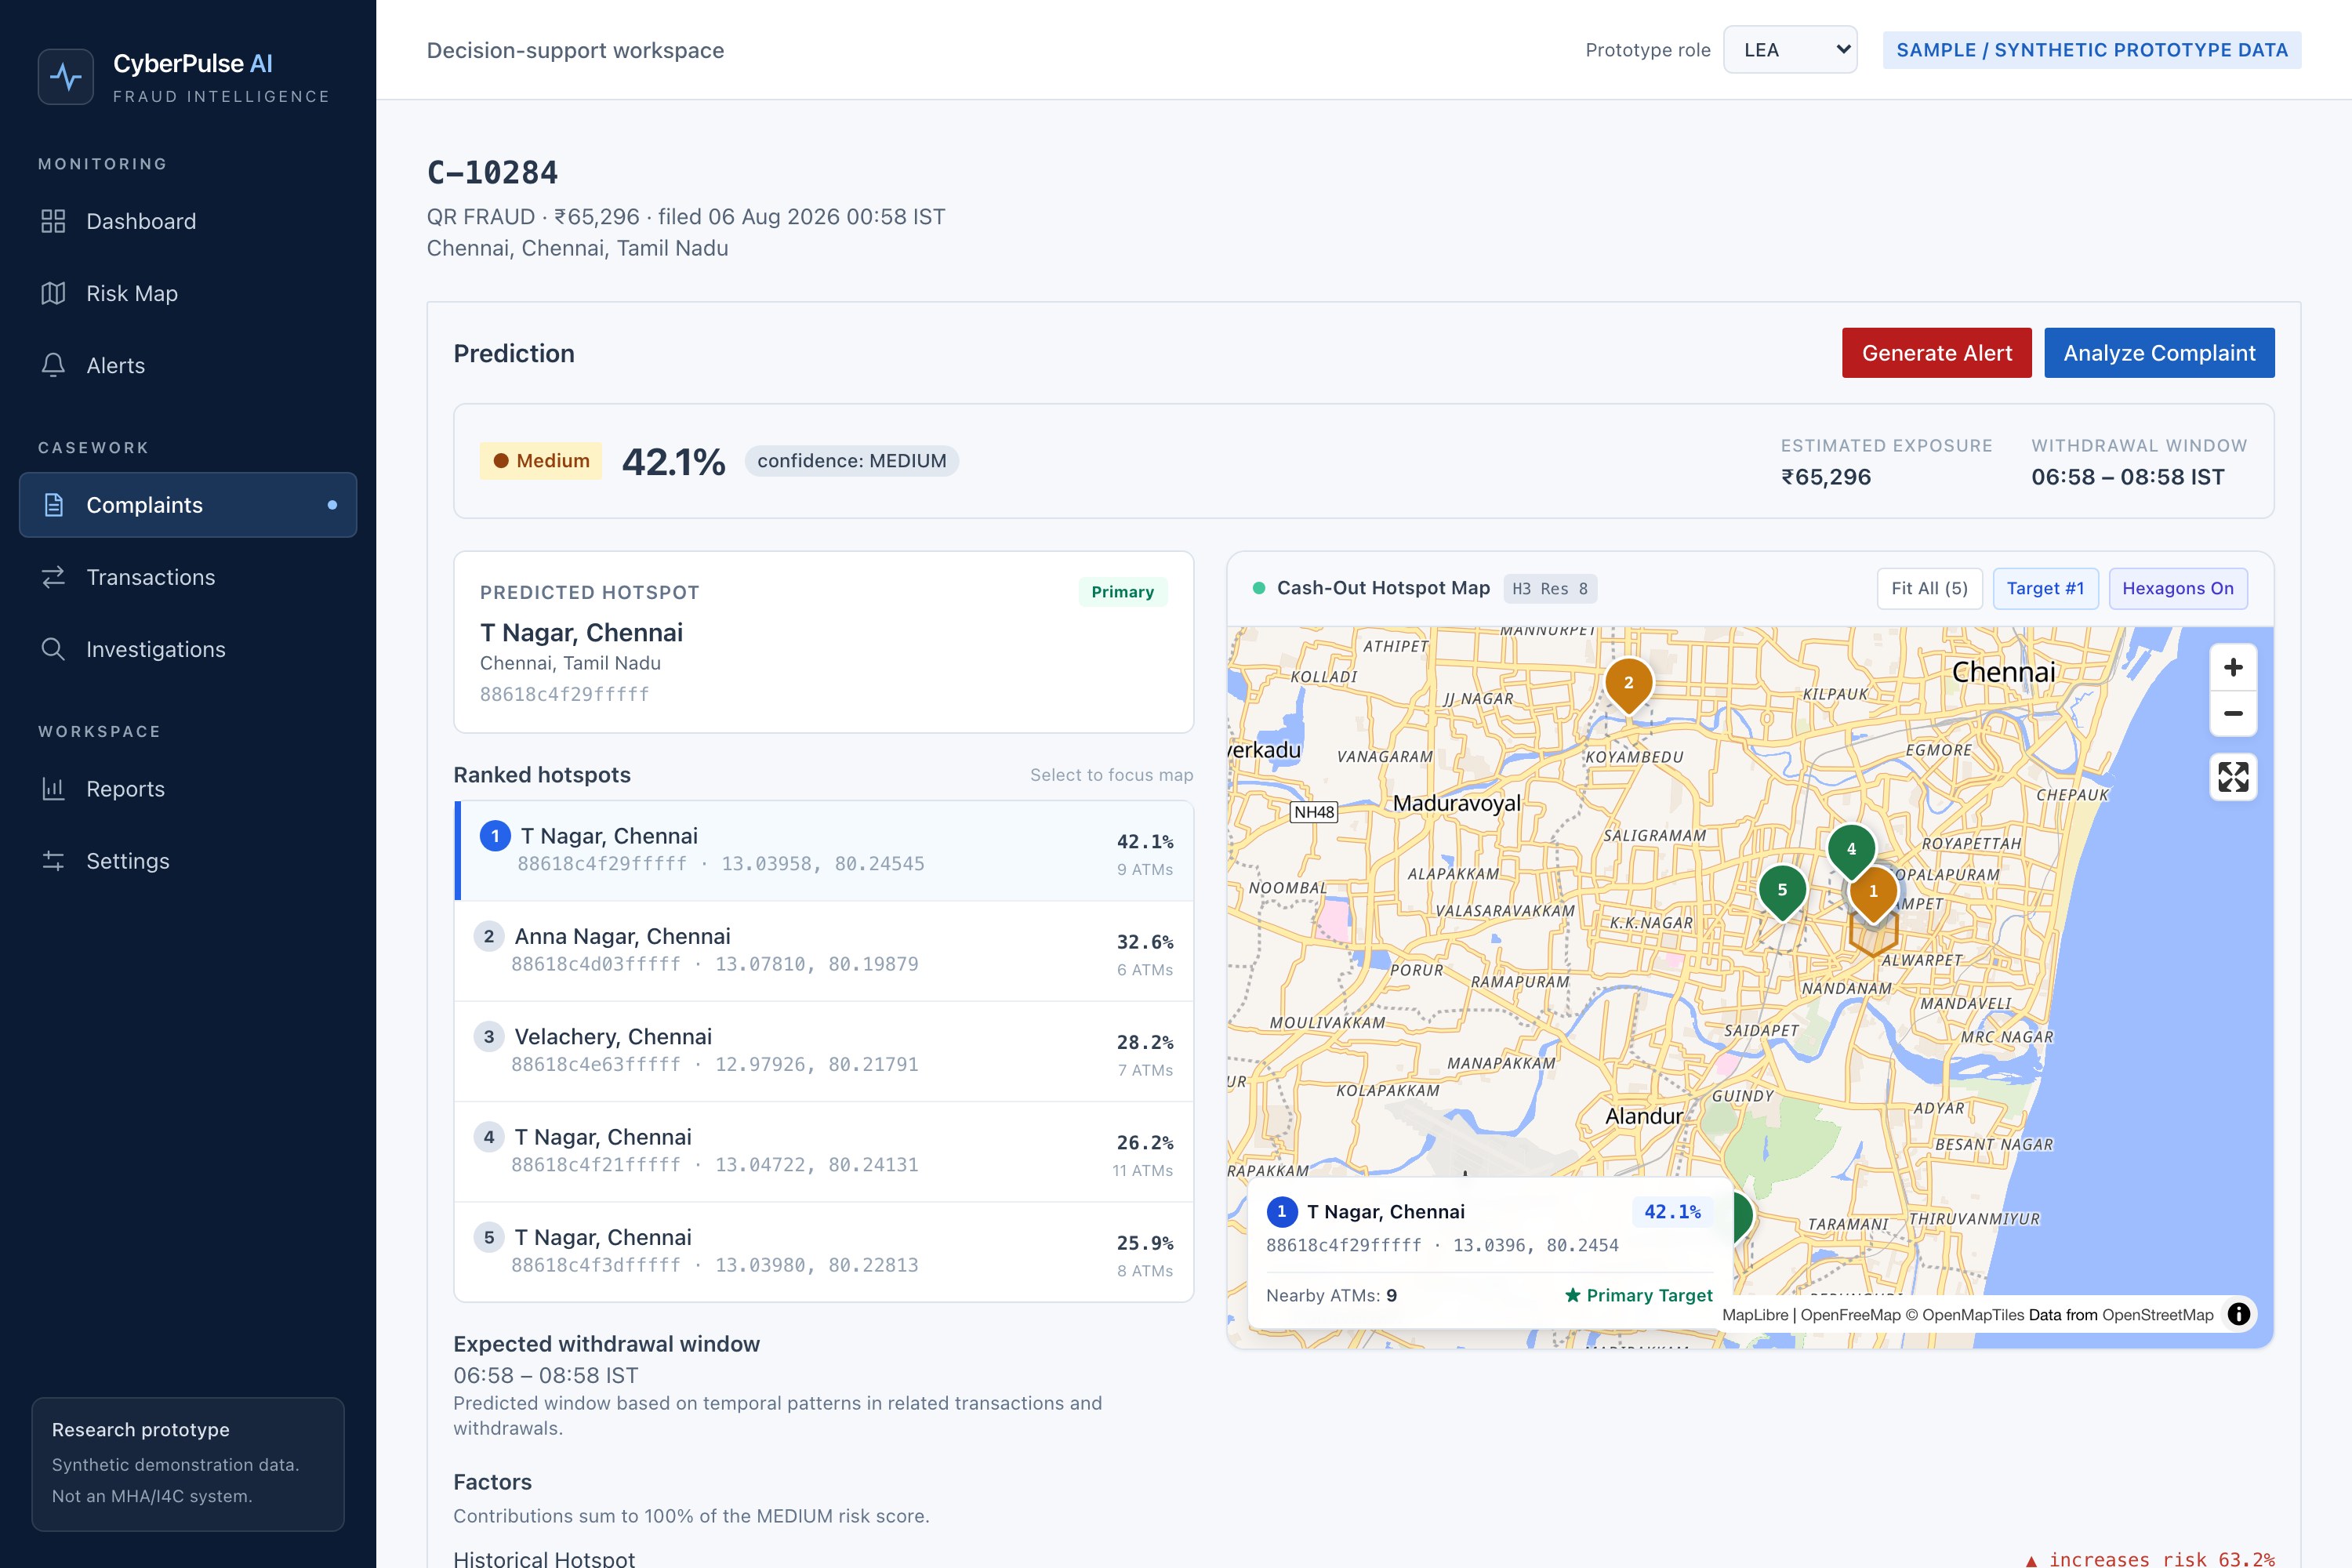
C-10284 prediction: 42.1% Medium, exposure, window, Chennai cash-out map
-
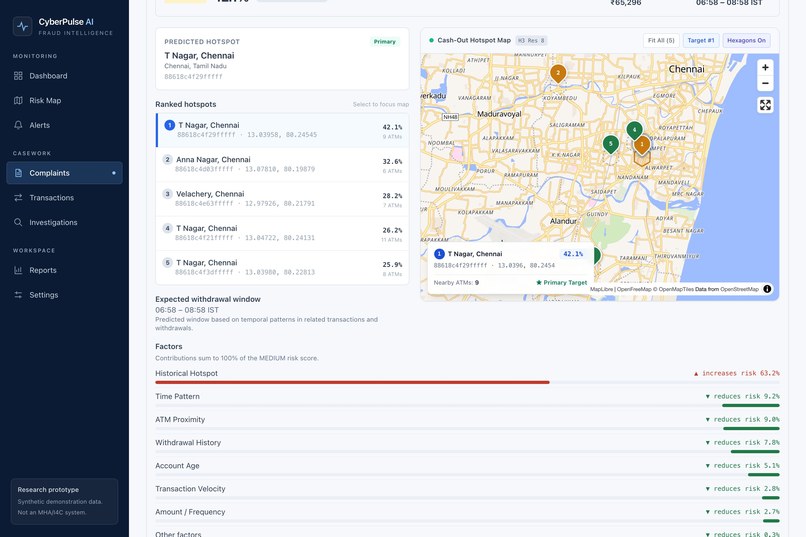
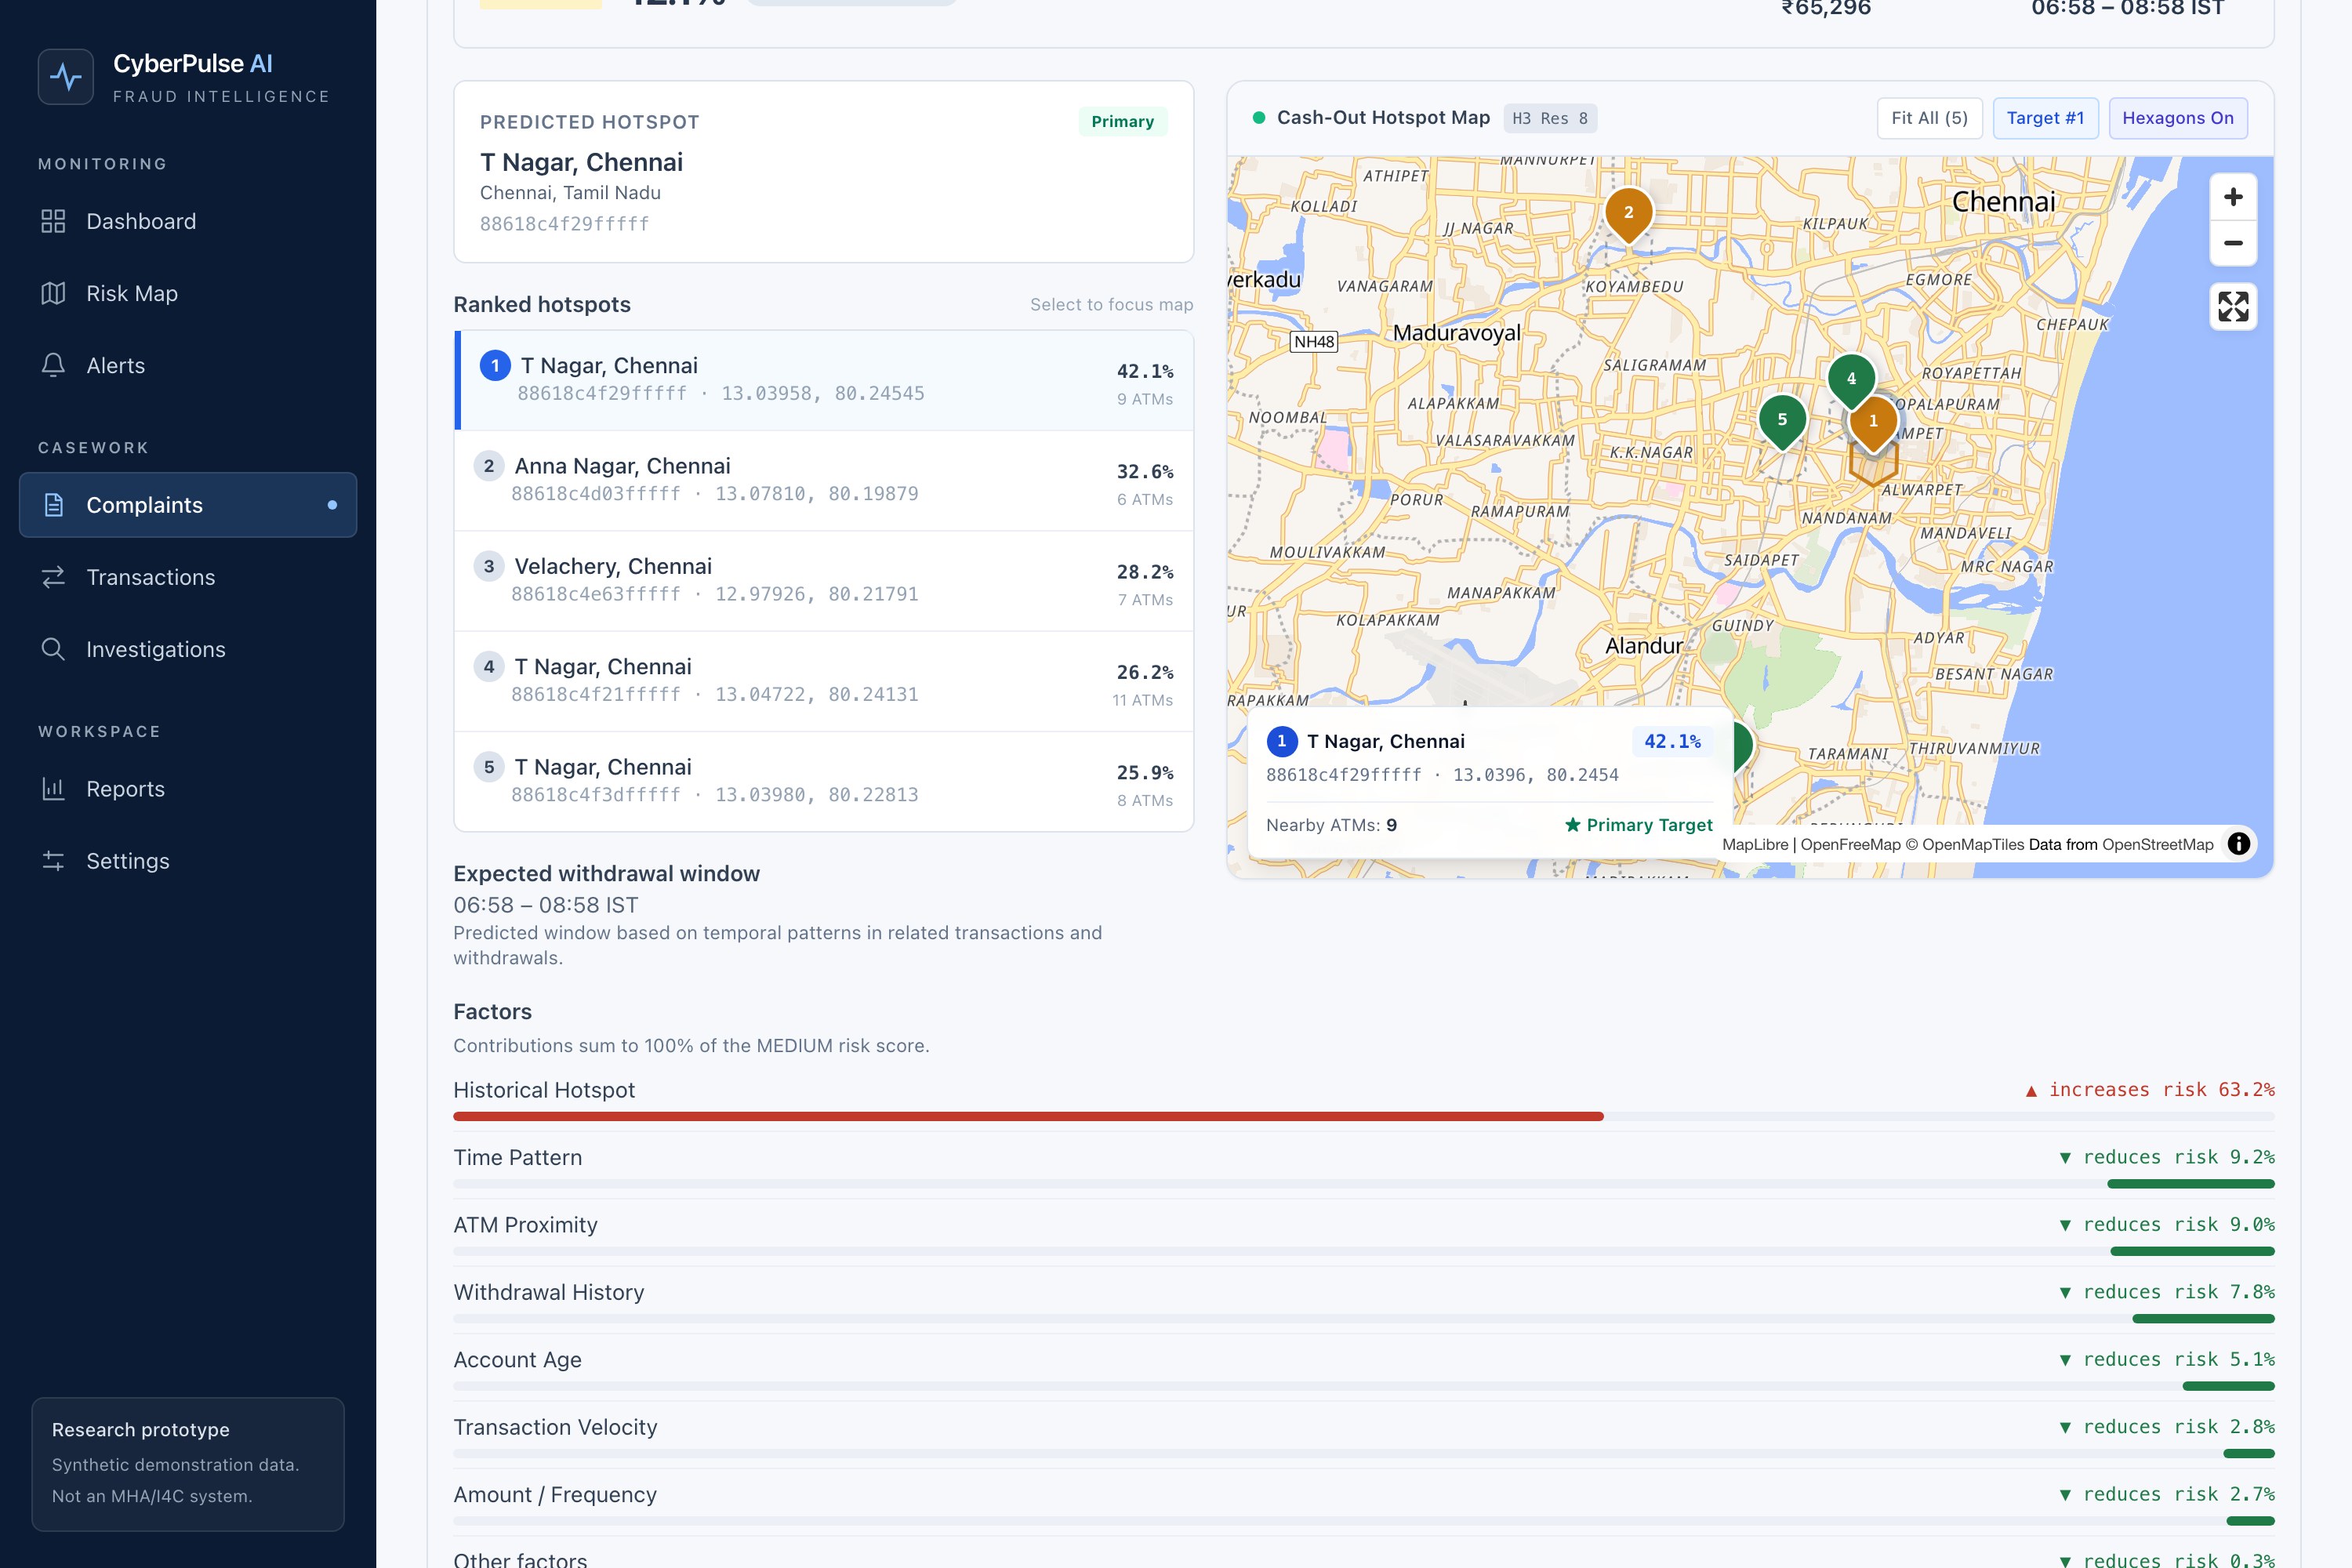
C-10284: ranked hotspots, withdrawal window and SHAP factor bars
Inspiration
When someone in India reports a financial cyber-fraud, the money has usually started moving already. Within minutes it is split across mule accounts, and within hours it is withdrawn as cash. After it leaves the banking system as cash, recovery is close to zero.
Investigators spend those first hours tracing the money backwards. We wanted to work forwards instead: take a complaint and estimate where and when the cash withdrawal is most likely, so there is still time to act. The idea comes from Smart India Hackathon 2026 problem statement PS 26184 (MHA / I4C).
What it does
CyberPulse AI takes a cybercrime complaint and returns:
- Predicted hotspots: a ranked list of localities (H3 cells) where cash-out is likely, shown on a map
- An expected withdrawal window: a time range of at most 4 hours, with a confidence level
- A risk score with reasons: SHAP factors in plain language that an investigating officer can read out to a supervisor
- A money-trail graph of the mule-account chain behind the complaint
- A high-risk alert that opens an investigation and writes an audit record
It is decision-support intelligence. It predicts locations and time windows, never people, and it never takes action on its own.
How we built it
- Web: Next.js (App Router) + TypeScript, with MapLibre for the map, React Flow for the money-trail graph, Recharts and TanStack Query
- ML service: FastAPI running three tabular models: an XGBoost risk classifier, an XGBoost temporal classifier and an unsupervised hotspot engine (DBSCAN/KDE over H3), with exact SHAP via TreeExplainer
- Data: PostgreSQL (Neon) through Drizzle ORM. Money is stored as integer paise and every timestamp is in UTC
- Contracts: one JSON Schema generates both the Zod types (web) and the Pydantic types (ML), so the two services cannot drift apart
- Synthetic data: a deterministic generator (seed
26184) builds the complaints, transaction chains and withdrawals. Two gates cannot be skipped:signal_checkbefore training andpii_scanbefore seeding
The ML service has no database credentials. The web app validates every ML response against the shared schema, then saves it inside a single transaction. We did not use an LLM anywhere in the prediction path, so every number is reproducible, attributable and checkable offline.
Confidence comes from how far the top candidate is ahead of the second, not from how high the top score is. With top score \( s_1 \) and margin \( m = s_1 - s_2 \):
$$ \text{confidence} = \begin{cases} \text{HIGH} & m \ge 0.15 \text{ and } s_1 \ge 0.70 \ \text{MEDIUM} & m \ge 0.07 \ \text{LOW} & \text{otherwise} \end{cases} $$
Challenges we ran into
- Our own data leaked the answer. The first training set included withdrawals that happened after the complaint was filed. Recall looked fine until we rebuilt the features point-in-time. Then the old model's recall dropped to 0.06, and we retrained it.
- The cash had always already been withdrawn. In our first generator, every complaint was filed after its own cash-out, so the time model had nothing to predict. We redrew the reporting and cash-out delays so the timing is actually forecastable.
- Some ranking gates could not be reached. A 324-combination hyperparameter search hit a ceiling of about 0.30, which told us the limit came from the generator, not the model.
- Calibration collapsed ties. Isotonic calibration reduced roughly 6,400 scores to 31 distinct values, which hurt the ranking. We kept it because a percentage shown to an officer has to be calibrated.
Accomplishments that we're proud of
Every number on screen comes from the model. The UI shows no placeholder scores, no cached predictions and no fallback defaults. If the prediction service is down, it says "prediction service unavailable" and shows no numbers at all. Our tests intercept the API response, change it, and assert that the UI shows the changed values.
All release gates cleared on a synthetic holdout split by complaint:
| Metric | Gate | Result |
|---|---|---|
| ROC-AUC | ≥ 0.85 | 0.978 |
| PR-AUC | ≥ 0.45 | 0.693 |
| Recall / Precision | ≥ 0.70 / 0.75 | 0.816 / 0.800 |
| Calibration ECE | ≤ 0.10 | 0.003 |
| Top-1 / Top-3 / Top-5 hotspot hit rate | 0.45 / 0.72 / 0.85 | 0.813 / 0.841 / 0.869 |
| Time window within ±1 bin | ≥ 0.75 | 1.000 |
A shuffled-label ablation scored 0.12 against a random baseline of 0.06, so the model is not simply memorising the labels.
What these numbers mean: they measure how well the pipeline recovers patterns we planted in synthetic data. They do not measure real-world accuracy. On top-3 hit rate, simple baselines (historical frequency 0.879, logistic regression 0.869) still beat XGBoost (0.841), and we report that openly.
What we learned
- Look for leakage before you tune. A suspiciously good number is a bug until proven otherwise.
- Confidence should measure the gap between the top two candidates, not how high the top score is.
- Saying "unavailable" builds more trust than showing a plausible-looking number.
What's next for CyberPulse AI
- Validation with outcome data from real partners, because labels only exist where withdrawals are traced back to complaints
- A bias review, which is not testable on synthetic data
- An always-on ML instance to remove free-tier cold starts
Prototype. It uses synthetic, anonymised demonstration data and is not connected to NCRP, CFCFRMS, NPCI or any bank.
Built With
- docker
- drizzle-orm
- fastapi
- h3
- maplibre
- neon
- next.js
- playwright
- postgresql
- pydantic
- python
- react
- react-flow
- recharts
- render
- scikit-learn
- shap
- tailwindcss
- tanstack-query
- typescript
- vercel
- vitest
- xgboost
- zod

Log in or sign up for Devpost to join the conversation.