-
-
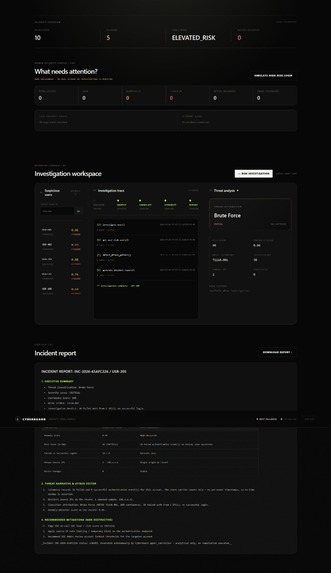
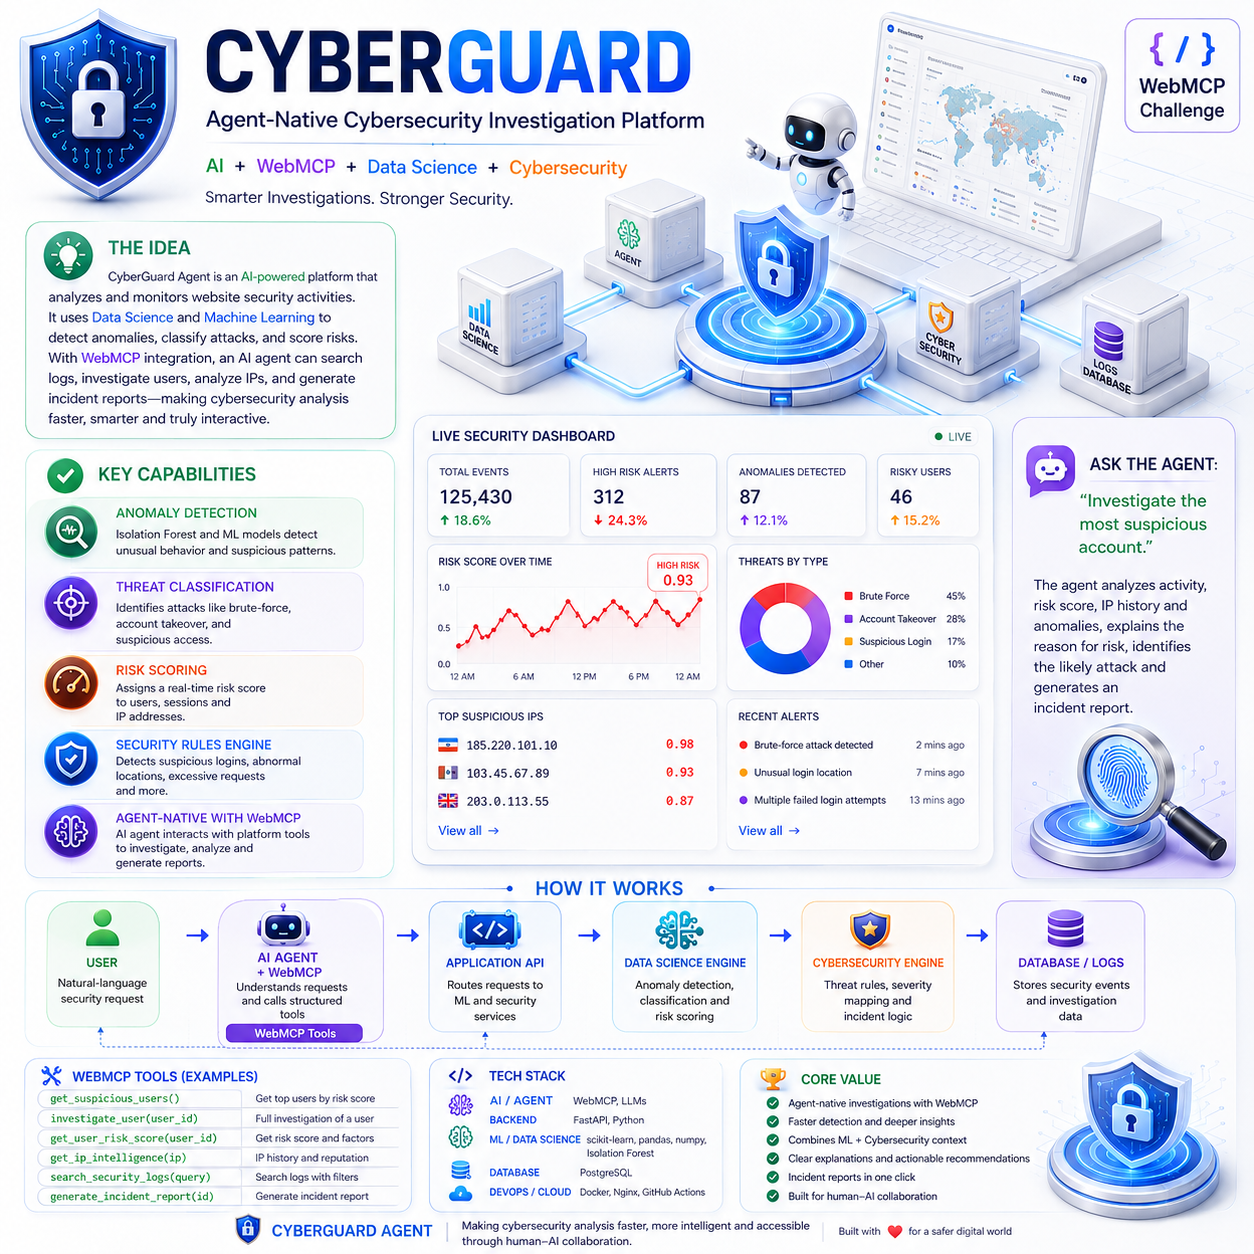
WebMCP tools let the AI agent search logs, investigate users, analyze IPs, score risk, and generate incident reports.
-

AI-driven security investigation turns raw events into evidence-backed findings, threat classification, risk scores, and recommendations.
-
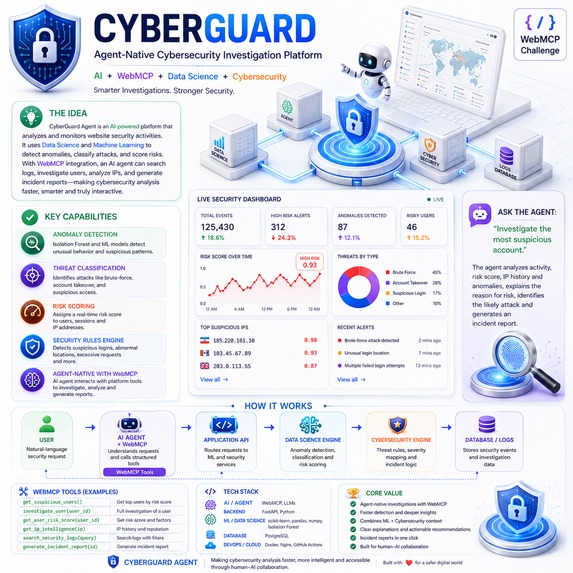
CyberGuard: Agent-native cybersecurity powered by AI, WebMCP, ML, and real-time threat intelligence.
-
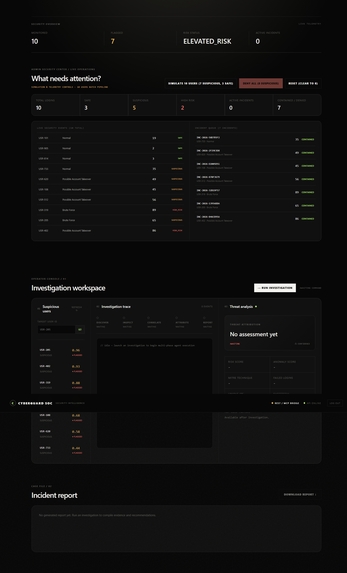
AI-driven security investigation turns raw events into evidence-backed findings, threat classification, risk scores, and recommendations.
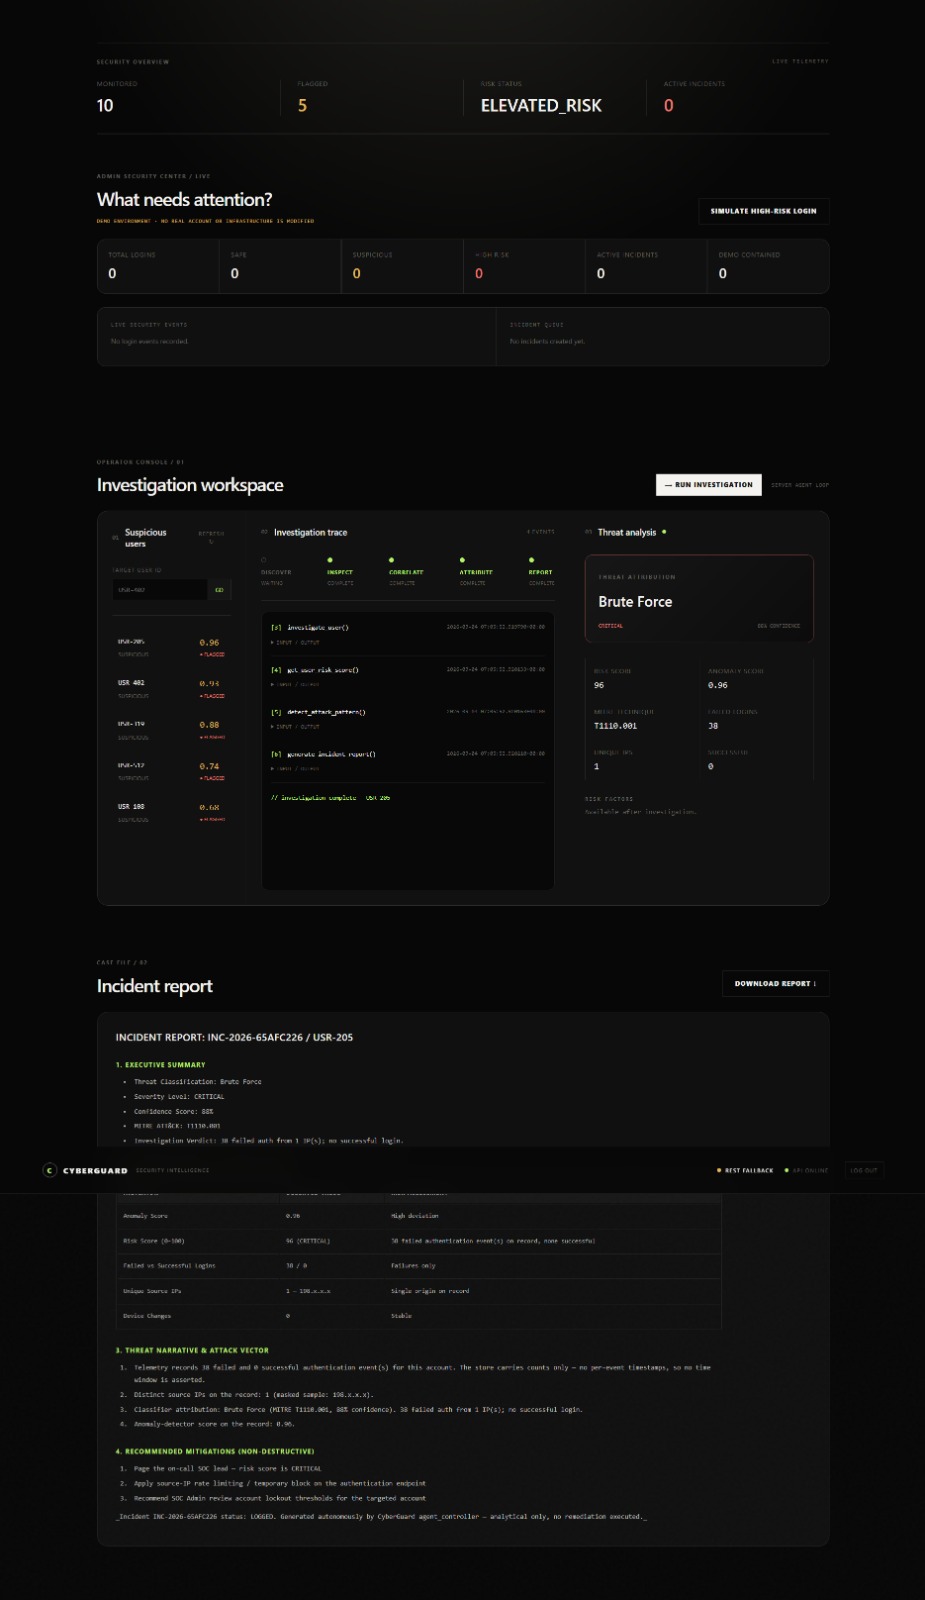

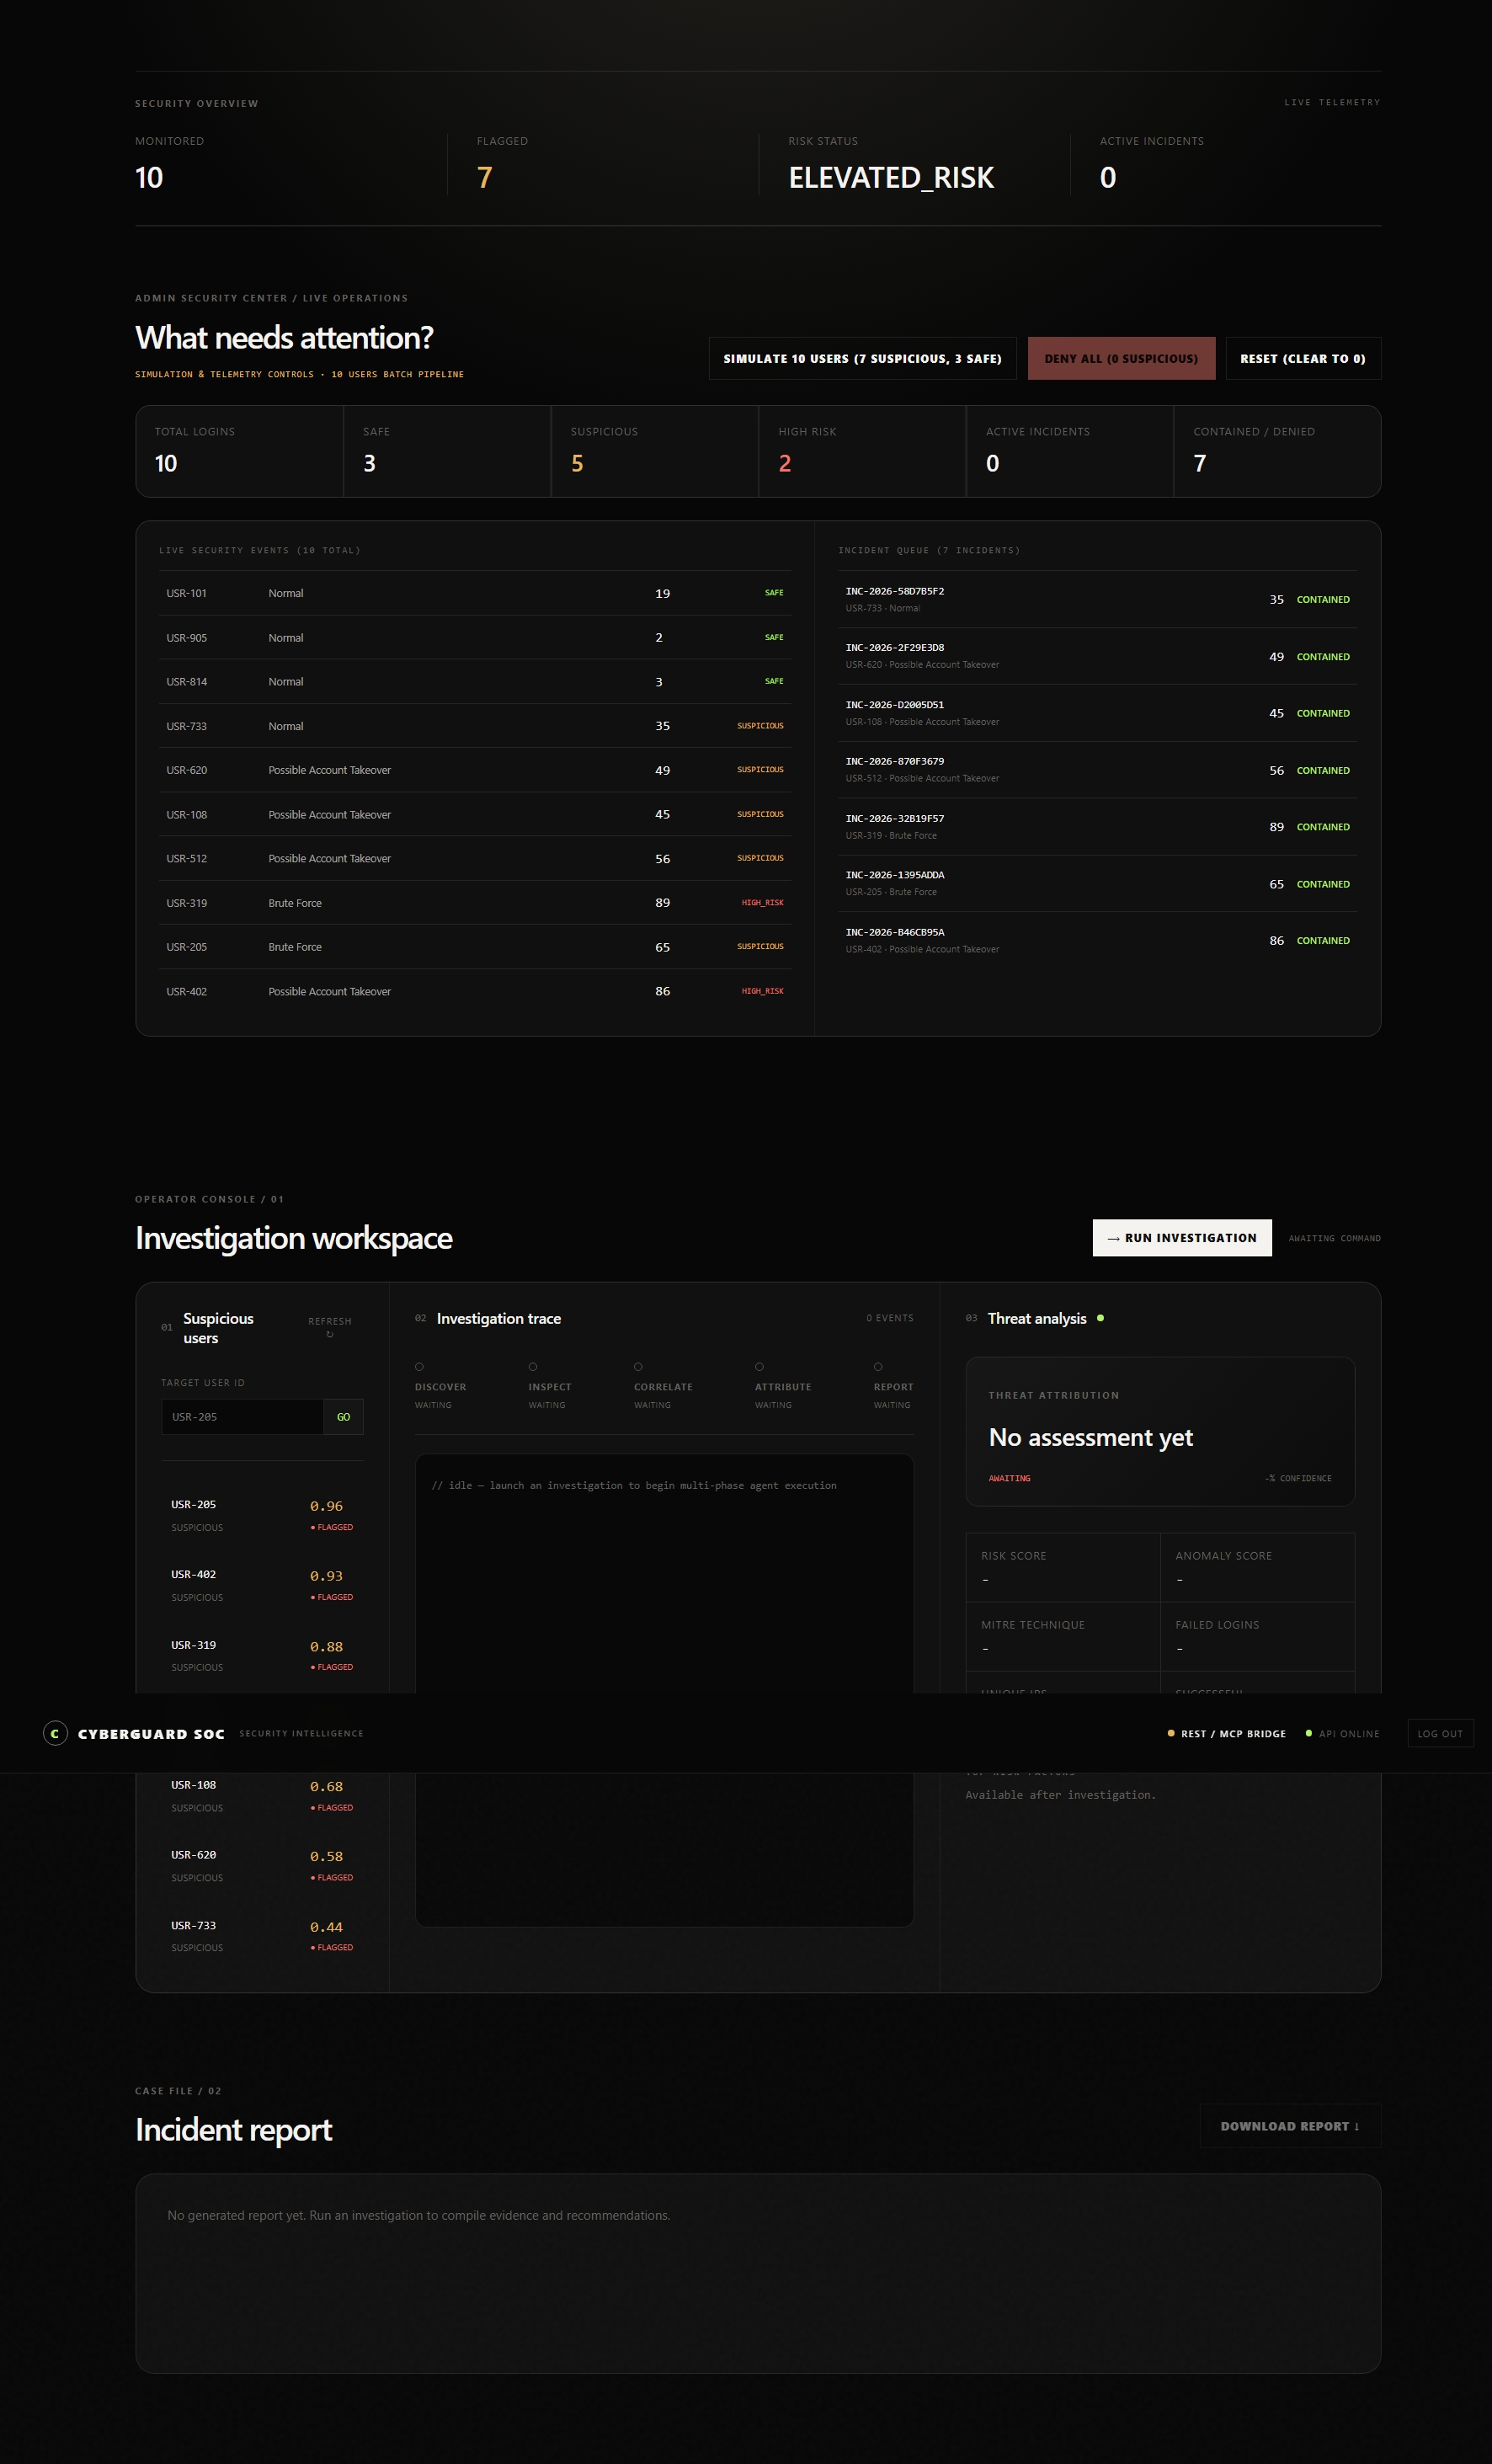
CyberGuard: an agent-native SOC console
CyberGuard hands a security console's telemetry and its ML models to an AI agent as real, callable tools through WebMCP. Point an agent at the dashboard and it works a login-abuse case start to finish: find the worst account, pull its history, score it, name the technique in MITRE ATT&CK terms, and write the incident report.
Built for the WebMCP Hackathon. FastAPI, scikit-learn 1.6.1, a FastMCP stdio server, and a plain-JS dashboard with no build step.
Why we bothered
A Tier-2 analyst starts a shift with tens of thousands of auth events spread over three or four consoles. Reading any single log is easy. The slow part is the pivoting: rank the accounts, open the ugliest one, line its telemetry up against a model score, work out whether the one success buried in forty failures is the breach, then map it and write it up. Same moves every time.
The other half of the problem is how an agent even touches a web app. Scripting clicks is
fragile and scraping the DOM is worse. WebMCP lets the page say what it can do as typed
tools, so the agent calls investigate_user with a user_id instead of hunting for a
button.
| Old dashboard | CyberGuard | |
|---|---|---|
| Getting data to an agent | it scrapes the DOM or you script clicks | it calls a named tool with a JSON schema |
| What's exposed | whatever the UI renders | six tools on navigator.modelContext, mirrored on REST and stdio |
| Time to a verdict | manual pivoting across consoles | one POST, five tool calls |
| When it breaks | half-loaded panels, console errors | a JSON error object with a correlation id |
| What the agent may do | anything a logged-in analyst can, kill switches included | look, score, attribute, recommend. nothing that changes state |
How it fits together
[ Browser client / agent ]
        |
        v   navigator.modelContext, or REST if that is missing
[ WebMCP bridge   frontend/webmcp_bridge.js ]
   isWebMCPSupported() ? native registerTool(6) : CyberGuardFallbackClient
   15s abort timeout, retry with backoff on reads only
        |
        v   JSON-RPC 2.0 or plain HTTP, X-API-Key
[ FastAPI gateway + PII redaction   cyberguard_api/ ]
   api key, slowapi rate limit, CSP / HSTS / nosniff, 1 MB body cap, /readyz
        |
   +----+----------------------------+
   v                                 v
[ agent_controller.py ]         [ ML core   model_loader.load_verified() ]
 five-step loop                  isolation forest + two random forests
 masked trace, md report         32 -> 1037 ft / 13 ft / 65 ft, 15 classes
   |                                 |
   +----------------+----------------+
                    v
        [ telemetry store   services/telemetry.py ]
         one source of truth, project_user() masks every record
         mock store of 10 profiles, or an HTTPS backend in prod
Native WebMCP is the headline, but a normal browser tab has no navigator.modelContext yet,
so the fallback client is what actually runs most of the time. Same tool schemas, same JSON,
just over REST. The stdio MCP server (cyberguard_mcp_server.py, wired up in .mcp.json) is
a third door into the same helper functions.
The six tools
| Tool | Takes | Gives back |
|---|---|---|
get_security_summary |
nothing | monitored / flagged / high-severity counts and a status band |
get_suspicious_users |
limit, 1 to 100, default 5 |
masked accounts ranked by anomaly score |
investigate_user |
user_id |
that account's auth telemetry, email and IPs masked, 404 if unknown |
get_user_risk_score |
user_id |
a 0-100 score, a band, and factors that each trace to a real field |
detect_attack_pattern |
user_id, plus an optional login_event or network_flow vector |
pattern, confidence, MITRE id, and which inference path ran |
generate_incident_report |
user_id, threat_type, severity, recommendations |
an INC-2026-XXXXXXXX record. it writes the record and does nothing else |
Every execute checks its args against the tool's JSON Schema before it touches the network,
then wraps the result in the MCP content[] + structuredContent shape.
The investigation loop
DISCOVER --> INSPECT --> CORRELATE --> ATTRIBUTE --> REPORT
| Step | Tools | What changes |
|---|---|---|
| DISCOVER | get_security_summary, get_suspicious_users(limit=3) |
grab posture and the top candidates, pick the highest anomaly score. skipped if you named a user |
| INSPECT | investigate_user |
the raw record goes through project_user() and comes out masked |
| CORRELATE | get_user_risk_score |
the anomaly score becomes a 0-100 index plus grounded factors |
| ATTRIBUTE | detect_attack_pattern |
counters run through classify_pattern(). out comes a pattern, a MITRE id, a confidence, and an evidence{} block, and the step logs which function ran |
| REPORT | generate_incident_report |
severity gets set (a real attack never drops below HIGH), recommendations get built, and an incident id plus a markdown report come out with the full audit_trace |
If POST /api/v1/agent/investigate cannot be reached, the bridge runs the same five calls
itself and returns the same shape, with _source set to client_fallback instead of
server_agent.
The models
Isolation Forest, for finding anomalies. Input is a 13-feature behavioural vector: login counts and failure rate, distinct IPs, countries, devices and ASNs, hour-gap stats, device changes, account age, logins per day. The forest isolates a point with random splits, and an anomaly falls out in fewer splits, so a shorter path means a higher score:
$$s(x, n) = 2^{-\frac{E(h(x))}{c(n)}}$$
$h(x)$ is the path length to isolate $x$ in one tree, and $E(h(x))$ is that averaged over the forest. $c(n)$ normalises it, the average path length of a failed search in a binary search tree of $n$ nodes:
$$c(n) = 2H(n-1) - \frac{2(n-1)}{n}, \qquad H(i) \approx \ln(i) + 0.5772$$
At serve time the score is $-\,\text{decision_function}(x)$ rounded to 4 dp, and a scikit-learn label of $-1$ means outlier. That maps onto the operator index:
$$\text{risk} = \text{round}(100 \cdot s), \qquad \text{band}(s) = \begin{cases} \text{CRITICAL} & 100 s \ge 80 \[2pt] \text{HIGH} & 60 \le 100 s < 80 \[2pt] \text{MEDIUM} & 100 s < 60 \end{cases}$$
Anything at $s \ge 0.80$ is CRITICAL and goes straight to deep inspection. The pool is flagged at $0.60$ and counted high-severity at $0.85$.
Random forests, for naming the threat. The login model takes 32 engineered features, a fitted pipeline blows them up to 1037 encoded columns, and 300 trees vote:
$$P(\text{attack} \mid x) = \frac{1}{T} \sum_{t=1}^{T} p_t(x), \qquad T = 300, \qquad \text{alert if } P \ge \tau$$
$\tau$ sits at $0.70$. It started at $0.55$ and we moved it up, because precision down there
was about $0.30$. Held-out ROC-AUC is around $0.88$, and the response always carries the raw
probability and $\tau$ so a caller can pick its own line. The network model is separate: 65
flow features, 15 CICIDS2017 classes, and a second "is this a bot" forest that overrides a
Bot call when its own probability is under $0.90$.
The agent path never runs the login forest, since all it has is a user_id and no feature
vector. It uses classify_pattern() instead, and the confidence there is a closed form. For
$f$ failed logins and $k$ distinct IPs:
- brute force: $\min(0.97,\ 0.50 + f/100)$
- credential stuffing: $\min(0.95,\ 0.40 + 0.10\,k)$
- account takeover, or anything still suspicious: $s$ itself
- normal: $1 - s$
The security side
MITRE ATT&CK, deterministically. classify_pattern() reads a telemetry signature and
returns a technique. No model in the loop, the same input always gives the same id, and every
id is a real one you can look up.
| Classification | Signature | Technique |
|---|---|---|
| Account Takeover | a success, geo_velocity_violation set, and failed ≥ 10 or device_changes ≥ 3 |
T1078.004, Valid Accounts: Cloud Accounts |
| Brute Force | failed ≥ 20, no successes, ≤ 2 source IPs | T1110.001, Password Guessing |
| Credential Stuffing | ≥ 3 distinct source IPs, failed ≥ 10 | T1110.004, Credential Stuffing |
| Suspicious Authentication | anomaly is up, nothing matches cleanly | T1078, Valid Accounts |
| Normal | failed ≤ 3, anomaly under 0.40 | none |
Network detections have their own map: T1046 for a port scan, T1498 and T1499 for the
DoS families, T1071 for bot C2, T1190 for Heartbleed and SQLi, T1059.007 for XSS.
The audit trail. Every tool call lands in audit_trace as { step, tool, input, output,
ts }. The attribution step also records the exact function it ran and the inference mode.
Each verdict carries an evidence{} block with the counts it used. The correlation_id on
the report matches the X-Request-ID on the HTTP response, so a finding walks straight back
to its log line.
No made-up indicators. This one took discipline. contributing_factors() only writes a
line when the field behind it is set, so there is no impossible-travel note unless
geo_velocity_violation is true, and no "multiple source IPs" line when the record has one
IP. The narrative says out loud that the store holds counts and no per-event timestamps, so
it never claims a time window. No ASN hops it did not see.
What it will not do.
[ telemetry ] --> [ project_user() mask ] --> [ ML inference ] --> [ classify_pattern() ] --> [ report ]
                                                                                                 |
                                                                                                 v
                                                                             [ blocked: anything that mutates state ]
                                                                      no process kill, no token revoke, no firewall edit
- Read, score, attribute, recommend. That is the whole verb list. The agent loop has no path to a destructive action.
generate_incident_reportwrites an id and a list of recommendations. It does not act on them, and the footer says so.- Masking is the same on every transport, REST, stdio and WebMCP alike.
alex.chen@enterprise.internalbecomesa***n@enterprise.internal,198.51.100.23becomes198.x.x.x, IPv6 collapses to2001:x. Nothing raw leaves the process. - Startup is fail-closed on auth, CORS, the telemetry backend, the model manifest, and the
serialization environment.
/readyzstays 503 until every model has loaded and checked out.
What bit us, and what we would say now
- Pickle versions. First load of the RF on a teammate's laptop died with
_RemainderColsList. Different scikit-learn minor.joblib.load()also runs arbitrary code on the way in, so now every artifact has a SHA-256 inmanifest.jsonthat is checked before it loads, the manifest records the build env (Python 3.12, sklearn 1.6.1, numpy 2.1.2, scipy 1.14.1, joblib 1.4.2), and a minor mismatch is a hard stop in prod. The digest list can sit off the writable volume with an Ed25519 signature over it, and CI runs the check on every push. - The fallback was not optional. We assumed judges would run this in something with
navigator.modelContext. They will not, mostly. SoisWebMCPSupported()decides at load time, the REST client carries the identical schemas, andrunInvestigation()quietly drops from the server loop to a client-side chain that returns the same object. The schema is the contract, the transport is a detail. - Grounding is a design constraint, not a prompt. Keeping the agent from inventing
evidence is not something you ask for nicely. It comes from field-gated factors, a
timestamp-free narrative, the
evidence{}echo, the inference mode in the trace, and classifiers that are pure functions. If it is in the report, it is in the trace. - Passive dashboards are the wrong shape for this. Give an agent the same typed, masked, rate-limited, audited tools a person uses, and it stays on the rails by construction.
Built With
- agents
- ai
- analytics
- anomalydetection
- apis
- cybersecurity
- datascience
- docker
- fastapi
- javascript
- machine-learning
- natural-language-processing
- numpy
- openai
- pandas
- postgresql
- python
- react
- riskanalysis
- scikitlearn
- security
- threatdetection
- typescript
- vercel
- webmcp

Log in or sign up for Devpost to join the conversation.