Inspiration
We are impressed by the work done by SAP to support sustainability and poverty around the globe and want to help support them in their mission.
What it does
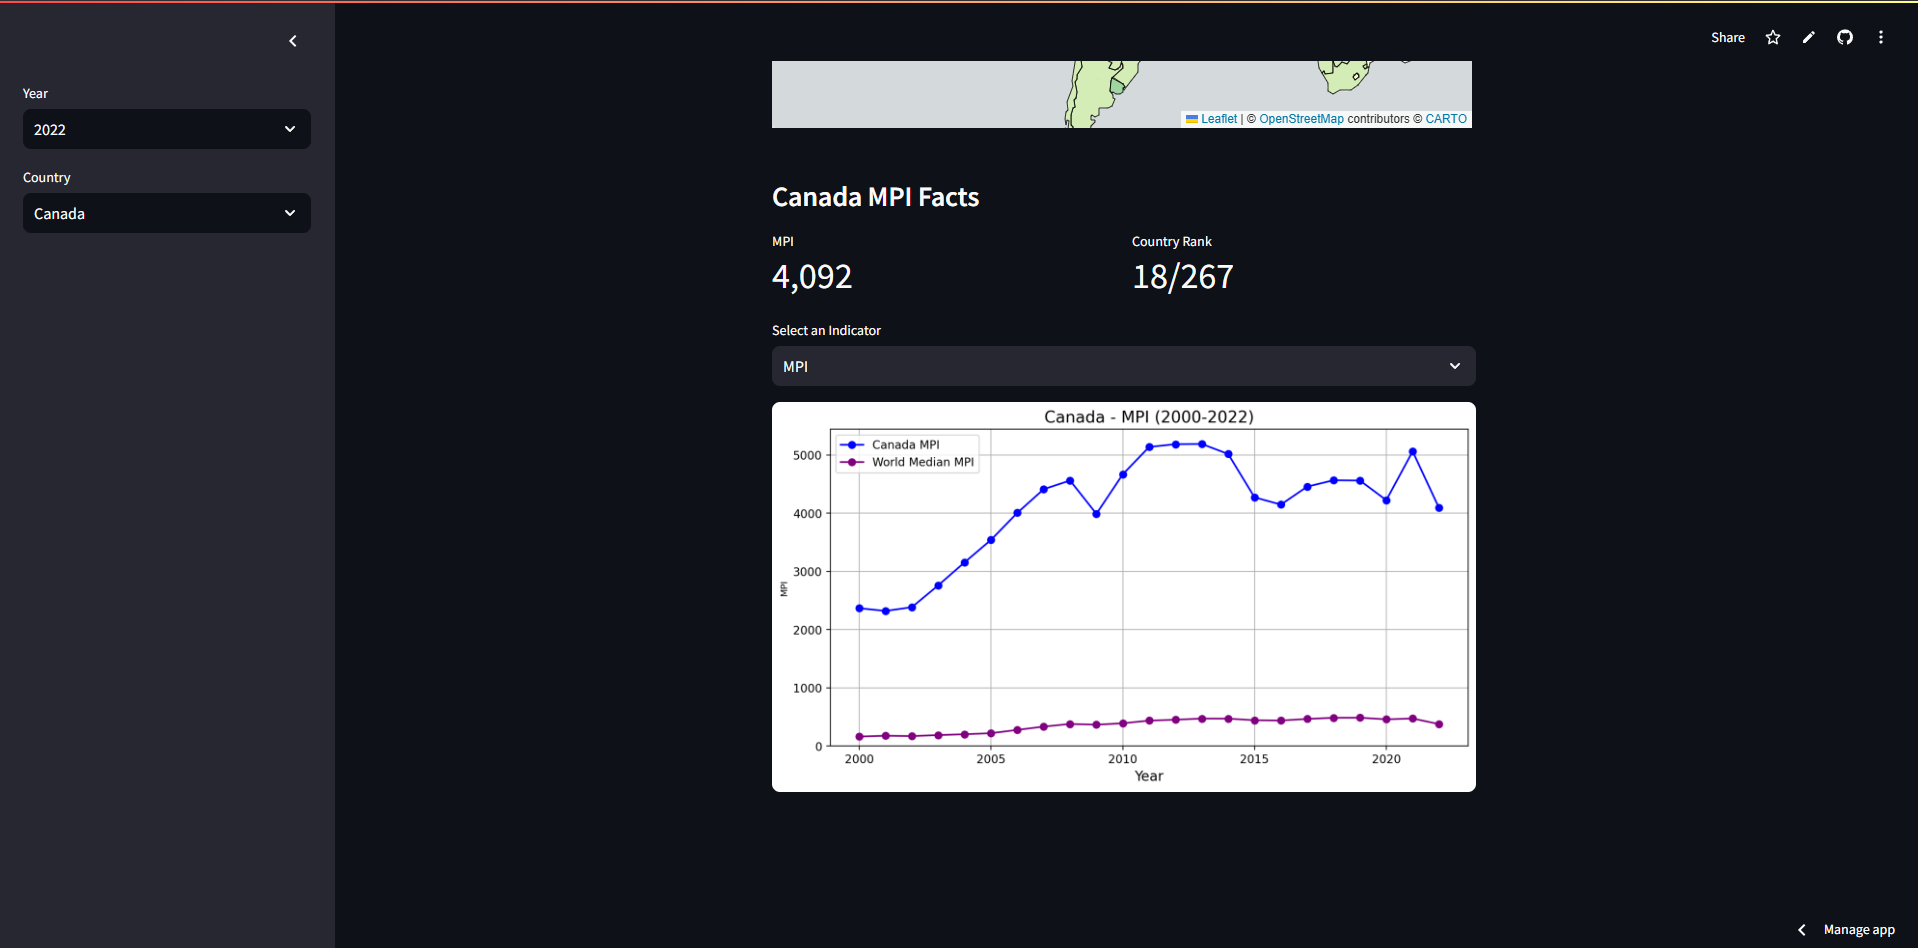
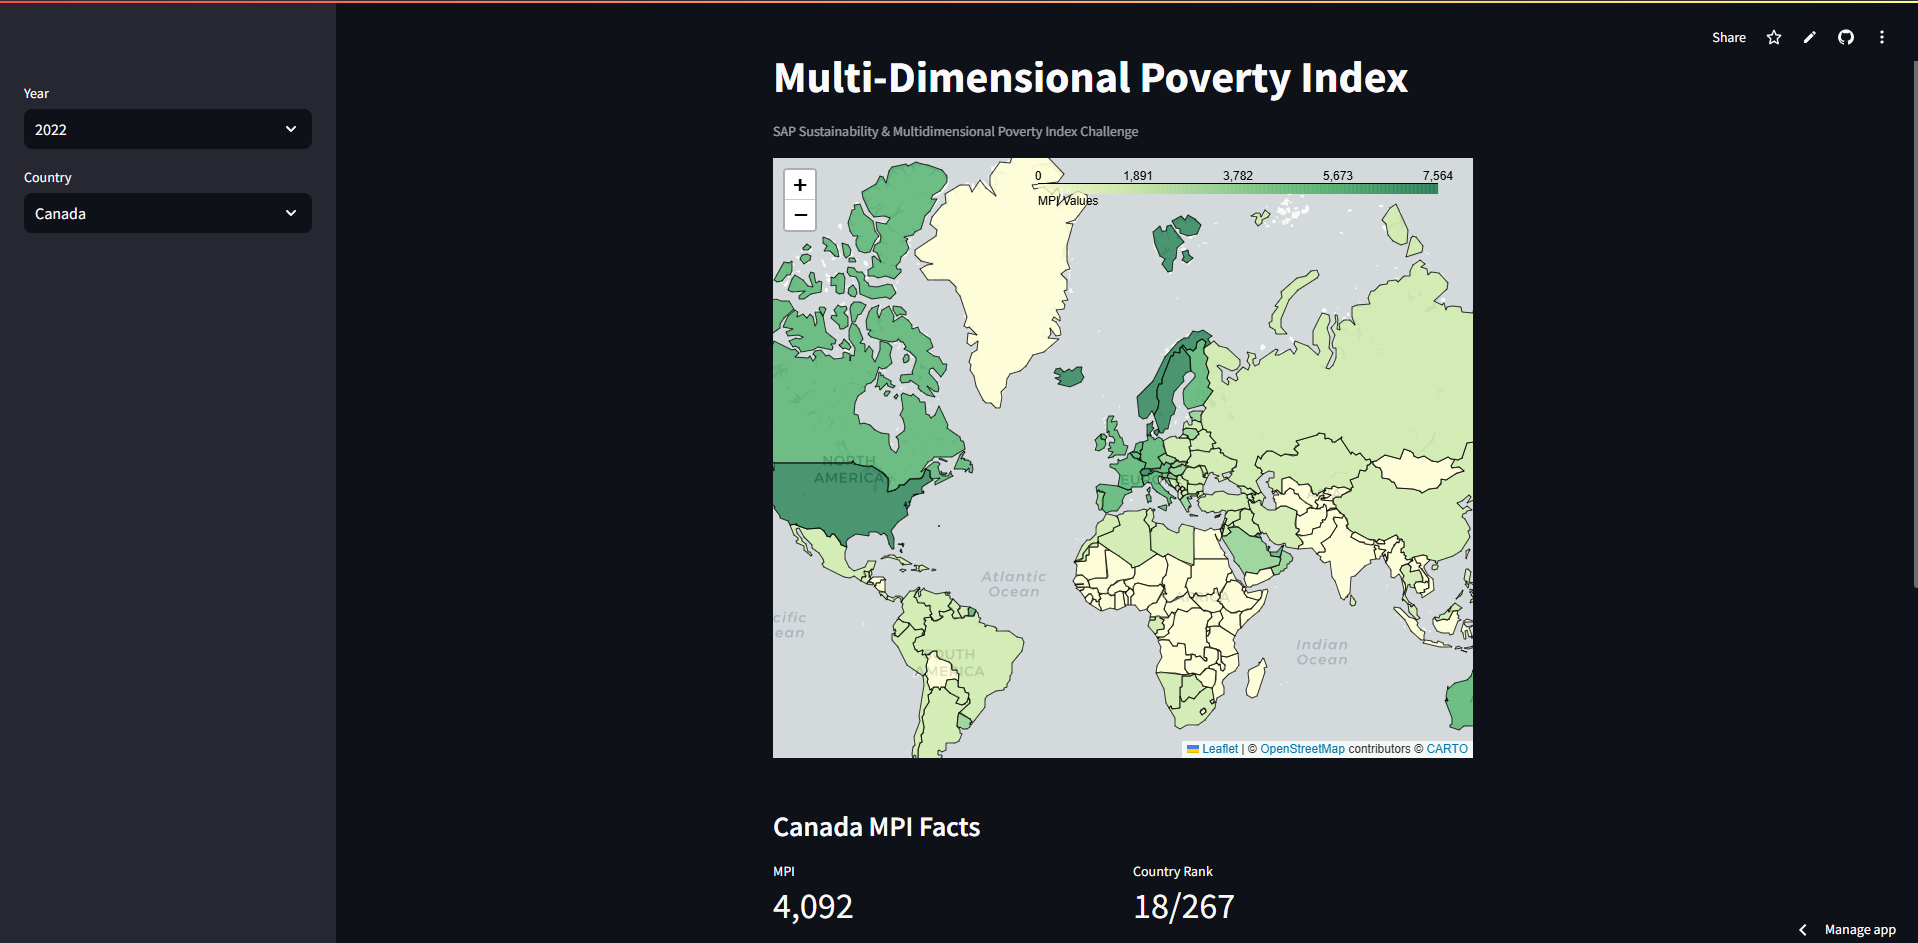
Visualizes and creates a poverty index to compare and contrast countries.
How we built it
Using Python, Streamlit and data analytics/ML libraries such as SciKit, Numpy, Pandas, Matplotlib, and Seaborn, we created a dashboard and notebook to perform analysis.
Challenges we ran into
Working with data can often be challenge, cleaning and preparing the data was a challenging step in the process.
Accomplishments that we're proud of
Analyzing and identifying key indicators linked to poverty and using them to suggest policy changes or actions
Built With
- folium
- matplotlib
- numpy
- pandas
- python
- scikit-learn
- seaborn
- streamlit


Log in or sign up for Devpost to join the conversation.