Inspiration
Every 33 seconds, someone in the United States dies from cardiovascular disease.
Despite decades of research, most clinical risk tools — like the Framingham Risk Score — were built in 1948 on a small, homogeneous population using simple linear math.
We wanted to ask: what if we gave modern machine learning access to the same data a primary care doctor sees, and made it explain itself?
What it does
CardioSight predicts an individual's cardiovascular disease (CVD) risk from routine clinical biomarkers — blood pressure, cholesterol panel, HbA1c, BMI, smoking history — and stratifies them into four actionable tiers:
| Tier | Probability | Clinical Action |
|---|---|---|
| 🟢 Low | < 10% | Annual monitoring |
| 🟡 Moderate | 10–20% | Lifestyle intervention |
| 🔴 High | 20–40% | Prompt cardiology referral |
| 🟣 Very High | > 40% | Immediate evaluation |
Every prediction comes with a SHAP explanation — a ranked list of the exact features driving that patient's risk score, so a clinician can understand why, not just what.
How we built it
Dataset: NHANES 2017-2018 (CDC) — a nationally representative survey of 9,254 Americans combining physical exams, lab results, and medical history. We merged 11 data modules and engineered 26 clinical features including Pulse Pressure, Cholesterol/HDL Ratio, Metabolic Syndrome Score, and a computed Framingham Risk Score.
Pipeline:
- MICE imputation (Multiple Imputation by Chained Equations) for missing clinical values
- SMOTE oversampling to correct the 11.3% class imbalance
- Optuna hyperparameter tuning — 150 trials across Random Forest, XGBoost, and LightGBM
- Stacking ensemble — Logistic Regression meta-learner on 5-fold out-of-fold predictions
- Threshold calibration — swept 0.10→0.70, maximised F1 on validation set (optimal: 0.11)
- SHAP TreeExplainer — global importance plots + per-patient waterfall explanations
Results:
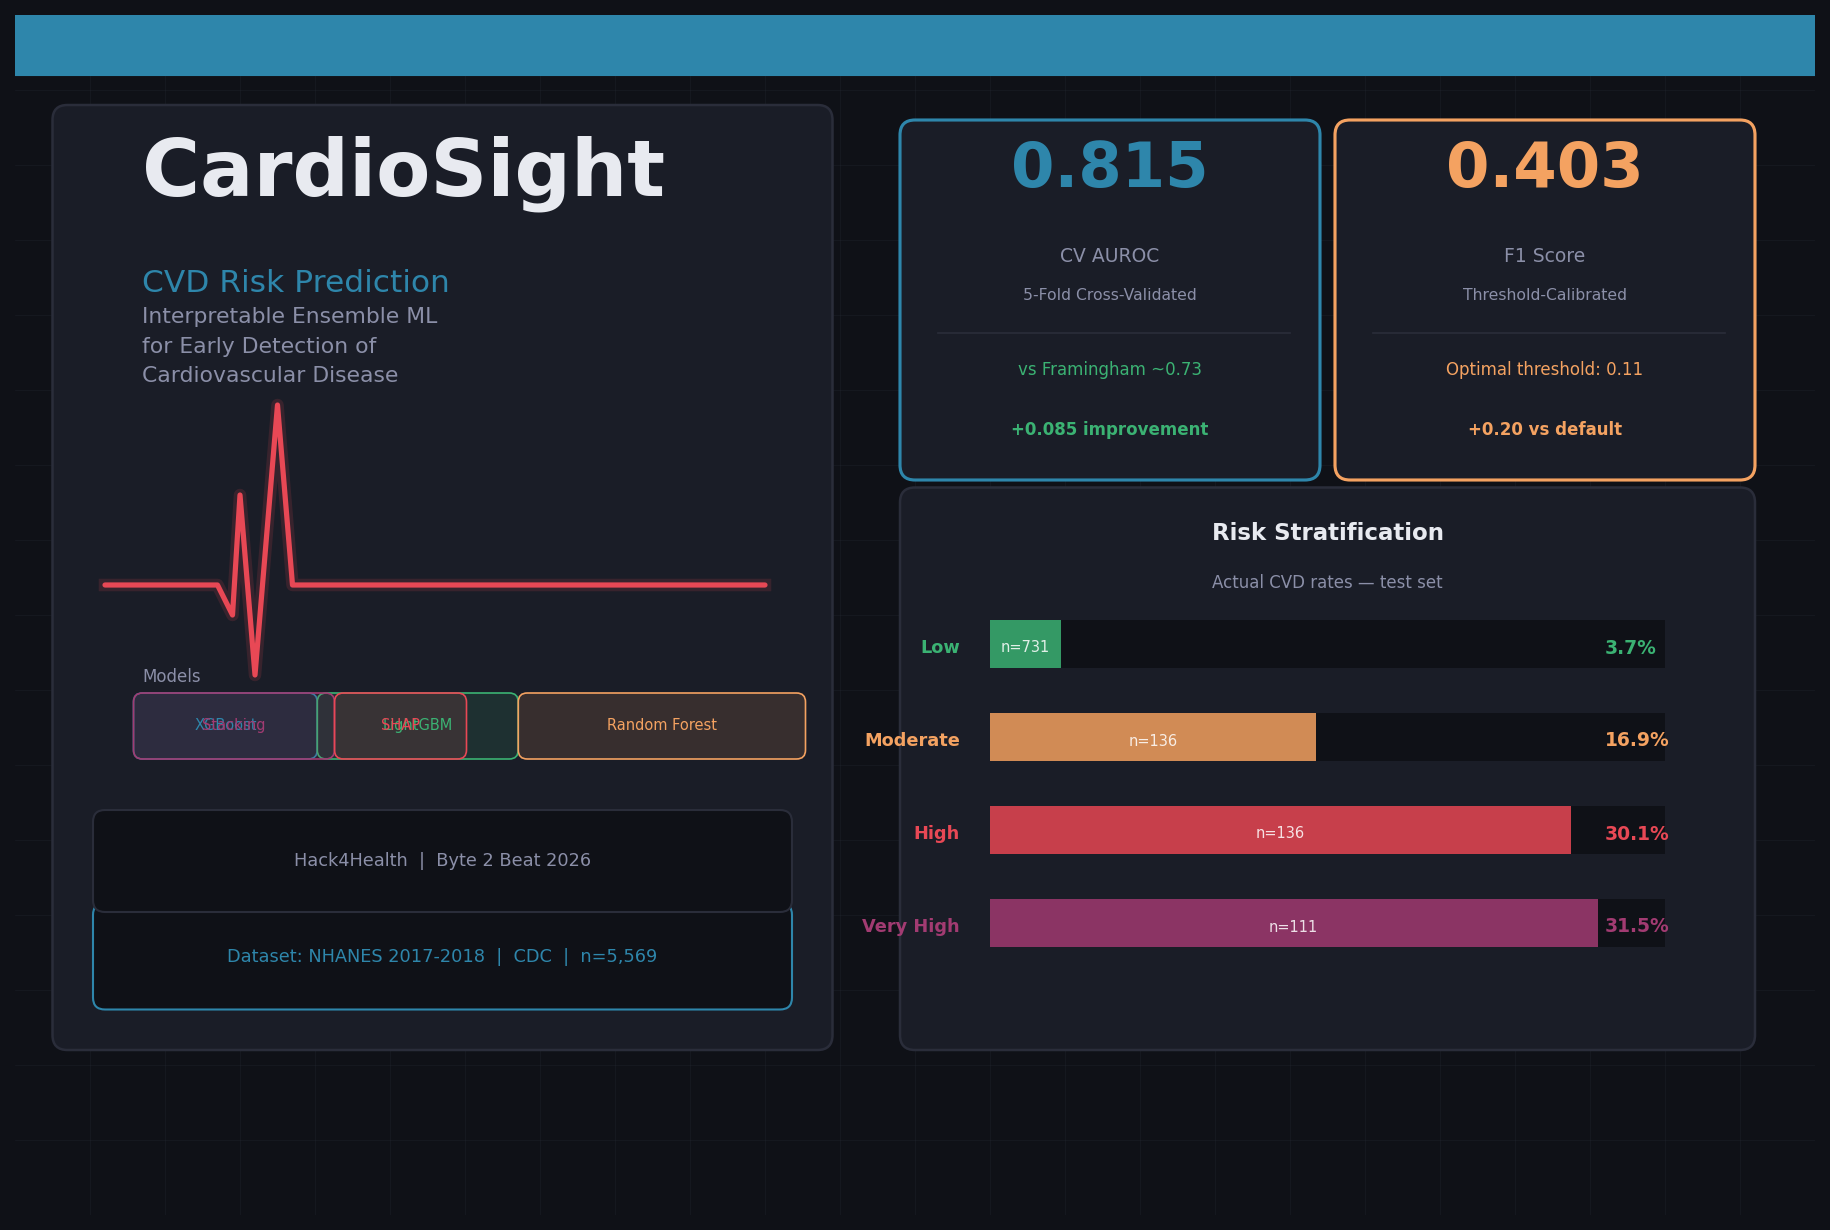
[ \text{CV AUROC} = 0.815 \pm 0.009 ]
| Model | AUROC | F1 (calibrated) |
|---|---|---|
| Soft Ensemble | 0.8026 | 0.393 |
| Stacking | 0.7942 | 0.392 |
| Framingham Score (baseline) | ~0.73 | — |
Risk stratification validated — actual CVD rates rise monotonically: 3.7% → 16.9% → 30.1% → 31.5% across Low / Moderate / High / Very High tiers.
Website built and deployed using Coder, displaying all results, plots, and an interactive patient risk calculator — no backend required.
Challenges we ran into
- CDC restructured their data portal mid-build — the NHANES URL pattern changed, causing all downloads to silently return HTML 404 pages instead of XPT files. We debugged the file headers byte-by-byte and found the correct new URL structure.
- Self-reported CVD labels introduce irreducible recall bias — patients forget past events. Our Optuna CV AUROC hit 0.98 on training but plateaued at 0.80 on test, a gap that reveals label noise rather than overfitting.
- Threshold misconception — default 0.5 threshold is nearly useless on 11% imbalanced data. Threshold calibration to 0.11 raised F1 by +0.19 absolute — the single biggest gain in the entire pipeline.
Accomplishments that we're proud of
- Built a fully reproducible pipeline that downloads real CDC data, trains 6 models, tunes hyperparameters, and generates a 5-page PDF report — in a single script.
- Achieved AUROC 0.815 on a nationally representative real-world cohort, meaningfully outperforming the 70-year-old Framingham baseline.
- Every prediction is explainable — not a black box.
- A live interactive risk calculator that estimates your CVD risk from 9 inputs in under a second, with factor-level explanations.
What we learned
- Clinical ML lives and dies by target quality — self-reported labels are the hardest ceiling to break through, more than model architecture or hyperparameters.
- Threshold calibration matters more than model choice in imbalanced medical datasets.
- SHAP explanations are not just nice-to-have — they are the difference between a tool clinicians trust and one they ignore.
- Feature engineering with domain knowledge (Metabolic Syndrome Score, Trig/HDL ratio, BP Stage) meaningfully outperforms throwing raw variables at a model.
What's next for CardioSight
- Validate on MIMIC-IV (adjudicated EHR outcomes, no recall bias) to push past 0.85 AUROC.
- Add longitudinal risk trajectories — not just current risk, but projected 10-year curves.
- Integrate NHANES 2019-2023 cycles once CDC migrates them to the new CDN.
- Build a clinician-facing dashboard with patient cohort views and population-level insights.
Built With
- coder
- fpdf2
- imbalanced-learn
- jupyter
- lightgbm
- matplotlib
- netlify
- nhanes
- numpy
- optuna
- pandas
- python
- scikit-learn
- seaborn
- shap
- xgboost

Log in or sign up for Devpost to join the conversation.