-
-
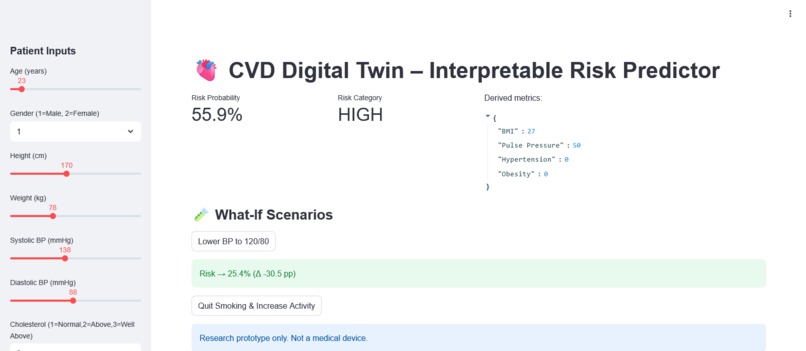
Main screen
-
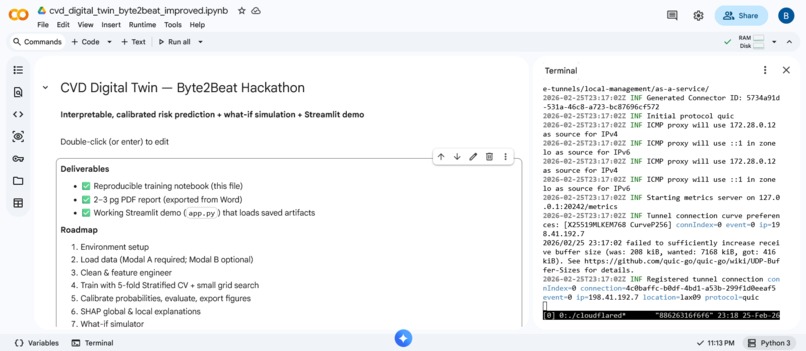
Notebook
🫀 CVD Digital Twin — Interpretable Cardiovascular Risk with “What‑If” Simulation
Inspiration
Most risk calculators give a single opaque number. Clinicians and patients want more:
1) What’s my current risk?
2) Why is it high or low (for me specifically)?
3) What would change my risk if I lower BP, quit smoking, or get more active?
That’s the gap this project addresses with an interpretable, interactive CVD Digital Twin.
What it does
- Predicts CVD risk from routine clinical & lifestyle features.
- Explains every prediction with SHAP (global & per‑patient drivers).
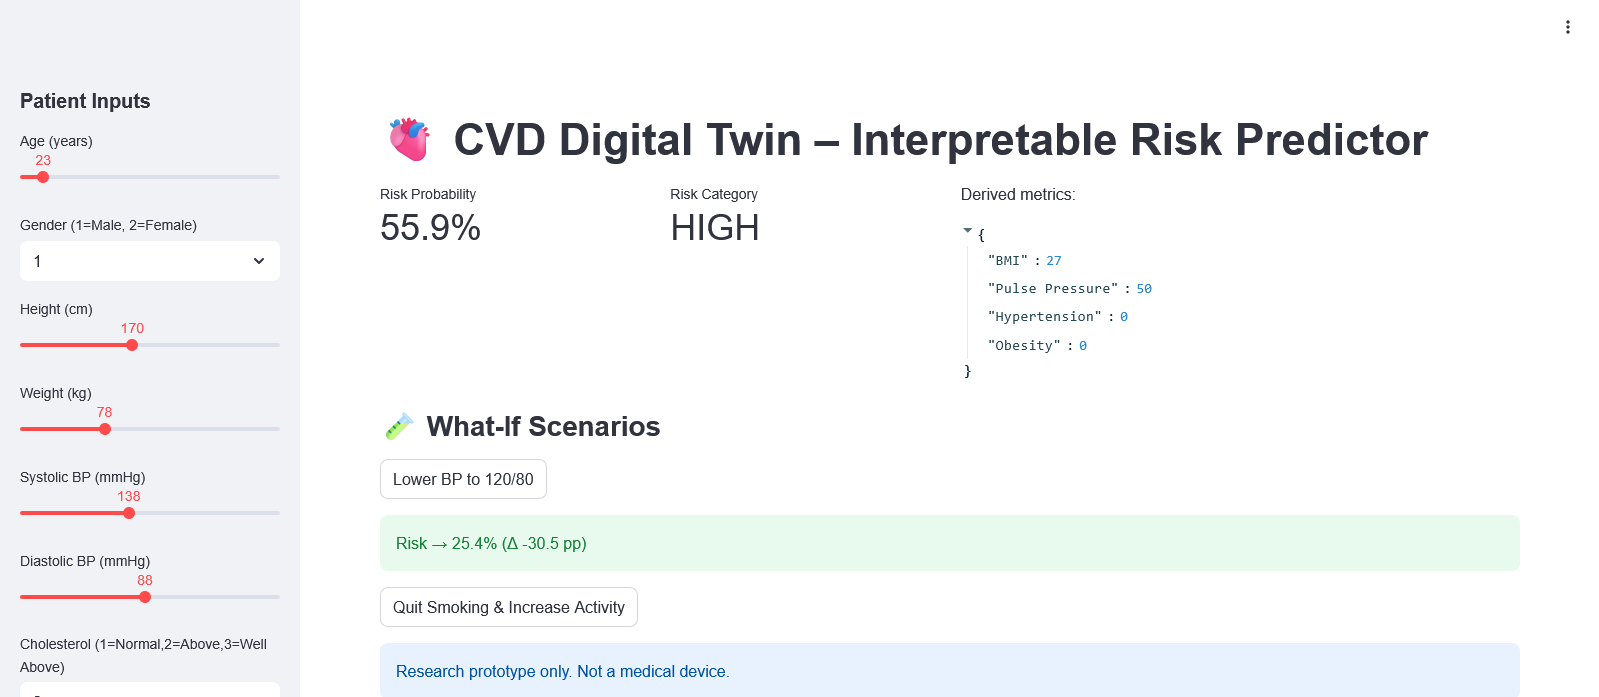
- Simulates “what‑if” scenarios (e.g., lower systolic BP to 120/80, stop smoking, increase activity) and quantifies the risk delta in real time.
- Ships with a Streamlit demo so judges/users can try scenarios live.
Research prototype — not a medical device.
How we built it
Data (Modal A): cardio_train.csv (or cardio_base.csv)
We derive: ( \text{Age (years)}, \text{BMI} = \frac{\text{weight}}{(\text{height}/100)^2} ), pulse pressure, and flags for hypertension (ap_hi ≥ 140 OR ap_lo ≥ 90) and obesity (BMI ≥ 30). Physiological sanity filters remove implausible BP/BMI entries.
Modeling:
- XGBoost classifier with a small GridSearchCV over depth/trees/lr using 5‑fold Stratified CV.
- Probability calibration (isotonic) for trustworthy risk probabilities (calibration curve + Brier score).
- Metrics: ROC‑AUC, PR‑AUC, F1, confusion matrix, Brier; plots exported for the report & gallery.
Explainability & Simulation:
- SHAP beeswarm + bar (global) and waterfall (local) for a chosen patient.
- What‑if function perturbs features (e.g., systolic/diastolic BP, smoking, activity), recomputes calibrated risk, and reports absolute/relative change.
Demo:
app.py(Streamlit) loads the trained, calibrated model + scaler and runs the “what‑if” scenarios interactively.
Challenges
- Probability quality: getting risk calibrated (not just high AUC) so “what‑if” deltas are meaningful.
- Data cleanliness: ensuring physiologically plausible vitals (BP relation, BMI bounds) to avoid corrupting the learner.
- Explaining to non‑experts: choosing SHAP visualizations and copy that are useful to clinicians and accessible to students/newcomers.
Accomplishments we’re proud of
- A calibrated risk model with clear, clinician‑friendly explanations.
- Working demo with one‑click “Lower BP to 120/80” and “Quit Smoking & Increase Activity” scenarios.
- End‑to‑end reproducibility (seeded CV, saved artifacts, single‑run notebook).
What we learned
- Calibration matters: Brier score + calibration curves change the conversation from “model is accurate” to “probabilities you can trust.”
- SHAP can be both global (feature ranking) and local (patient‑level rationale) without being overwhelming if plotted well.
What’s next
- Add optional ECG‑derived features (Modal B) for a multimodal ensemble.
- Add fairness slices by age/sex to study performance parity.
- Deploy on Streamlit Community Cloud for a stable, always‑on demo link.
How we evaluated
- ROC‑AUC & PR‑AUC for discrimination; F1 for balance; Brier score + calibration curve for probability quality.
- SHAP confirms domain‑plausible drivers: systolic BP, age, BMI, cholesterol.
- A patient case study shows risk reduction when systolic BP is lowered toward guideline targets.
How to run (summary)
- Open the notebook, upload
cardio_train.csv, run all cells to train + save artifacts. - Launch the Streamlit app:
streamlit run app.py - Try the built‑in scenarios in the UI (“Lower BP to 120/80”, “Quit Smoking & Increase Activity”).
Built With
- numpy
- pandas
- python
- scikit-learn
- shap
- streamlit
- xgboost
