-
-
Overview
-
Overview
-
Customer History Data
-
Swarm Runs
-
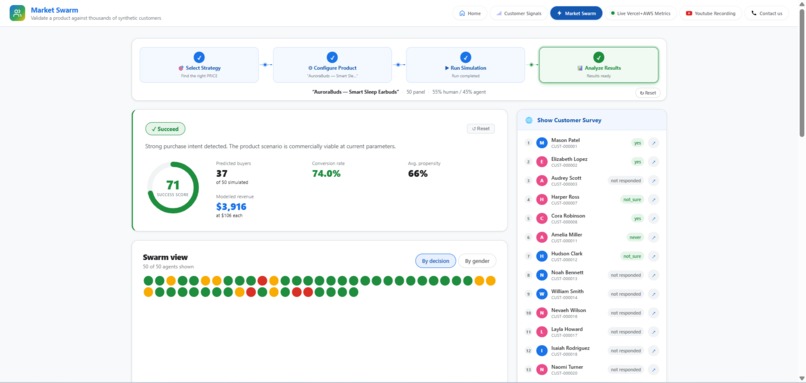
Simulation Run Results
-
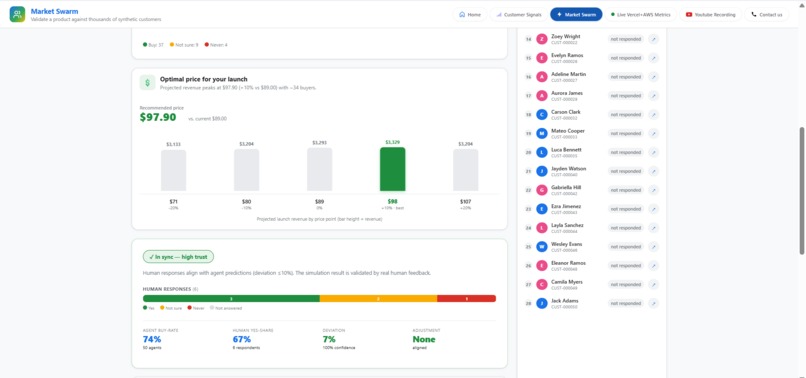
Strategy Results
-
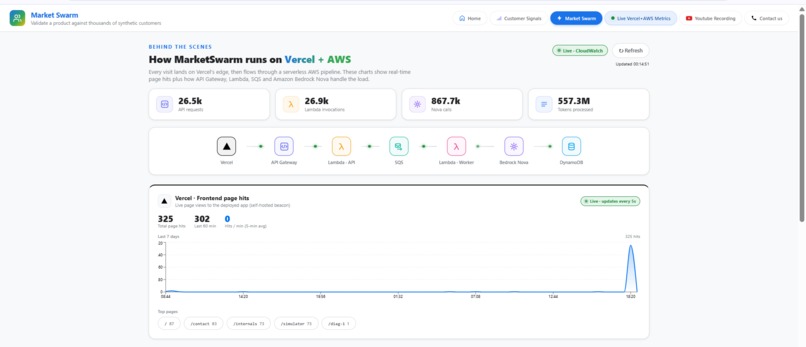
Live Vercel Metrics
-
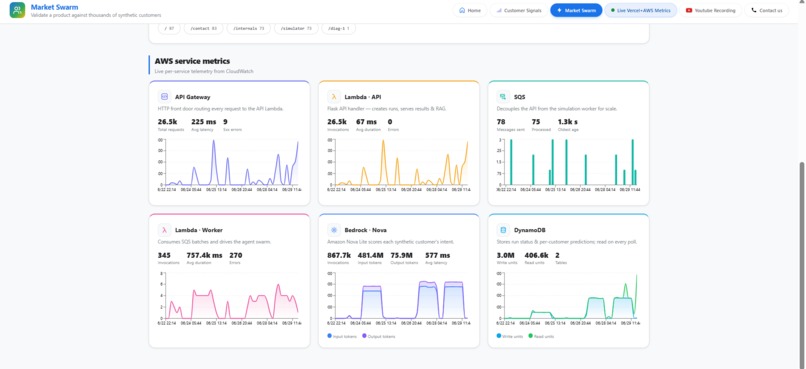
Live AWS Metrics
Inspiration
The idea came from a problem we kept hitting in real life. Whenever someone had a product idea, the conversation always stopped at the same question: "Okay, but will people actually buy this?"
We never had a good way to answer it. The options we knew about all had real downsides:
- Surveys take weeks to run, and most people who receive them never reply, so you end up with a tiny, slow sample.
- Focus groups cost money to organize and only give you a handful of opinions from a few people in one room.
- A/B tests only work after you've already built the product and have enough traffic to split — which is too late if you're still deciding whether to build it at all.
So in practice, most product decisions came down to a gut feeling. We watched good ideas get dropped because no one could check them cheaply, and weak ideas get built because the hunch felt right at the time.
We wanted something in the middle: faster and cheaper than real research, but more trustworthy than guessing. The concept was simple — describe a product, and within a few minutes watch a few thousand simulated customers react to it, with some real human responses mixed in so the numbers stay grounded in reality. That became MarketSwarm.
What it does
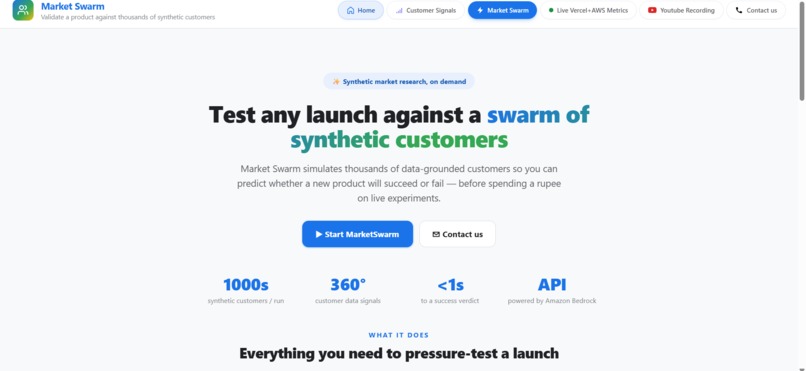
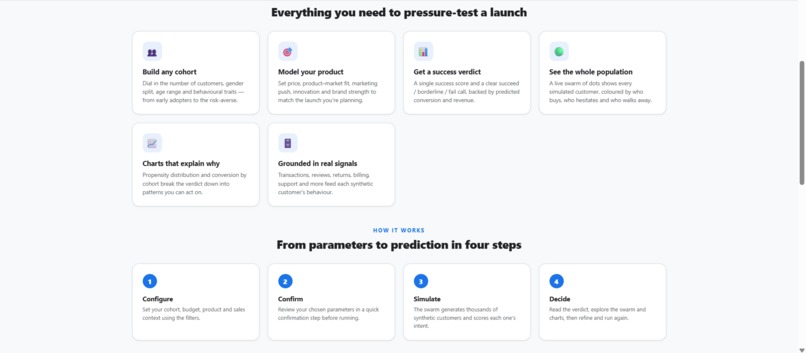
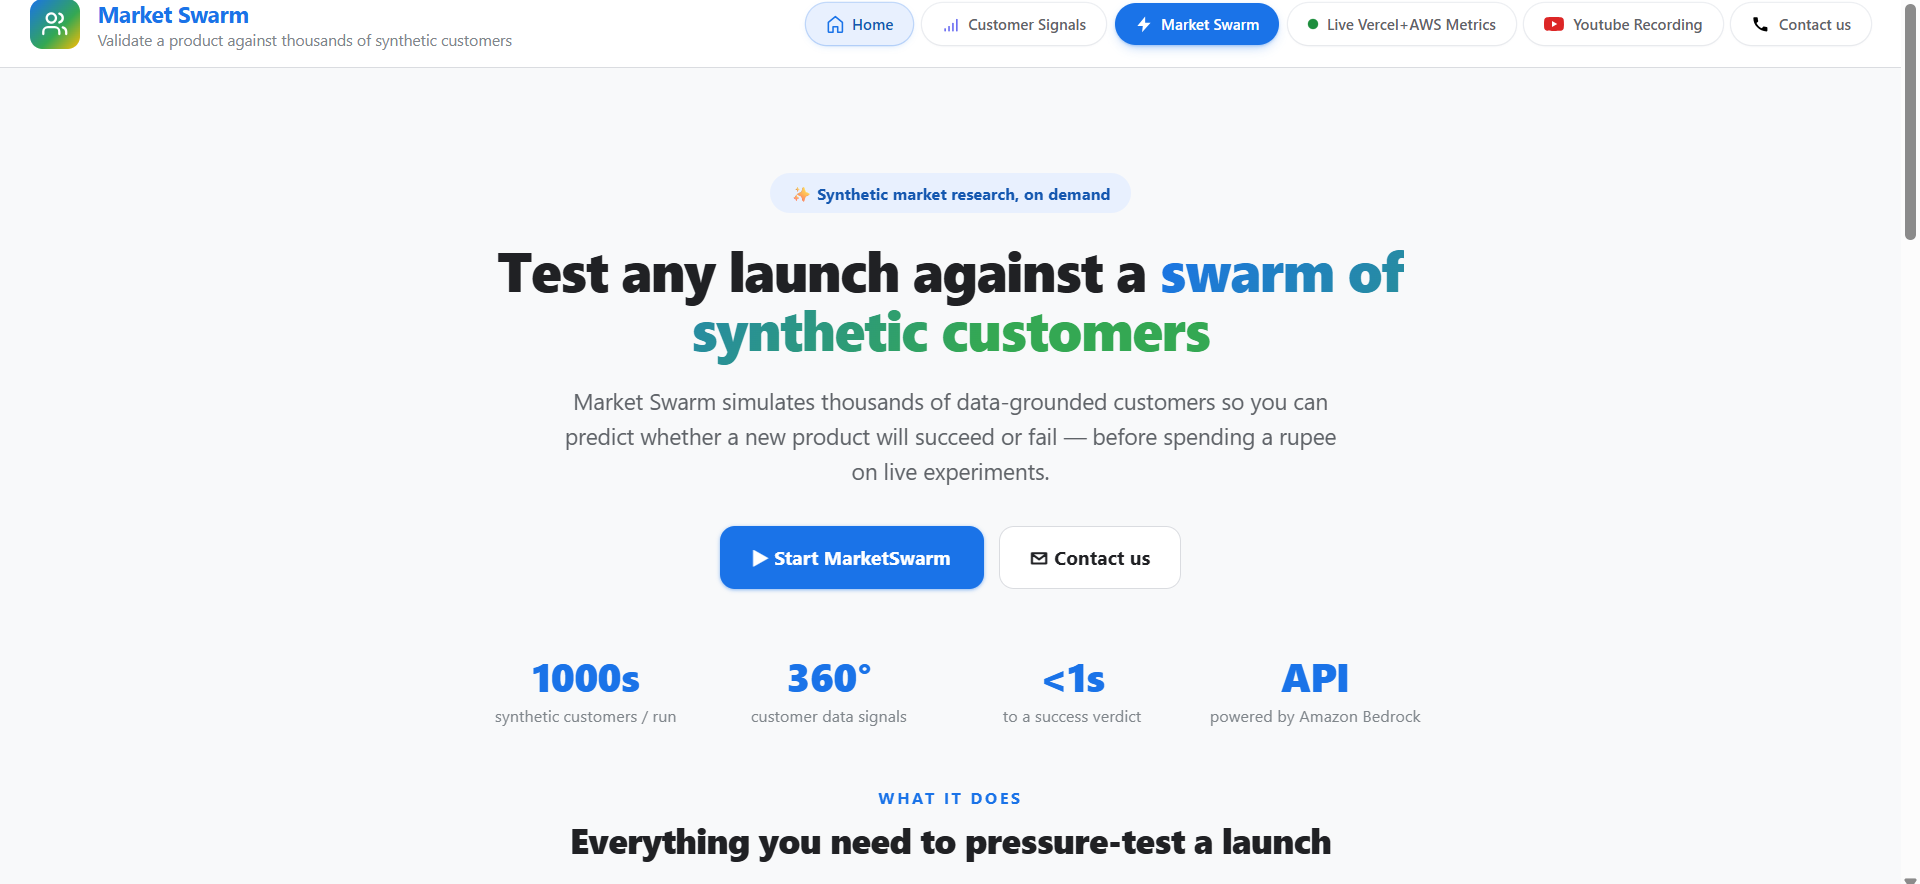
MarketSwarm runs a blended simulation of how customers would respond to your product, and turns it into a clear verdict you can act on.
A real run, start to finish:
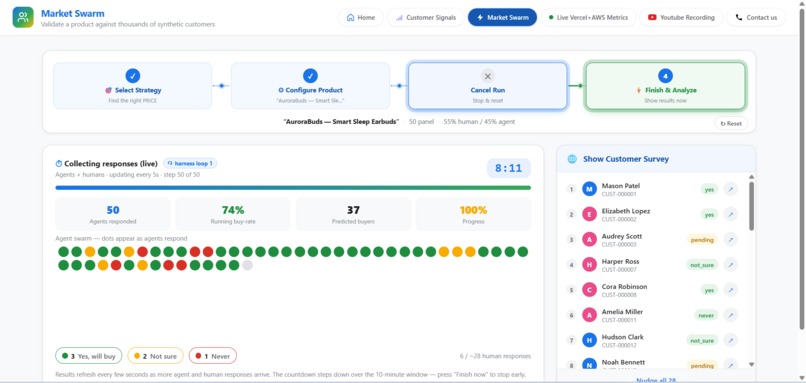
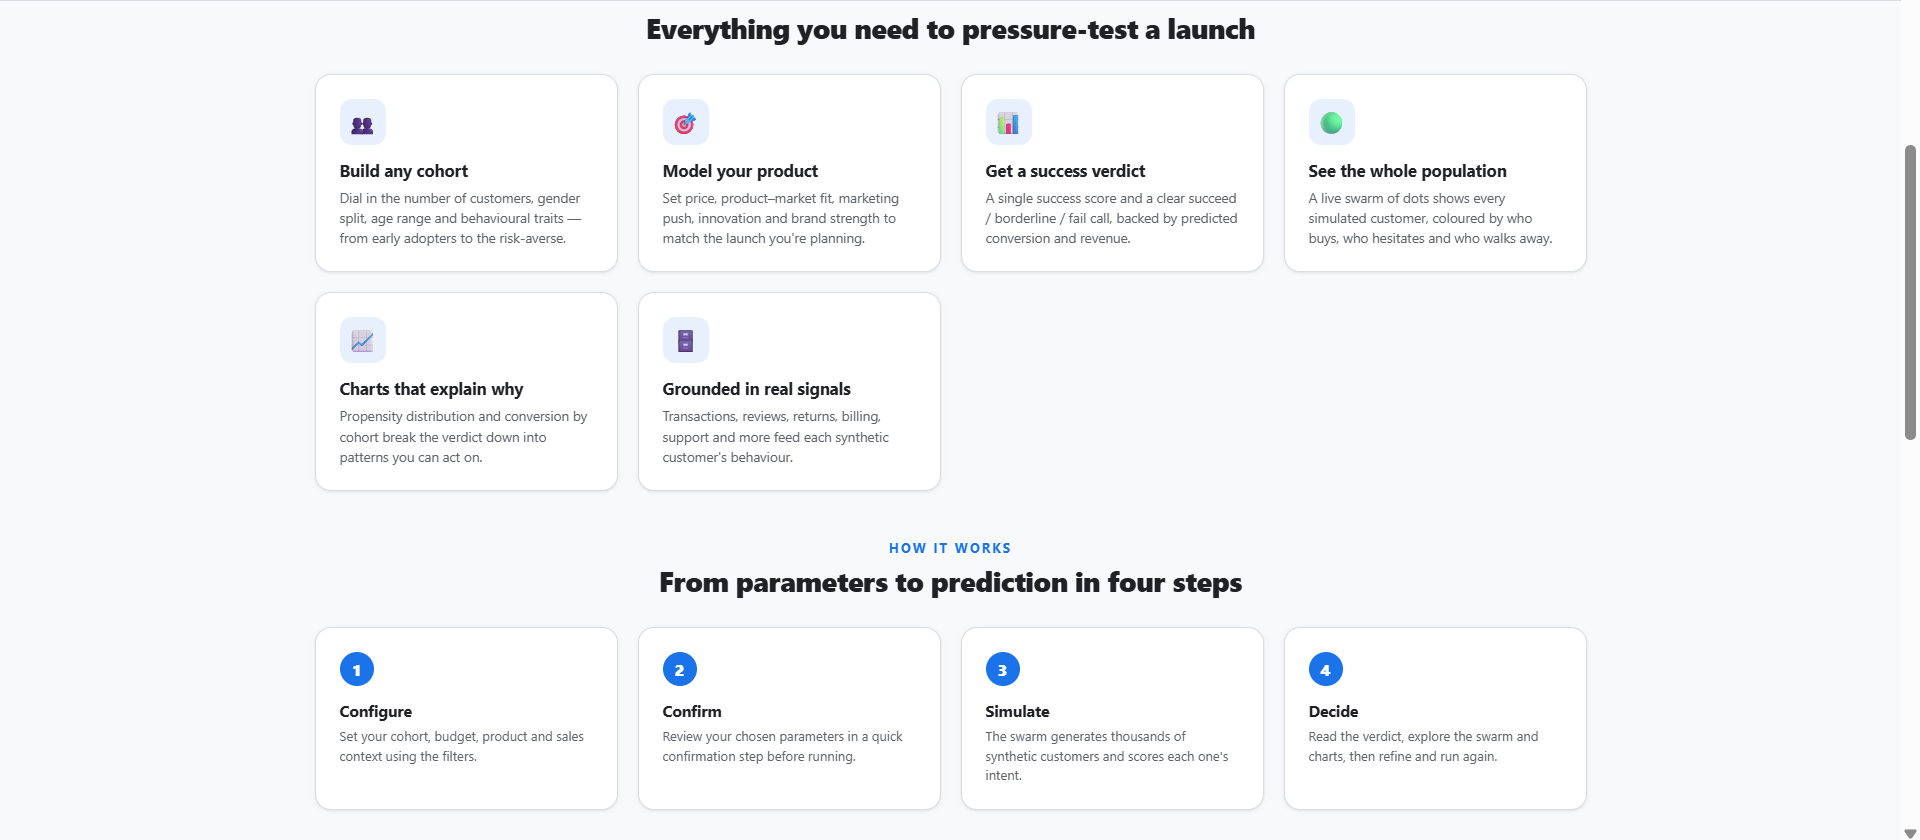
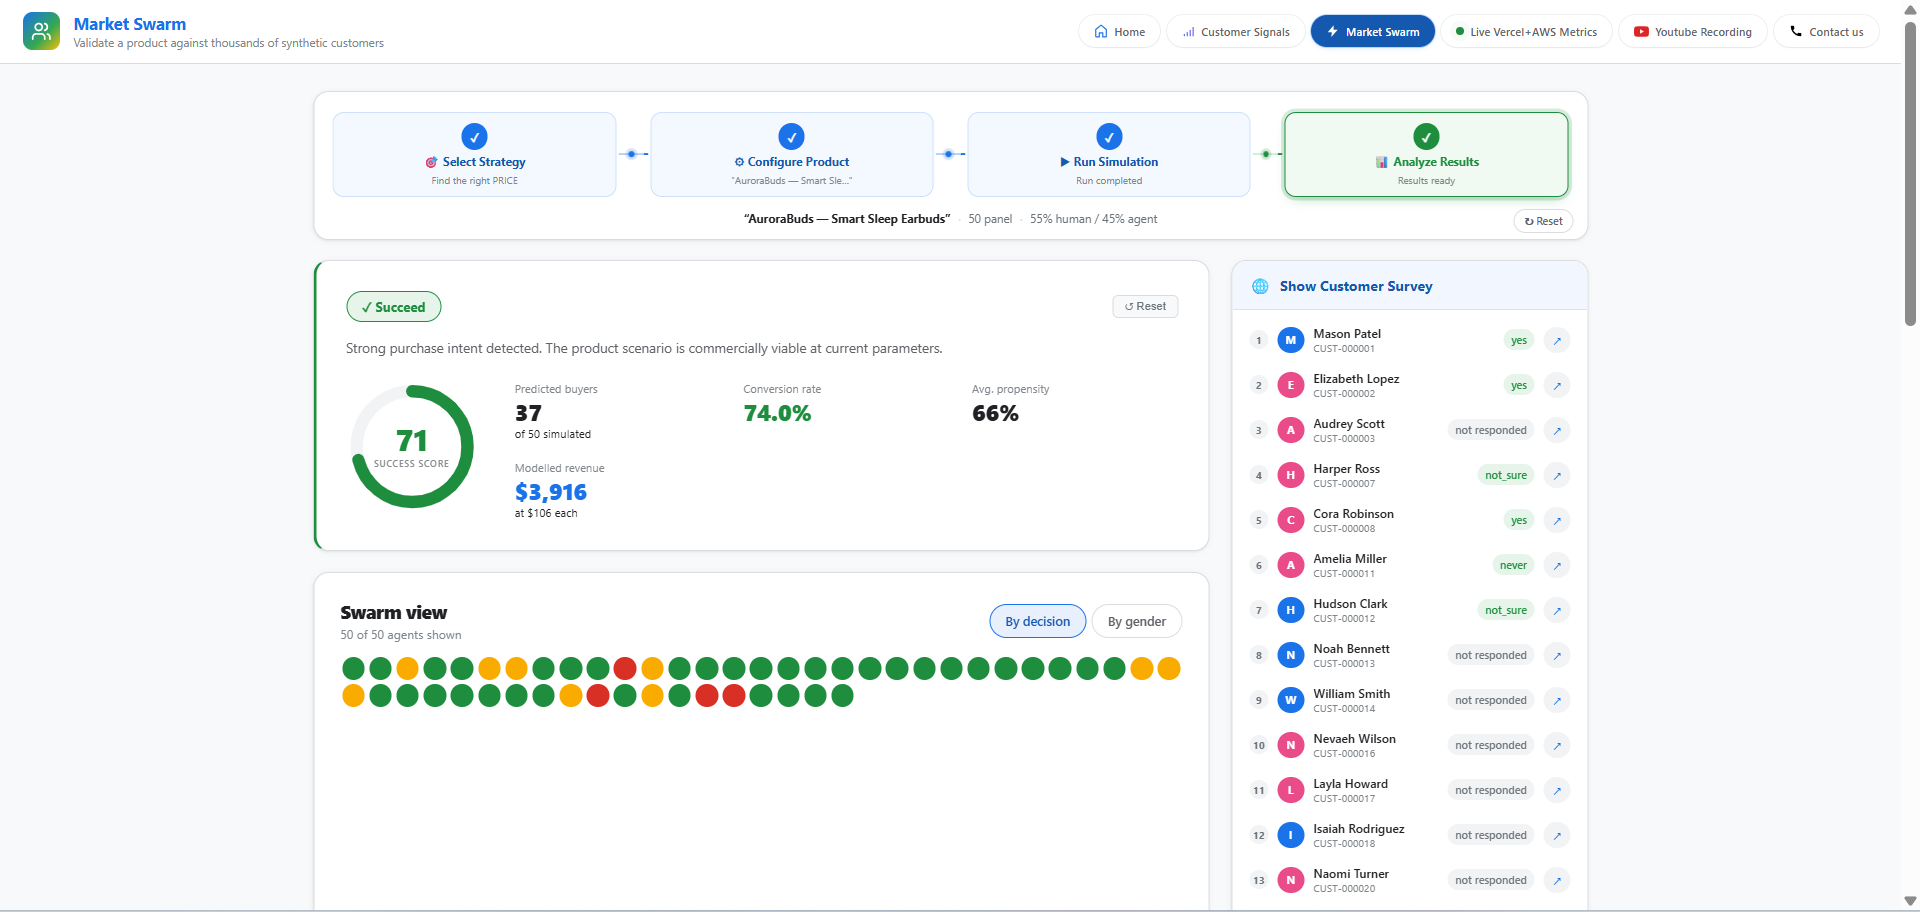
You set it up. You describe a product (say, "AuroraBuds — Smart Sleep Earbuds"), pick an objective like best price or target our top customers, choose how many customers to simulate (for example, 50 or 5,000), and decide the split between real humans and AI agents — for instance, 20% human and 80% agent.
The swarm reacts. Every simulated customer has its own age, gender, income tier, and behavior. Amazon Bedrock's Nova model reads each customer's profile against your product and decides whether they would buy, are not sure, or would never buy.
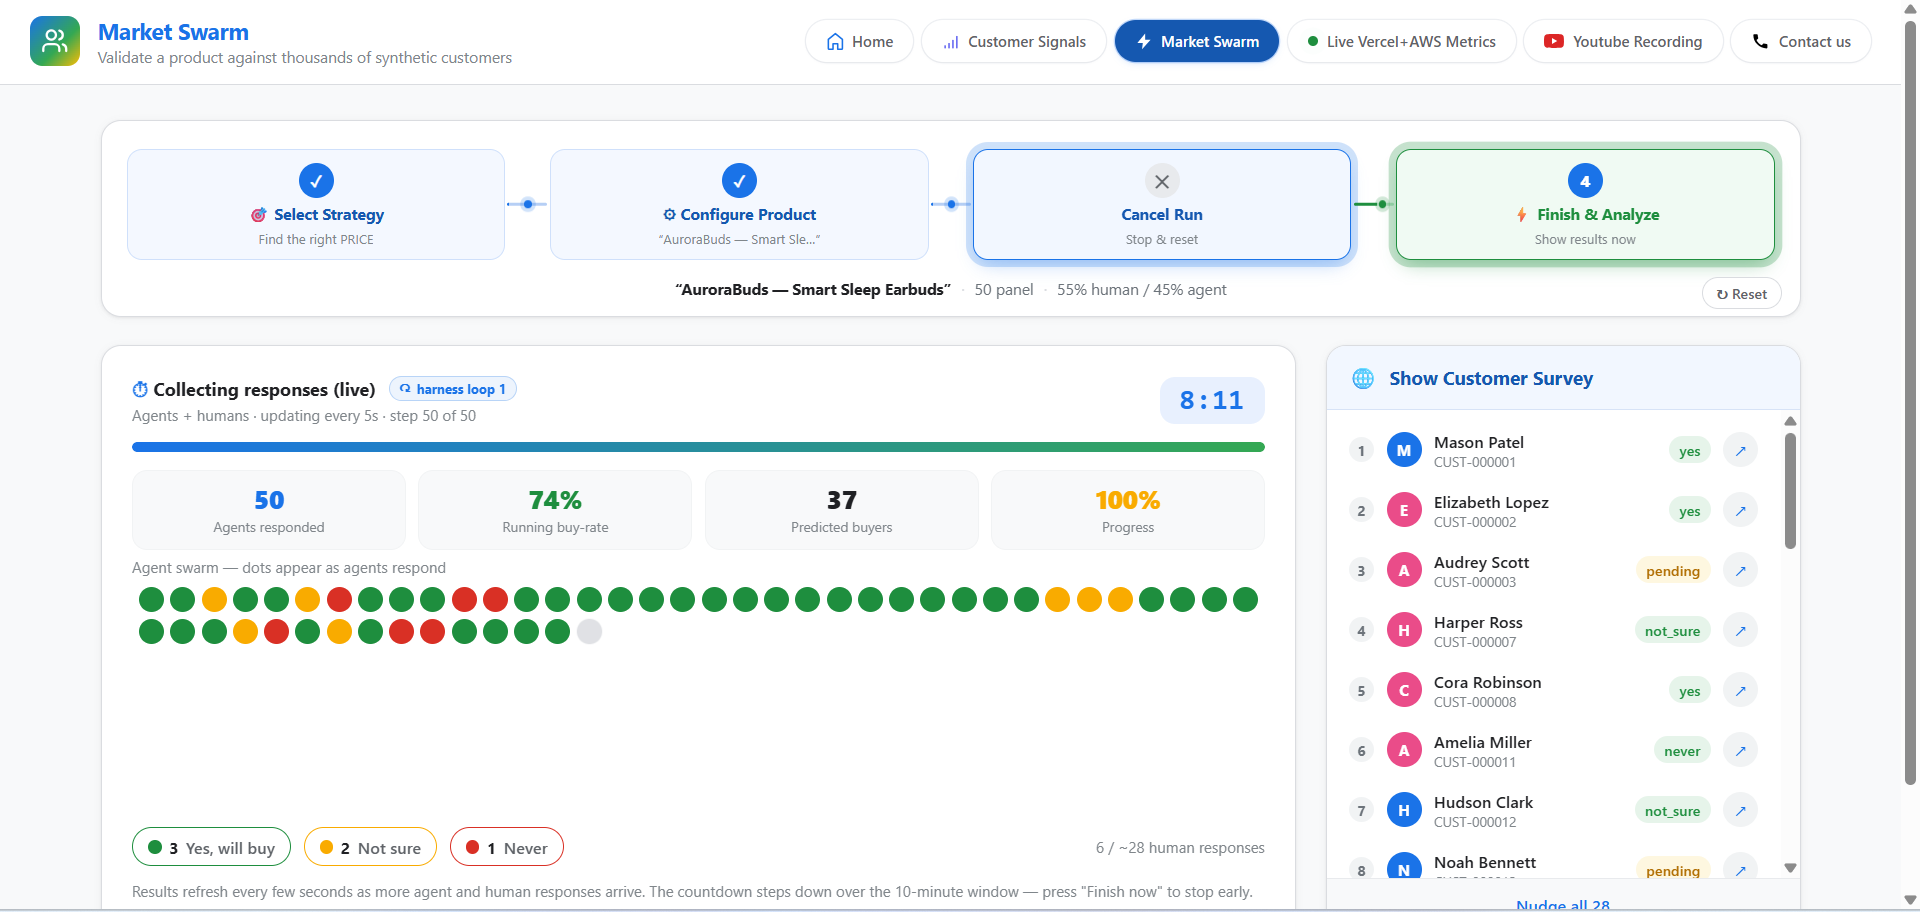
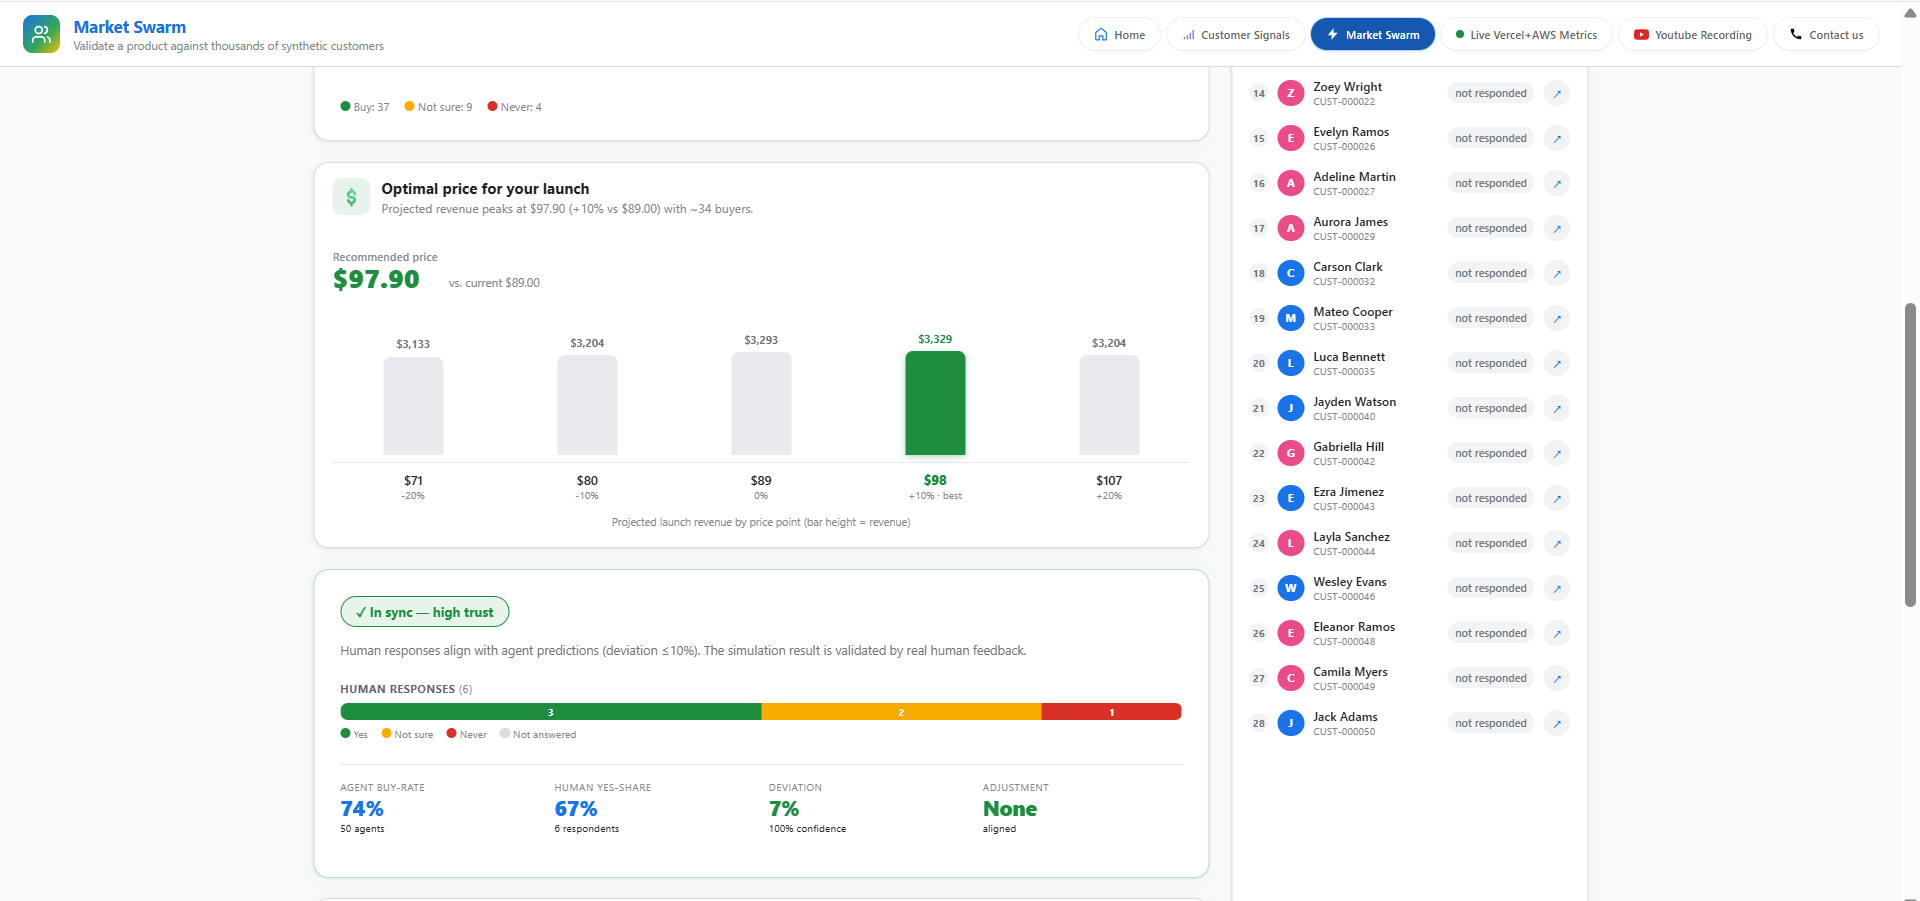
Real people are folded in. While the simulation runs, a live survey collects genuine human responses over a ten-minute window. Each time a real person answers, their vote replaces the matching simulated customer — so the result is anchored to actual people, not just the model's guess.
You watch it live. Customers appear on screen as dots that fill in as they respond. The running buy-rate updates, a counter shows how many have responded, and a countdown timer ticks down the survey window.
You get the verdict and the reasons behind it. At the end you see an overall verdict plus the breakdowns that actually matter: propensity and churn by age, by gender, and by income tier. You also get a reconciliation showing where the AI agreed or disagreed with the real human responses.
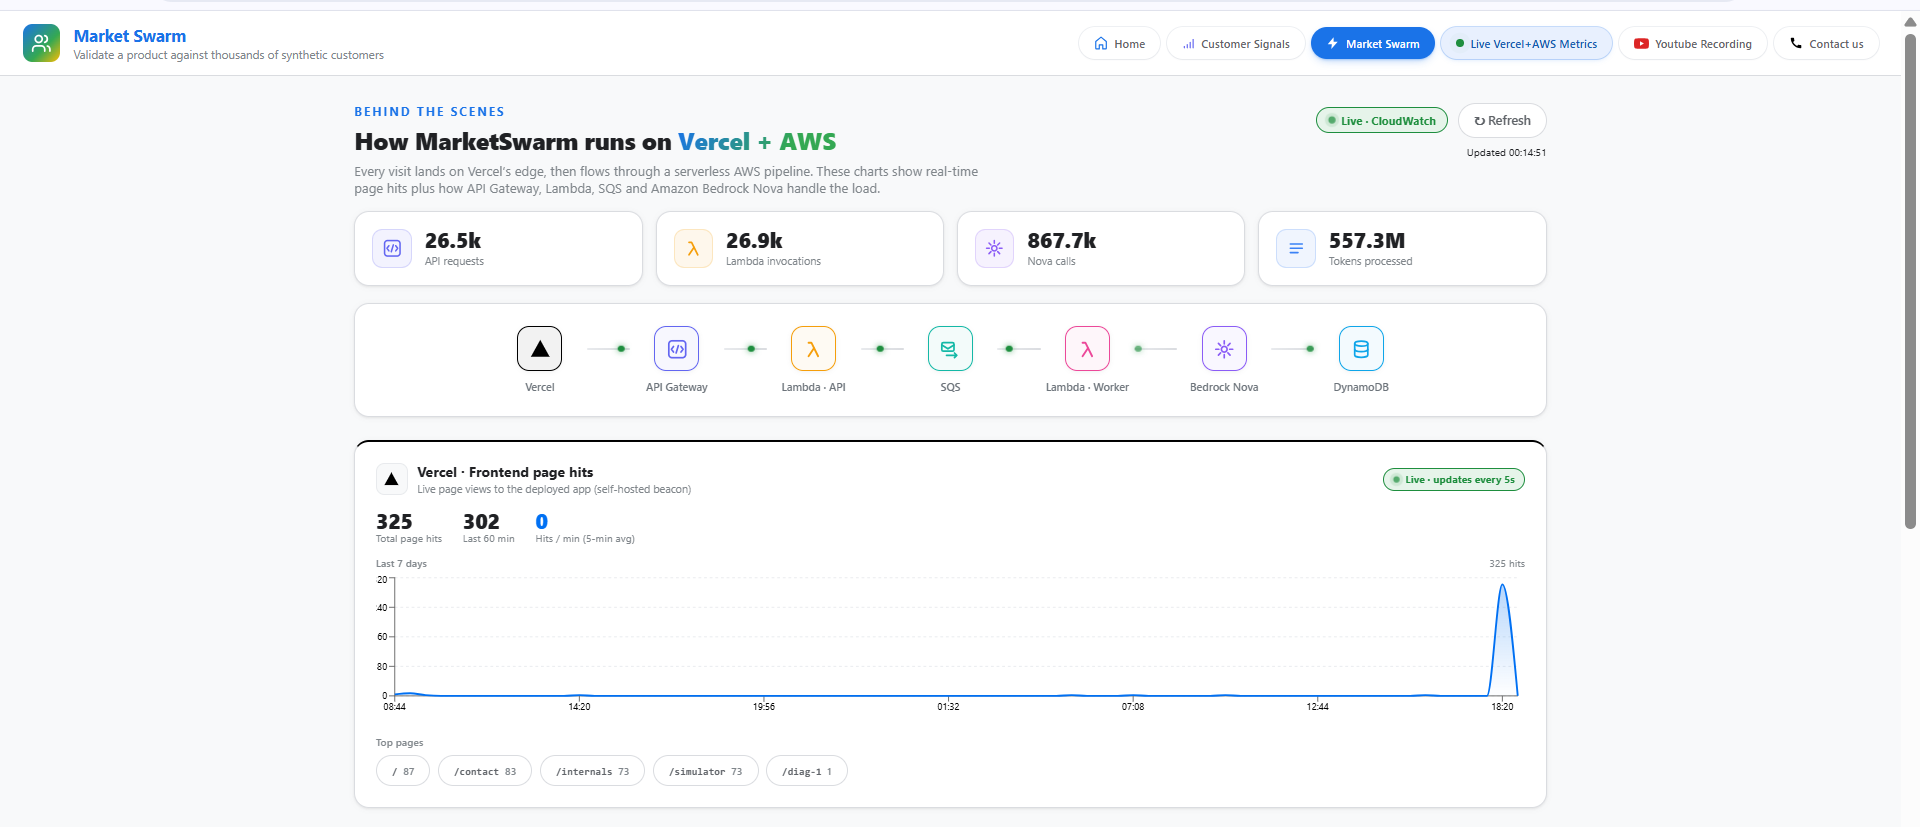
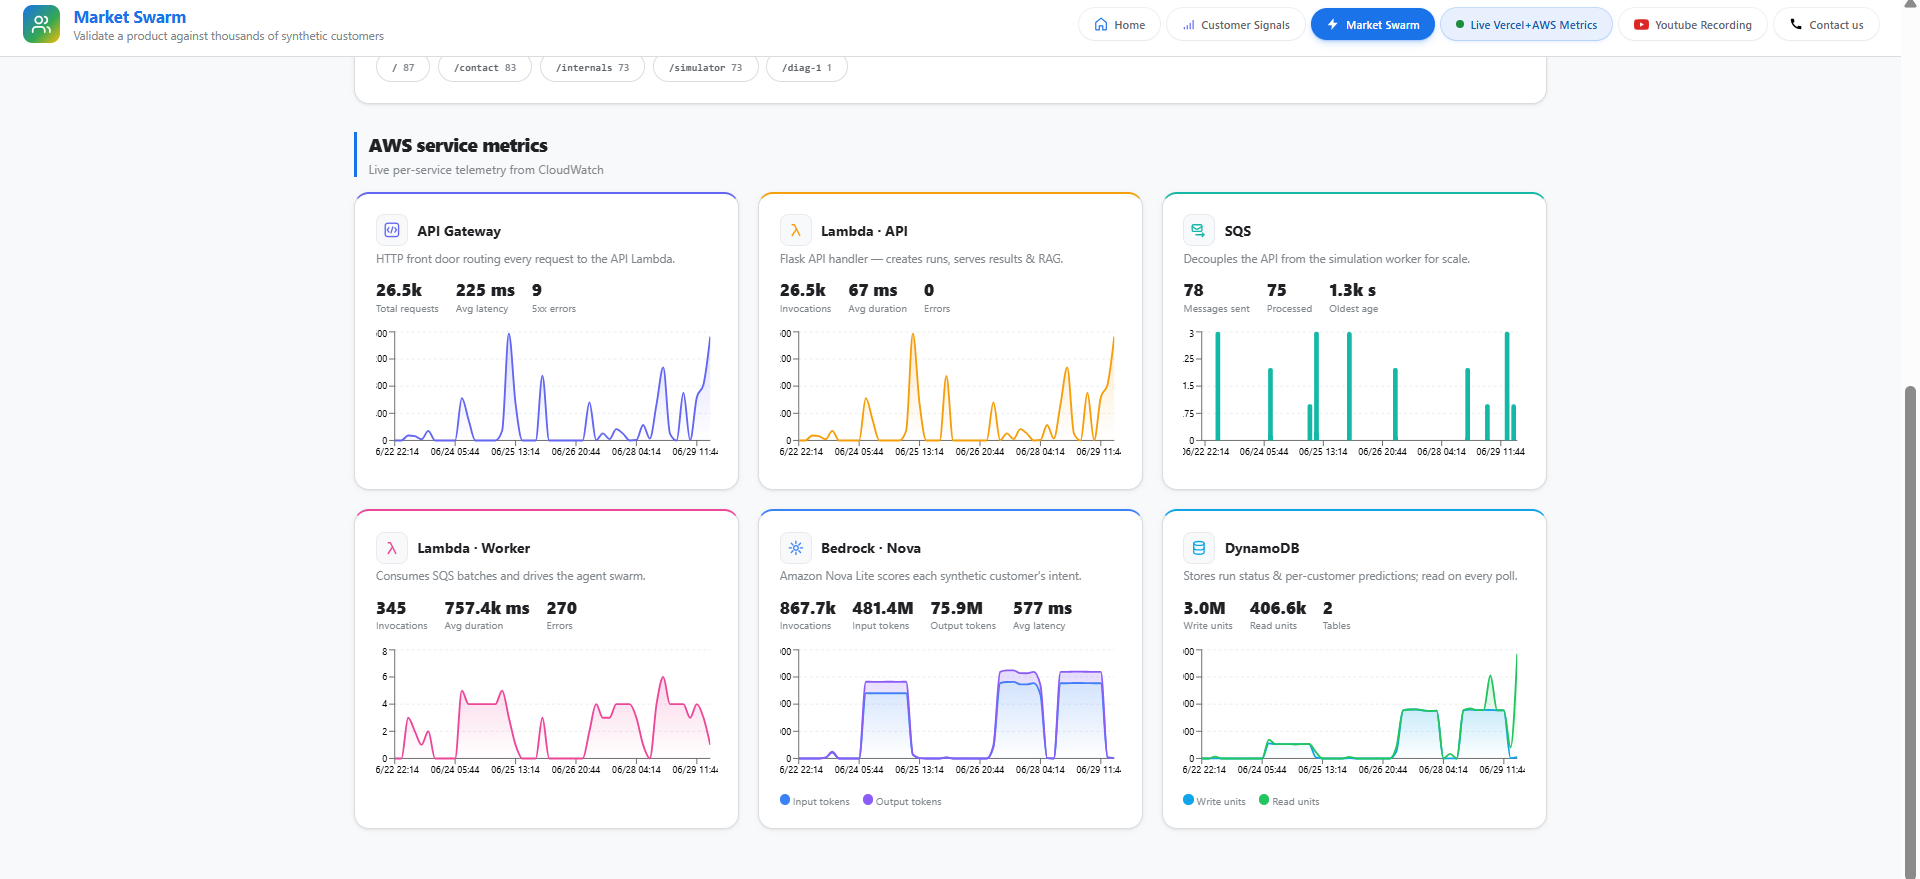
There's also a Live Metrics page that shows real data from every AWS service powering the run, plus frontend traffic — so you can see the system is genuinely doing the work, not faking a result.
The point is to turn "I think this will sell" into something concrete: "Buy-rate is strong with 35–44 year-olds, but churn risk is high in the low-income tier — worth a closer look before launch."
How we built it
MarketSwarm is a serverless application split across two platforms — the frontend on Vercel and the backend on AWS.
Frontend (Vercel)
- Built with Next.js and React, using Recharts for every chart and visualization.
- We designed it as a clear four-step flow — Select Strategy → Configure Product → Run → Analyze — so someone without a technical background can use it without getting lost.
- The live swarm view measures the available space on the page and sizes the customer dots so they all fit, no matter the screen.
- When a real person submits a survey answer, that vote updates the running simulation across browser tabs in real time, so the live view and the survey stay in sync.
Backend (AWS, serverless)
- API Gateway sits in front of a Flask app running on AWS Lambda, which handles starting runs and reporting their status.
- When a run starts, the work is placed on an SQS queue, and a separate worker Lambda picks it up and drives the simulation. This keeps the API fast and lets the heavy work scale on its own.
- Amazon Bedrock (Nova) scores each customer's intent from their profile and the product details.
- DynamoDB stores the run status and the per-customer results in two tables, which we poll to show live progress as the run happens.
- The Live Metrics page reads real numbers from CloudWatch, cached for about a minute so it stays accurate without running up cost.
- The whole backend is deployed with AWS SAM, so infrastructure changes are repeatable and quick to push.
The data behind it
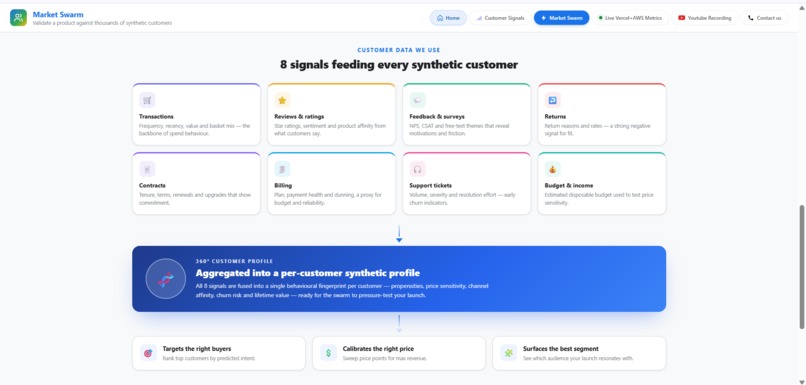
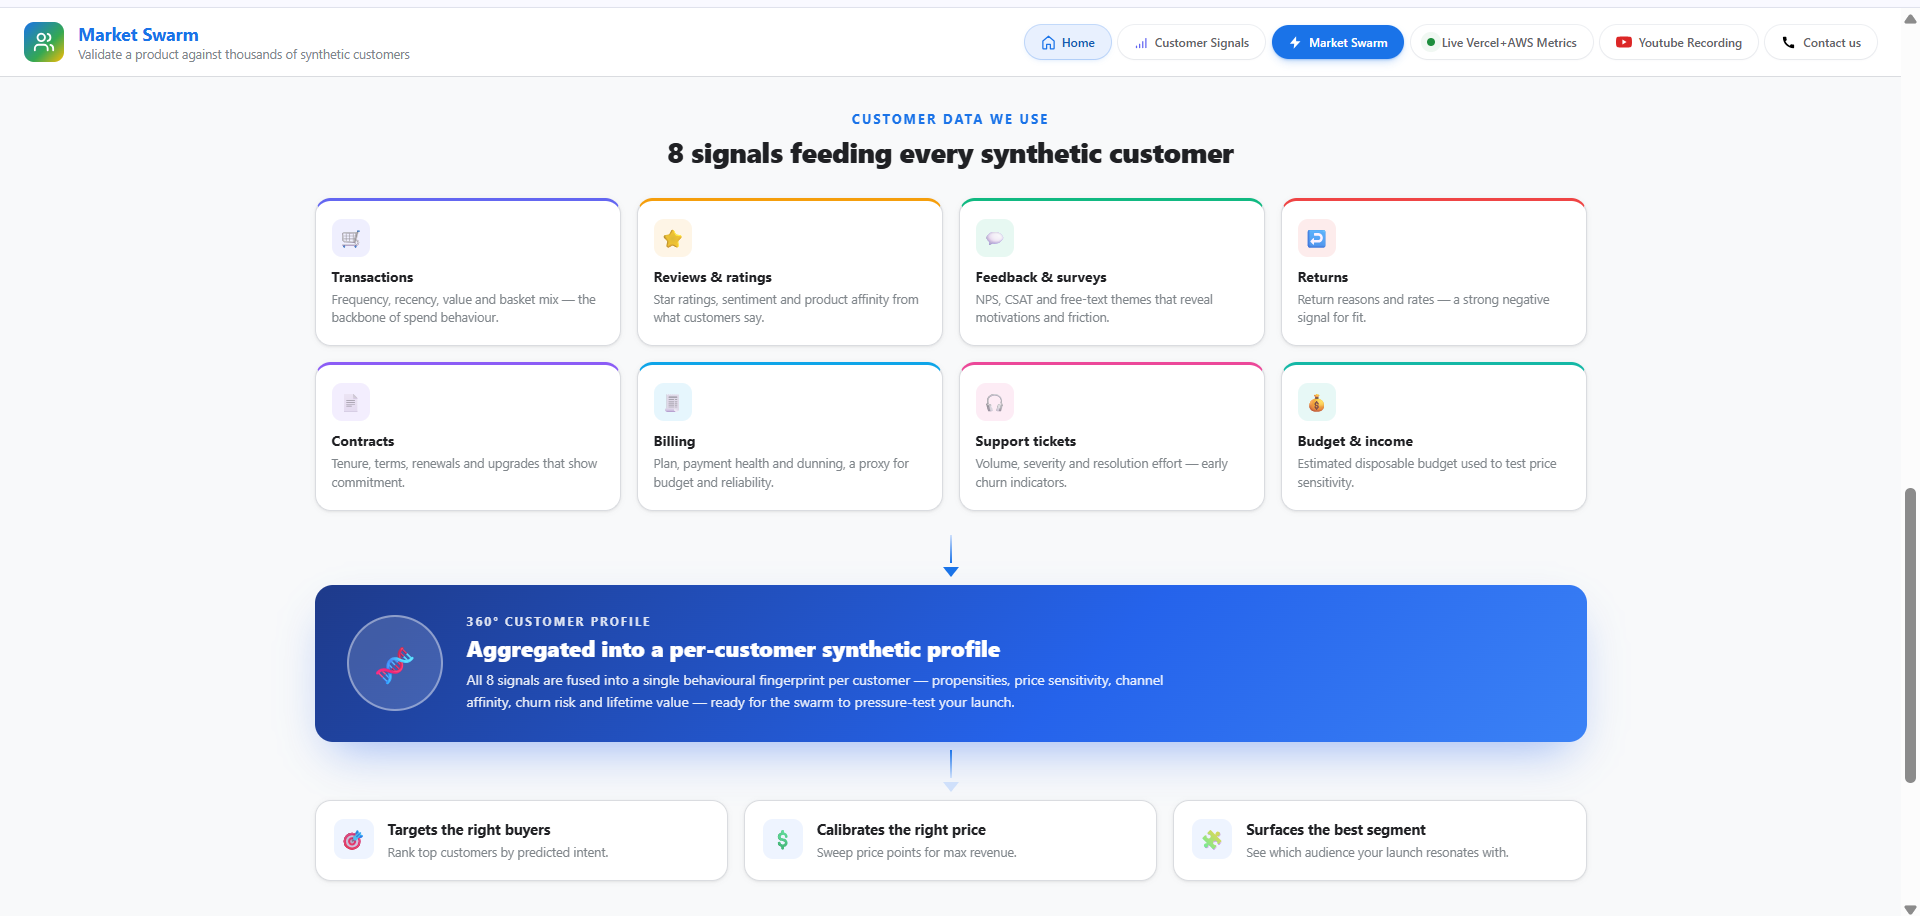
- We wrote a generator that creates customers with realistic variation in age, income, and behavior. This matters a lot — without it, the breakdowns by group would just be random noise instead of something you can read meaning into.
Challenges we ran into
Cancelling a run didn't fully stop it. Our hardest bug: if you cancelled a run partway through, the survey sometimes kept going as if nothing had stopped. The cause was that our polling loop was still resolving against the old run after a reset, so it kept updating a run that no longer existed. We fixed it by tracking which run is currently active and checking that after every poll — so any responses that arrive for a cancelled run are simply ignored.
The live metrics showed nothing for the first minute. Our first version refreshed every sixty seconds, which meant a fresh visit to the metrics page sat empty for a full minute — not good when you're demoing it. We changed the frontend to refresh every ten seconds while keeping the underlying CloudWatch call cached at sixty. The result feels live, but we don't pay for constant queries.
Adding a DynamoDB chart without adding cost. We wanted DynamoDB usage on the metrics page, but didn't want to pay for a separate monitoring setup just for one chart. We solved it by reusing the same cached CloudWatch call that already powered the other charts, so the new chart cost essentially nothing.
Small bugs that ate real time. Some of the trickiest issues were the simple ones. The live view crashed when it tried to measure an element that had already been removed from the page. The fix was a single check, but finding it took a while — a good reminder that the small bugs aren't always the quick ones.
Accomplishments that we're proud of
- It feels real. Watching customers respond one by one, the buy-rate move, and real human votes change individual results makes an abstract idea immediately understandable.
- The metrics aren't faked. Every number on the Live Metrics page comes from live CloudWatch and Vercel data across the real services running the app. We can show the system actually working.
- Human and AI signals together. Many "AI customer" demos are pure simulation. By mixing in real human responses and reconciling the two, our results stay honest and have a built-in reality check.
- Anyone can use it. Someone with no technical background can go from a product idea to a clear, group-level verdict in a single guided flow.
- It stays cheap. Caching, queue-based fan-out, and reusing one metrics call let us run thousands of customers on pay-as-you-go serverless without a large bill.
What we learned
- Serverless fits this kind of work well. Simulating thousands of customers is a bursty, spiky workload, and SQS plus Lambda scaled up to it and back down to nothing without idle cost.
- Bedrock Nova works best with focused input. Giving the model a tight, specific profile and product description produced far more reliable scoring than open-ended prompts.
- Showing the infrastructure builds trust. People believed the verdict more when they could see the system genuinely running behind it.
- Simple actions can hide race conditions. The cancel bug taught us that an obvious button like "Cancel" needs real ownership checks in a polling, multi-tab app — not just a single on/off flag.
- Caching can improve speed and cost at once. We expected to trade one for the other, but the right cache window gave us a faster experience and a lower bill.
What's next for MarketSwarm
- Pricing sensitivity — test different price points and see how each customer group reacts, so you can find the price that balances buy-rate and churn.
- Bring your own customers — let teams import their real customer segments (or connect a CRM) so the simulation reflects their actual market instead of a generic one.
- Compare versions — run several product descriptions or positioning angles against each other and rank them.
- Exportable reports — one-click summaries for stakeholders with the verdict, the group breakdowns, and the human-vs-AI comparison.
- Deeper human input — recruit real human panels on demand and weight their responses by segment to tighten how closely the AI matches reality.
- A confidence score — tell users how much to trust each result based on the panel size, the human ratio, and how much the groups agreed.
The goal stays the same: make it easy to find out who will buy, who won't, and why — before you spend months building it.
Built With
- amazon-web-services
- amazonapigateway
- amazonbedrock
- amazondynamodb
- amazons3
- amazonsqs
- awslambda
- flask
- next.js
- python
- vercelv0


Log in or sign up for Devpost to join the conversation.