-
-
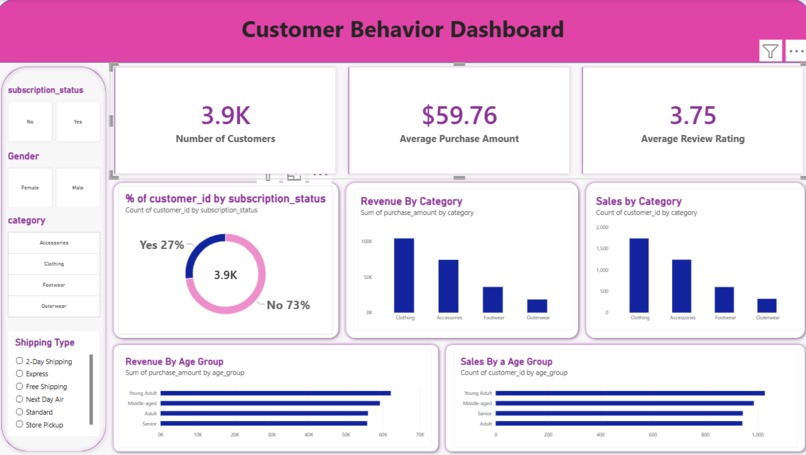
Dashboard for Customer shopping Behaviour Analysis
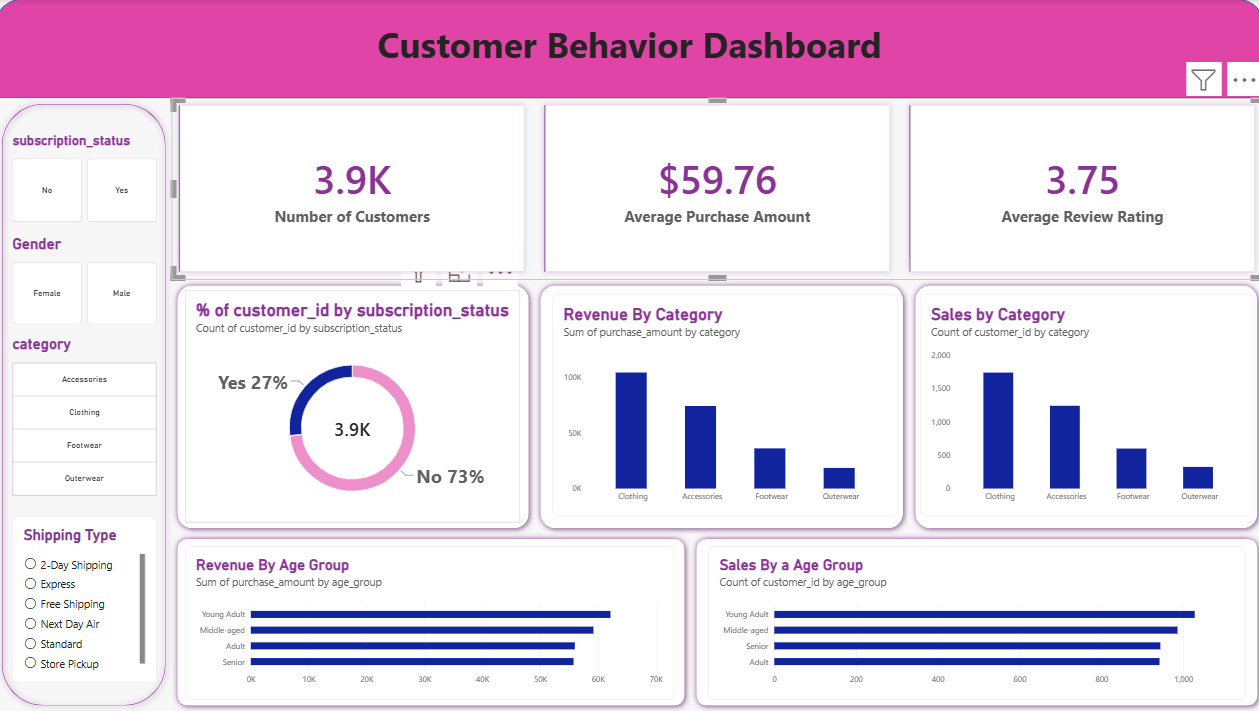
Inspiration
In today's competitive e-commerce landscape, understanding consumer buying patterns, demographic spending habits, and key revenue drivers is crucial for data-driven business decisions. I was inspired to create Customer Shopping Behavior Analysis to build a seamless end-to-end analytics workflow that transforms raw, unorganized customer transaction logs into strategic, business-ready insights.
What it does
- Cleans and Preprocesses Raw Data: Handles missing value imputations, feature engineering, and statistical distribution analysis using Python.
- Executes Complex Querying: Stores structured datasets in a PostgreSQL database using SQLAlchemy and executes advanced SQL queries (CTEs, Window Functions, dynamic aggregations) for deep customer segmentation.
- Interactive Business Intelligence: Connects to Power BI with custom DAX measures to deliver dynamic dashboards visualizing sales metrics, demographic distributions, subscription impact, and purchasing trends.
How we built it
- Data Engineering (Python): Used Pandas and NumPy for exploratory data analysis (EDA), cleaning, and feature generation.
- Database Architecture (PostgreSQL & SQLAlchemy): Migrated processed datasets into PostgreSQL and optimized relational schema queries.
- Data Analysis & Formulation: Calculated core metrics like Average Purchase Value ($APV$) and variance ($s$): $$APV = \frac{\sum \text{Total Revenue}}{\text{Total Unique Transactions}}$$ $$s = \sqrt{\frac{\sum_{i=1}^{n} (x_i - \bar{x})^2}{n - 1}}$$
- Interactive Dashboarding (Power BI & DAX): Designed dynamic BI visuals and key operational insights for business stakeholders.
Challenges we ran into
- Database Integration & Pipeline Automation: Setting up smooth data migration from Pandas DataFrames to PostgreSQL via SQLAlchemy without schema conflicts.
- Complex DAX Expressions: Writing efficient, dynamic DAX measures in Power BI that provide real-time updates across multiple demographic slices without affecting dashboard performance.
Accomplishments that we're proud of
- Built a complete end-to-end data pipeline from raw data ingestion to dashboard delivery.
- Successfully extracted actionable business strategies, such as identifying high-value customer demographics and analyzing how subscription status impacts average purchase amounts.
What we learned
- Hands-on experience with advanced relational database operations, CTEs, and Window Functions.
- Advanced data modeling and dynamic DAX measure creation in Power BI.
- How to structure an end-to-end data analytics pipeline that bridges raw engineering with executive decision-making.
What's next for Customer Shopping Behaviour Analysis
- Predictive Analytics: Integrate machine learning classification models to predict customer churn and lifetime value ($CLV$).
- Automated Data Pipeline: Deploy the PostgreSQL and Python orchestration scripts on cloud infrastructure for real-time automated ingestion and live dashboard updates.
Built With
- data-analytics
- data-modeling
- data-visualization
- dax
- eda
- numpy
- pandas
- postgresql
- powerbi
- python
- sql
- sqlalchemy

Log in or sign up for Devpost to join the conversation.