-
-
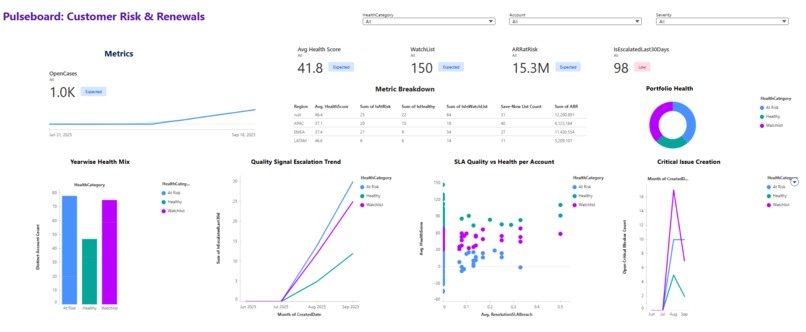
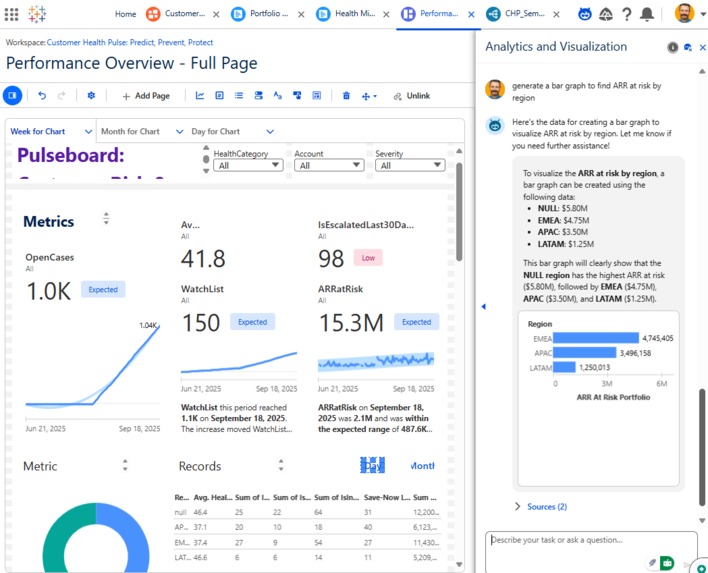
Customer Health Pulseboard (Dashboard)
-
Created using AgentForce: Based on this, a Slack message was drafted, for creating save plan in the current week.
-
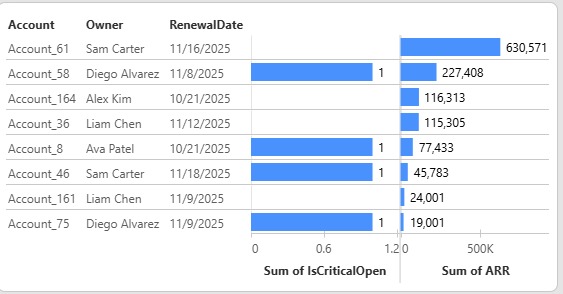
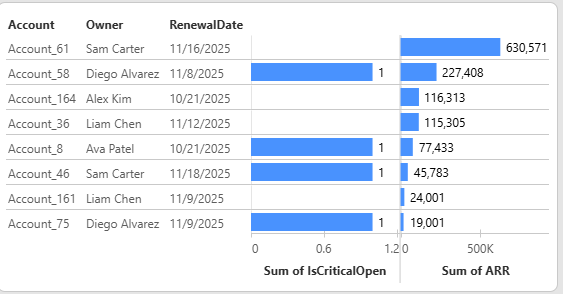
Created using AgentForce: Top 10 AT-Risk accounts by ARR with RenewalDate <=60 days and OpenCriticalCases > 0
-
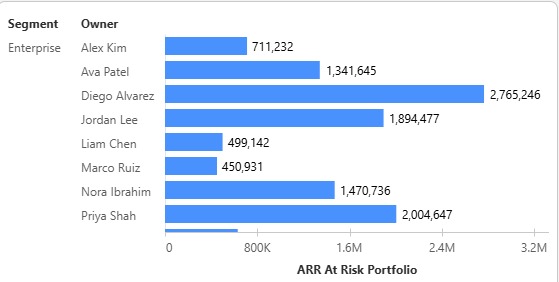
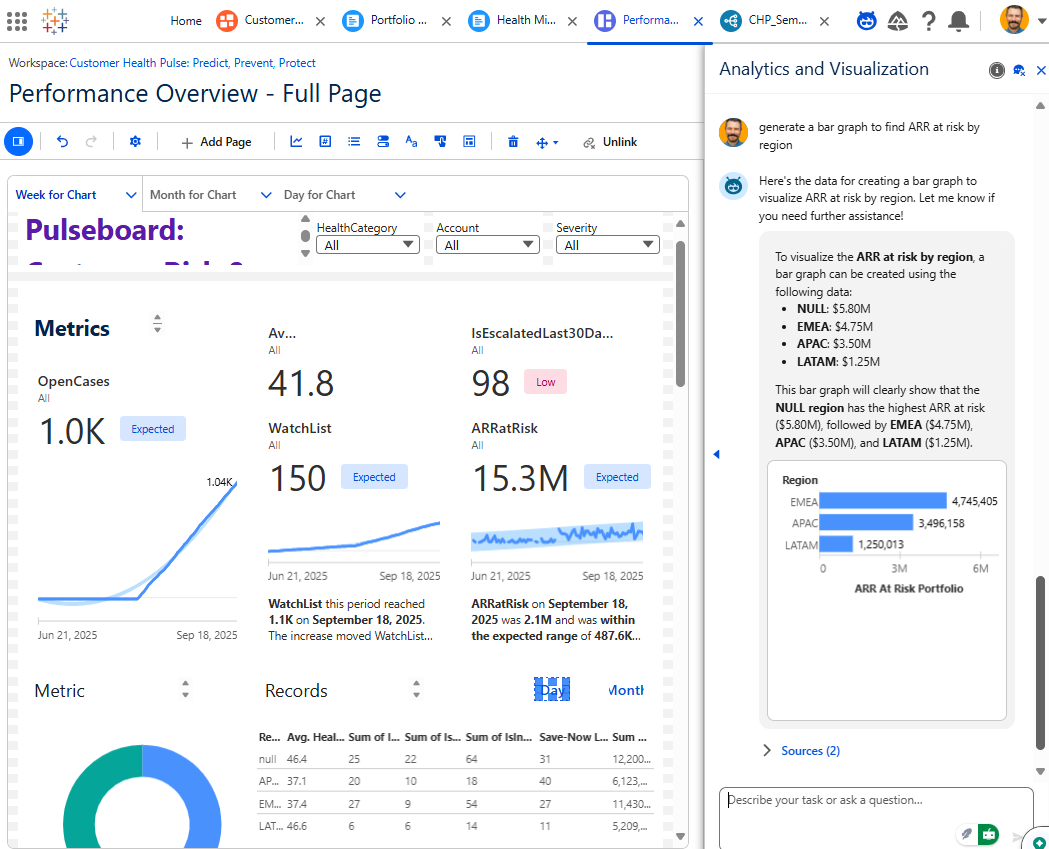
AF: The distribution of ARR at Risk across different segments & owners, with Enterprise - significantly higher values compared to Mid-Market
-

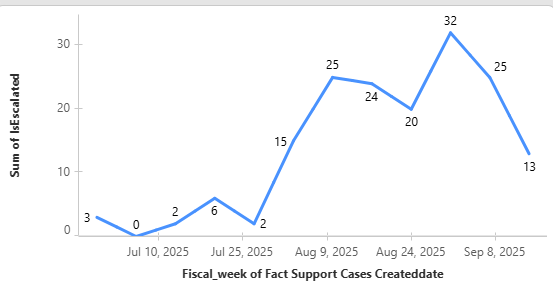
Created using AgentForce: Weekly Escalations trend for the last 12 weeks
-
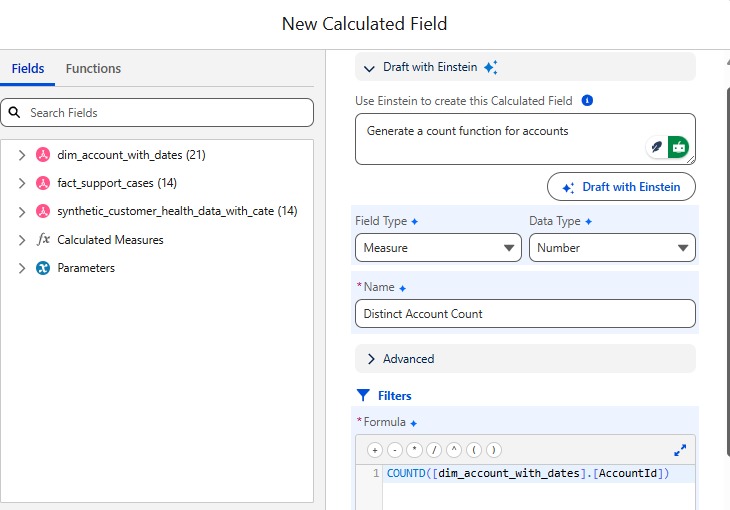
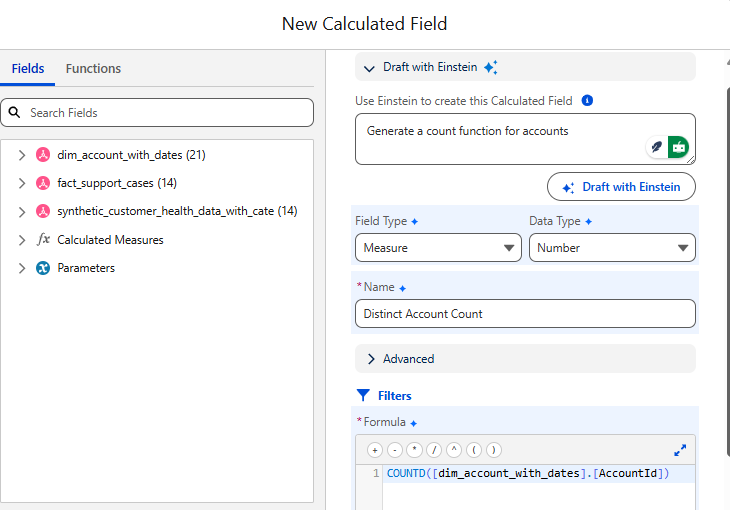
Generating a New Calculated Field using Einstein
-
Trying new prompts with Agentforce to generate valuable insights


Inspiration:
I was motivated by the problem that customer success teams deal with on a daily basis: churn's early warning signs are scattered throughout several systems, including CRM, support, product usage, and Slack. Frequently, it is too late when the signals appear. Our goal was to create a system that could not only visualize these signals but also convert them into account-saving actions.
What it does?
“Pulseboard: Customer Risk & Renewals” is a Tableau Next app inside Salesforce that: Computes a transparent HealthScore from engagement, usage, support, and recency signals and buckets accounts into Healthy / Watchlist / At Risk. It displays portfolio KPIs, such as Average Health, % At Risk, and ARR at Risk, and shows the risk's geographic or segmental distribution. Agentforce turns insights into playbooks by creating "save plan" actions in Salesforce and automatically drafting Slack direct messages to owners. Risk becomes an actionable work queue rather than a static report.
How we built it?
Data model: A synthetic base table of ~200 accounts with fields such as LoginsLast30Days, OpenSupportCases, SlackMentions, ProductUsageHours, LastEngagementDaysAgo, and a derived HealthScore and HealthCategory was generated. We added an accounts dimension (ARR, region, owner, renewal dates) and a support fact (cases with severity/status/dates).
Health scoring: The score increases with logins/usage and decreases with open cases/inactivity, then maps to categories (Healthy ≥70; Watchlist 30–69; At Risk <30). This keeps the model simple, explainable, and demo-friendly.
KPIs & metrics: Created big-number KPIs (Avg Health, % Healthy, % At Risk, ARR at Risk, Open Critical Cases, Escalations 30d) and rollups (e.g., ARR renewing ≤N days, cases per account). The visuals include:
• Portfolio Health donut, Health Mix bars
• Metric Breakdown table by Region/Segment/Owner
• Escalation trend (leading indicator)
• SLA vs Health scatter with medians to expose root cause clusters
• Critical issue creation trend
Challenges we ran into:
Generating artificial intelligence data that is realistic enough to mimic consumer behavior and draw attention to health trends.
Demonstrating value while streamlining Slack integration to meet the hackathon schedule.
Putting features first and avoiding over-engineering in favor of a distinct MVP.
Accomplishments that we're proud of:
• Delivered an end-to-end loop: data → health scoring → executive dashboard → Agentforce playbooks.
• Built a clear, defensible risk model and KPIs that judges can audit.
• Showcased Agentforce turning analytics into workflow: target lists, Slack drafts, and tasks created from prompts.
What did we learn?
• Explainability beats opacity. A simple, transparent score helped leaders trust prioritization.
• Prompts need structure. Agentforce works best when grounded to objects/tables and paired with explicit tool calls; natural language alone isn’t enough.
• Storytelling matters. The Problem → Insight → Action → Impact storyboard keeps a 5-minute demo crisp.
What's next for Customer Health Pulse: Predict, Prevent, Protect?
- Deeper signals: sentiment from tickets/Slack, NPS/CSAT, product feature adoption.
- Predictive modeling: ML churn propensity layered over interpretable rules.
- Closed-loop automation: Agentforce triggers flows (playbook tasks, executive call scheduling, comped credits) based on thresholds.
- Data Cloud unification: live pipelines and calculated insights to replace CSVs.
Built With
- salesforce
- slackapi
- tableaunext

Log in or sign up for Devpost to join the conversation.