Inspiration
Customer churn is one of the most expensive problems for subscription businesses like telecom providers. It is generally far cheaper to keep a customer than to win a new one, but retention teams cannot call everyone. I wanted to build a tool that shows who is most likely to leave, so limited retention effort goes where it matters most. I also wanted to learn how a machine learning model goes from a script to something a non-technical person can actually use.
What it does
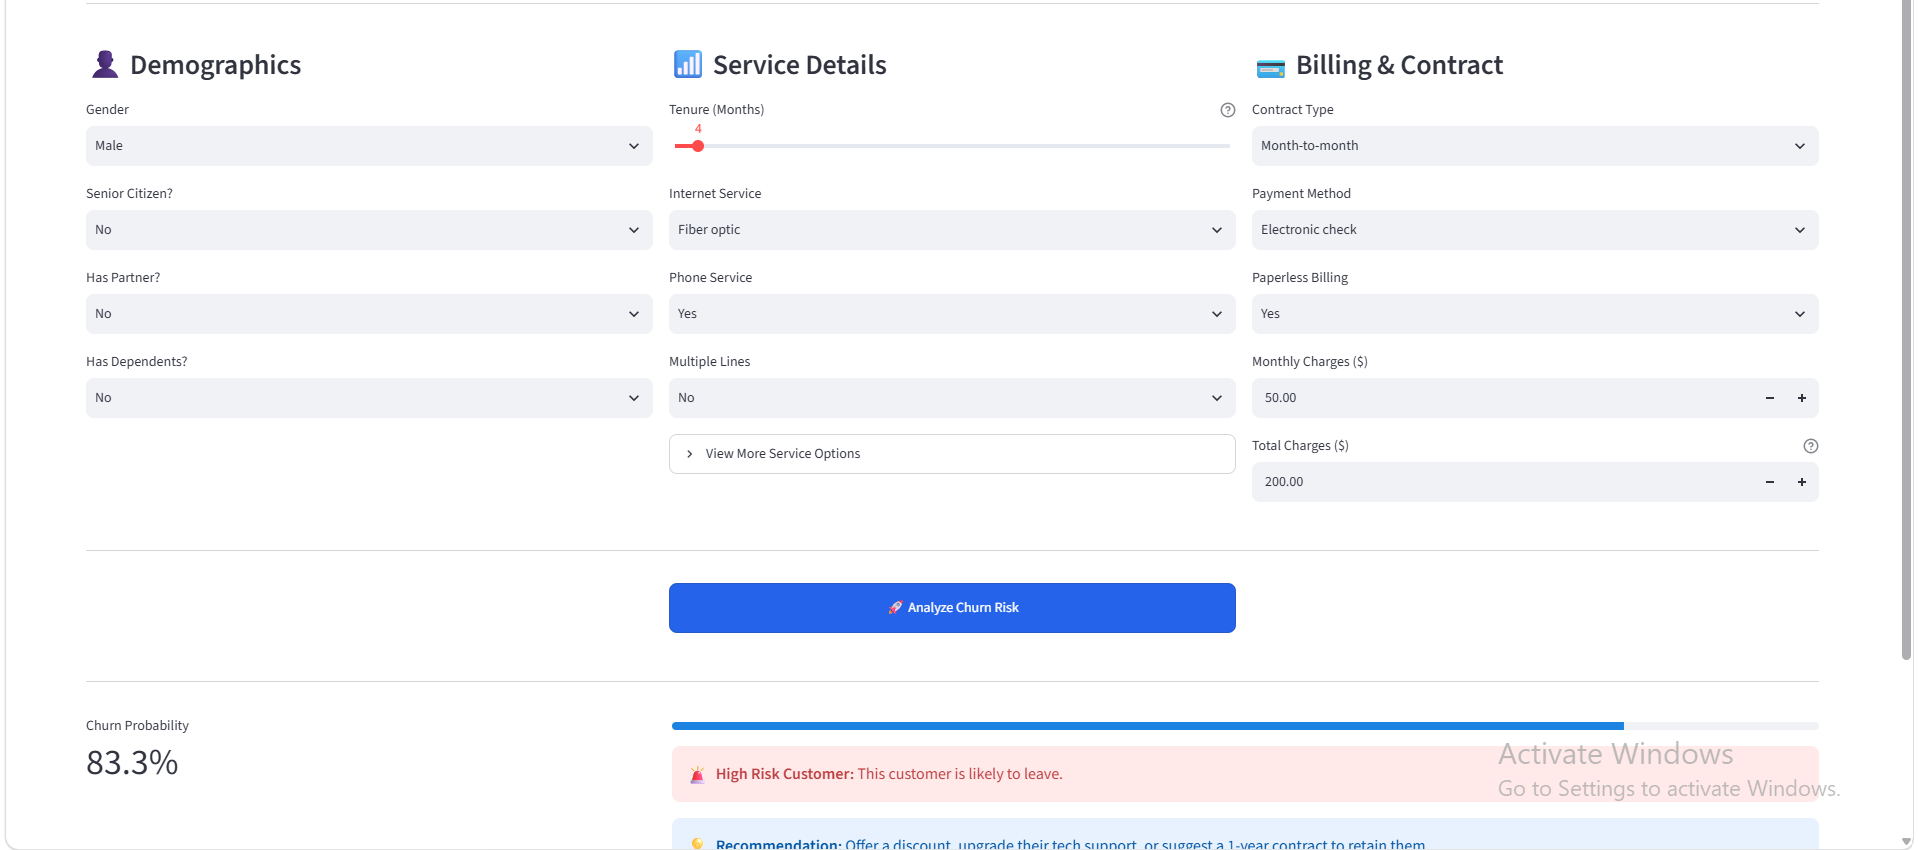
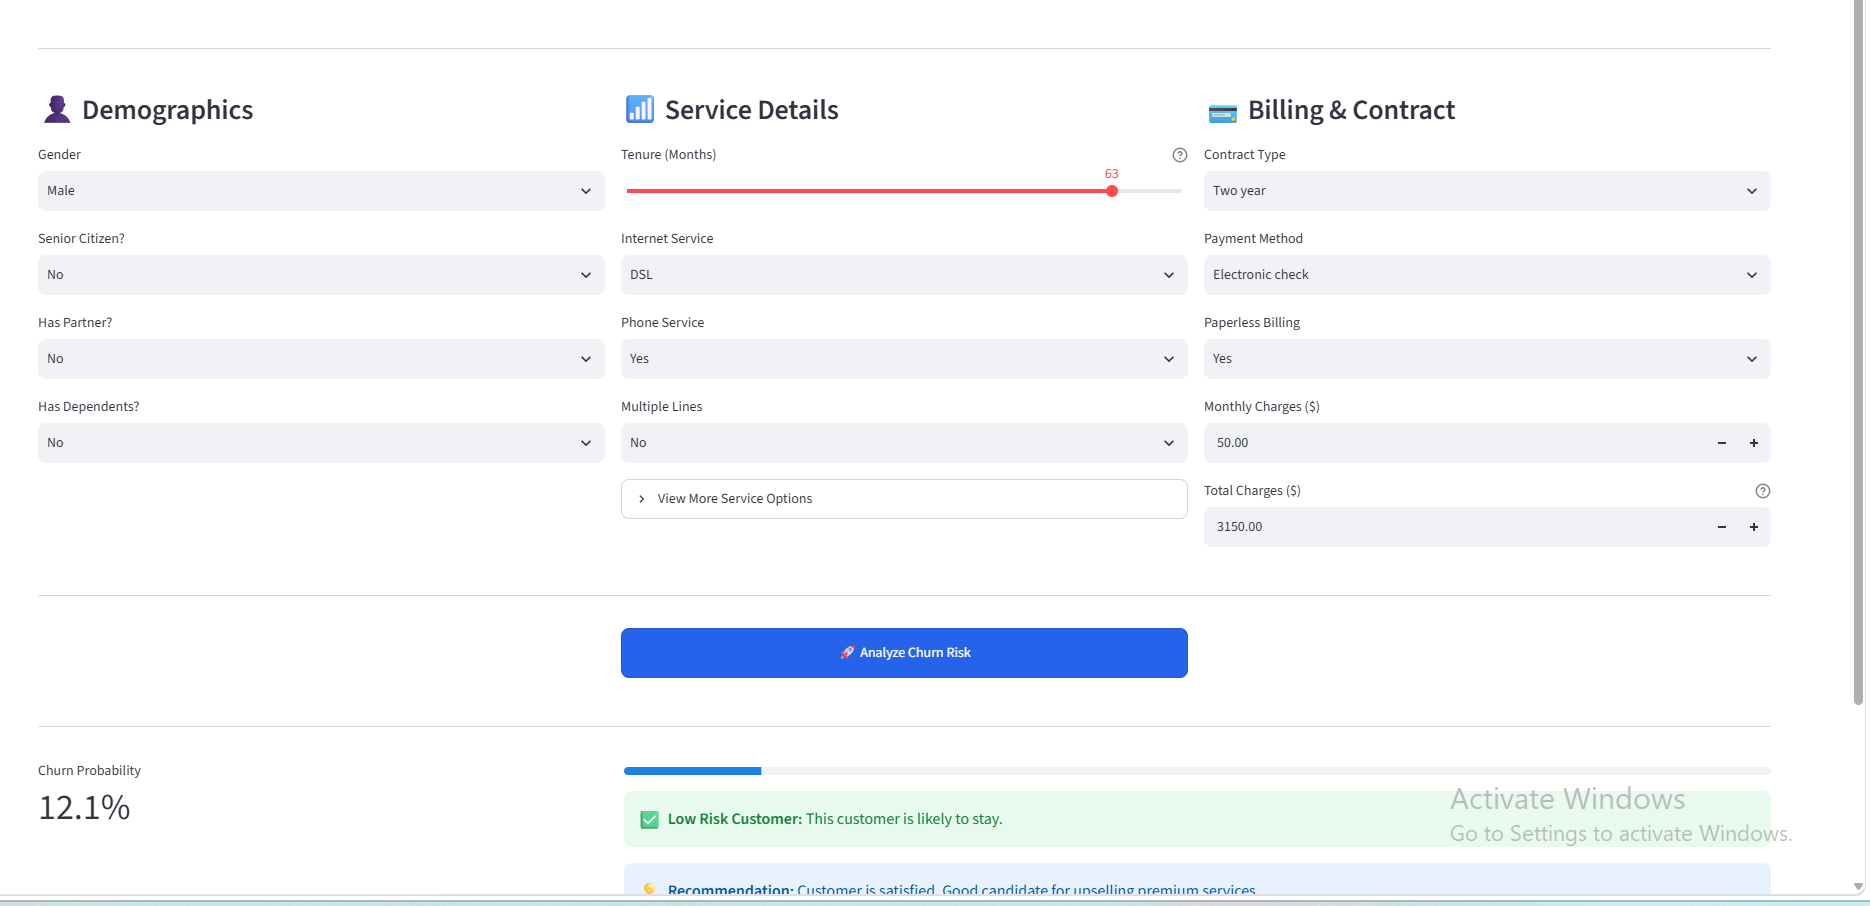
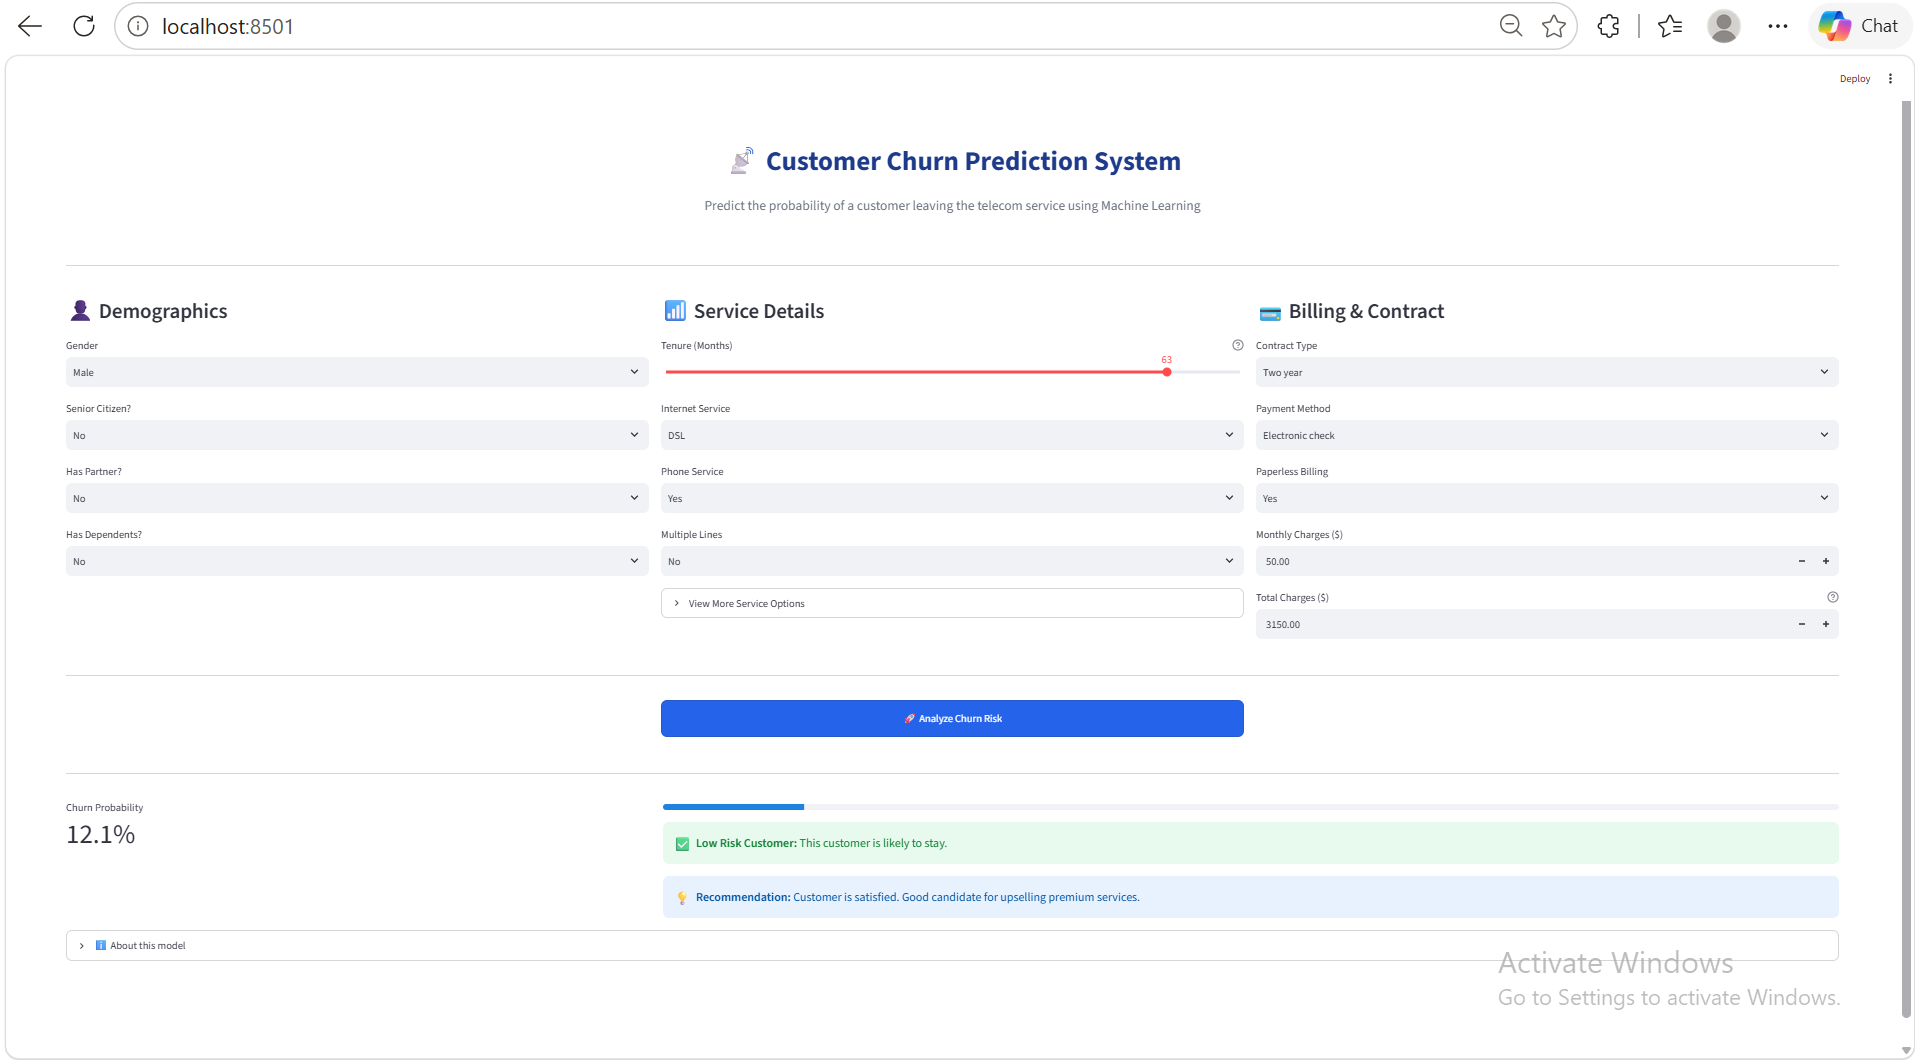
The Customer Churn Prediction System takes a customer's profile (demographics, services, contract and billing details) and returns a churn probability and a risk band:
- 🟢 Low (below 35%): likely to stay, a good candidate for upselling
- 🟡 Medium (35% to 58%): monitor and consider a proactive check-in
- 🔴 High (58% or above): likely to leave, with suggested retention actions
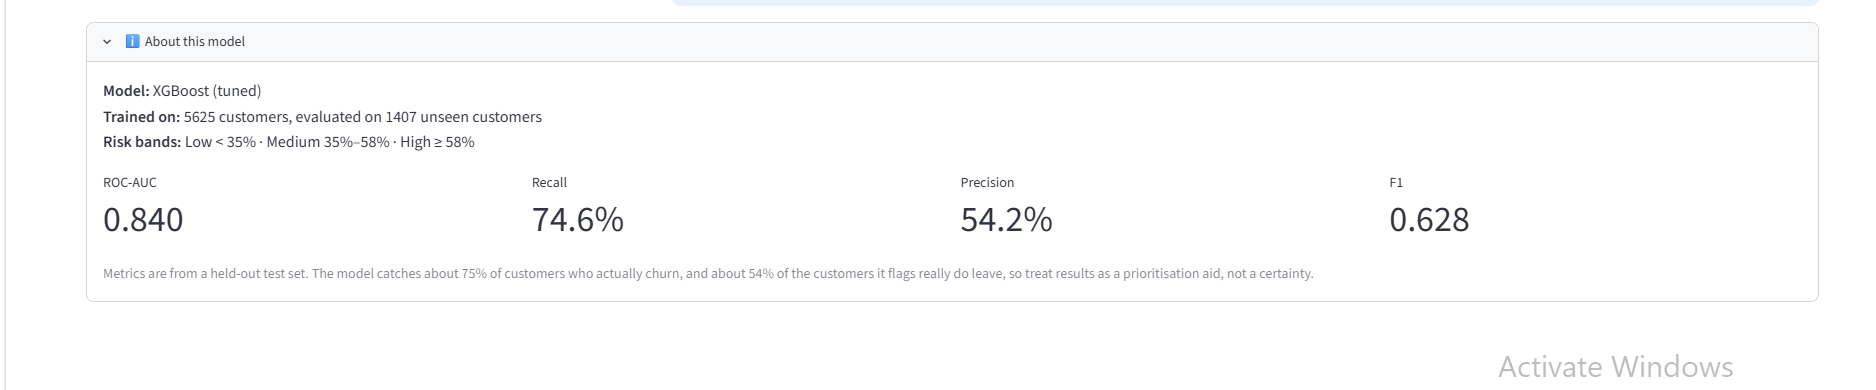
It runs as an interactive Streamlit web app. An "About this model" panel shows the model's real test-set performance, so users know how much to trust each prediction.
How we built it
- Data: the IBM Telco Customer Churn dataset (7,043 customers, about 27% churn). I cleaned blank
TotalChargesvalues and engineered tenure groups. - Pipeline: a scikit-learn
Pipeline(scaling, one-hot encoding and the classifier in one object), so training and prediction always use identical preprocessing. The feature code is shared between the training script and the app. - Model selection: XGBoost tuned with 40 random configurations × 5-fold cross-validation, compared against Logistic Regression and an "always predict stay" baseline.
- Class imbalance:
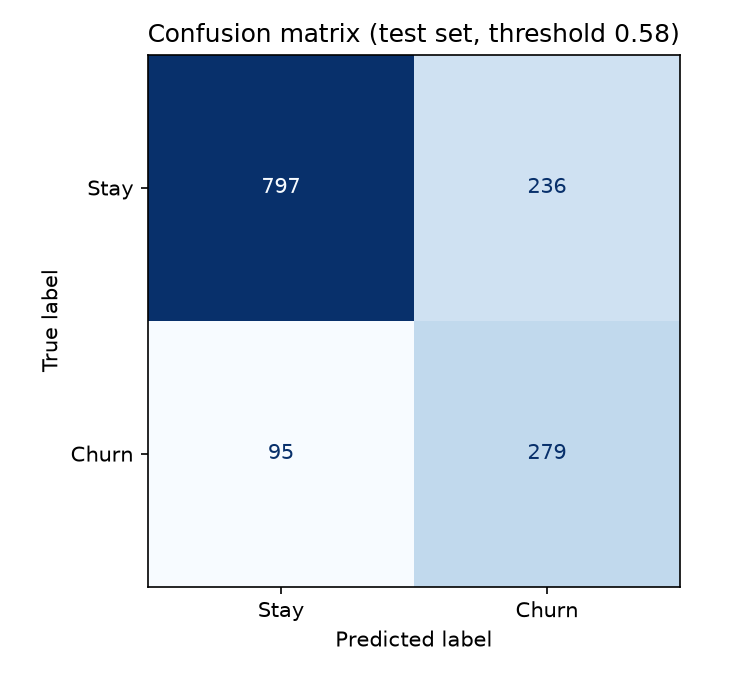
scale_pos_weightset to the real class ratio. - Decision threshold: chosen by maximizing F1 on out-of-fold training predictions (0.58), so the test set was used only once, for the final report. $F_1 = \frac{2 \cdot \text{precision} \cdot \text{recall}}{\text{precision} + \text{recall}}$
- App and tests: a Streamlit interface plus automated
pytesttests, including end-to-end tests of the app itself.
Results on 1,407 customers the model never saw:
| Model | ROC-AUC | Recall | Precision | F1 |
|---|---|---|---|---|
| Baseline (always "stay") | 0.500 | 0.000 | n/a | 0.000 |
| Logistic Regression | 0.834 | 0.791 | 0.488 | 0.604 |
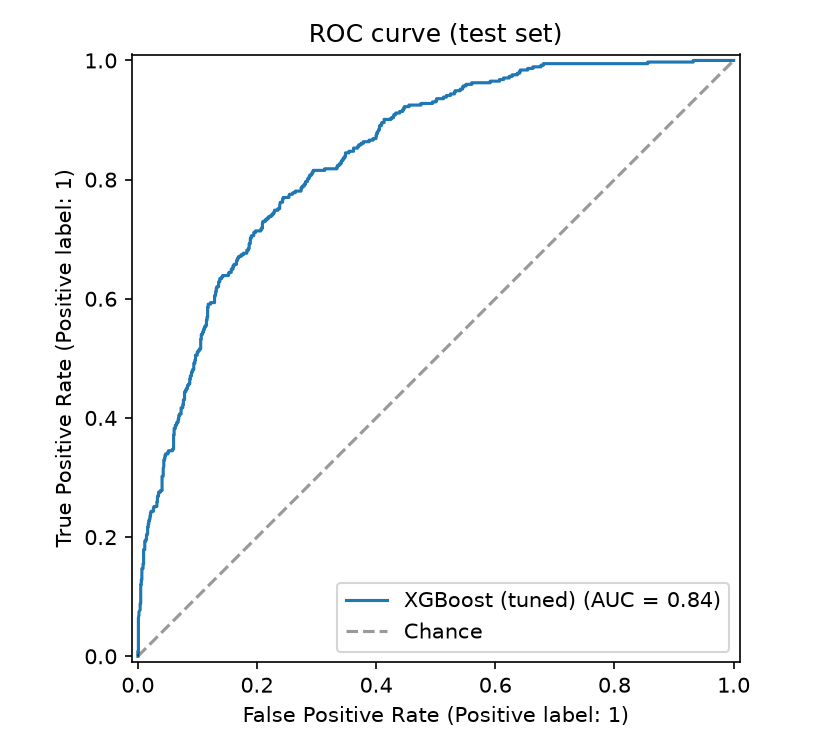
| XGBoost (tuned) | 0.840 | 0.746 | 0.542 | 0.628 |
The tuned model catches 279 of the 374 customers who actually churned (74.6%), and about 54% of the customers it flags really do leave.
Code: https://github.com/rehanfarooq1911/Telco-churn-predictor
Challenges we ran into
- Overfitting: my first XGBoost scored 0.99 ROC-AUC on training data but only 0.81 on unseen data. It had memorized the training set.
- Misleading accuracy: about 73% of customers don't churn, so a model that always says "stays" is already 73% accurate. I had to judge the model by ROC-AUC, recall and precision instead.
- Inputs that contradicted the training data: the app let a user choose "No internet service" but leave add-ons like Online Security at "No", a combination the model never saw. It pushed one test customer's risk up to about 60%. The form now sets the correct category automatically.
- Edge case: a tenure of 0 months silently became a missing value in my tenure-group feature.
- Model portability: a saved XGBoost model only loads with the same library versions that created it. The app crashed on my own machine with
input stream corrupted, so I made it show a clear fix message instead of crashing, and documented the fix in the README.
Accomplishments that we're proud of
- Raising test ROC-AUC from 0.810 to 0.840, shrinking the train/test gap from 0.18 to 0.02 (0.863 vs 0.840), and raising recall from 68% to about 75%.
- Tuning and choosing the threshold without ever peeking at the test set.
- Finding the app's bugs by testing it end to end, and locking each one in with an automated regression test.
- Being honest about the limits: roughly half of the customers the model flags will not actually leave, and the app and README say so.
What we learned
- Good evaluation matters more than a clever model: a simple baseline and a held-out test set exposed problems that accuracy alone hid.
- Overfitting is easy to create and easy to miss. Comparing train and test scores should be routine.
- Models need protection from impossible inputs, so the interface has to respect how the training data was structured.
- Reproducibility is part of the job: pinned versions, shared feature code, tests and a clear README.
What's next for Customer Churn Prediction System
- Deploy the app online (for example on Streamlit Community Cloud).
- Add per-customer explanations (such as SHAP) showing why a customer is high risk.
- Choose the threshold using real business costs (cost of a retention offer vs. cost of losing a customer).
- Add batch scoring by uploading a CSV of customers.
- Calibrate the probabilities and validate on data from other providers and time periods.
Built With
- github
- joblib
- matplotlib
- numpy
- pandas
- pytest
- python
- scikit-learn
- streamlit
- xgboost

Log in or sign up for Devpost to join the conversation.