-
Intro screen on startup
-
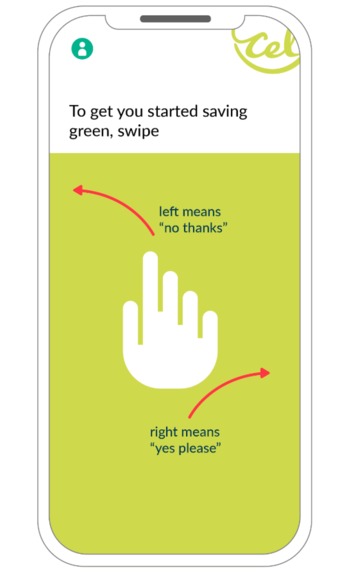
On first sign-on 1: the user is given a simple tutorial on how to express their preferences by swiping.
-

On first sign-on 2: the user is presented a series of cards that she can swipe left or right to indicate her personal preferences.
-
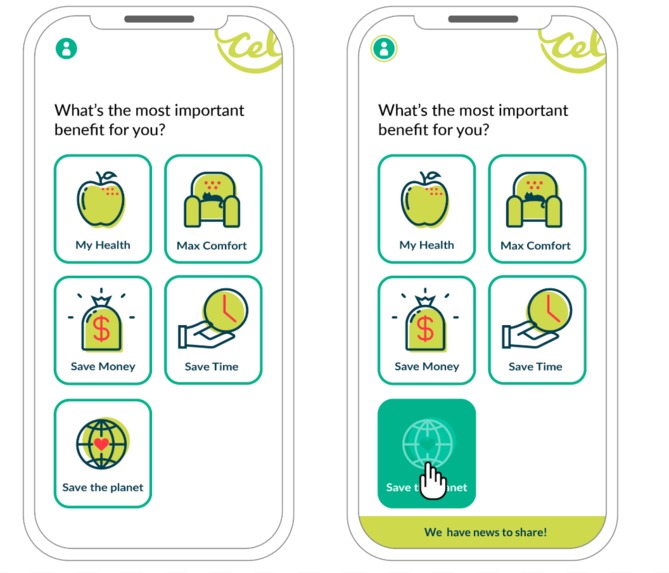
Profile Settings: the user can always click on her profile icon to change her selected preferences.
-
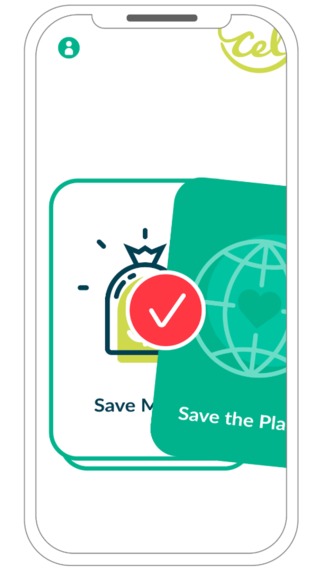
Save the Planet Choice Journey: our user has prioritized saving the planet as her strongest preference.
-
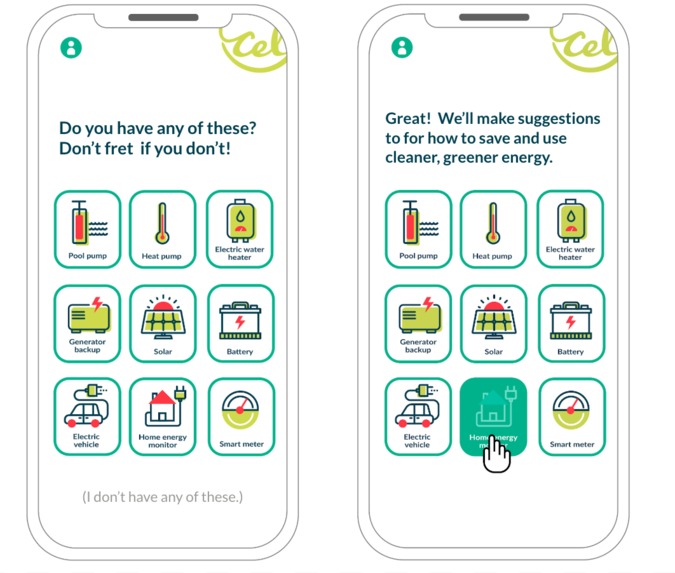
Save the planet flex screen: user identifies devices/data sources. Data used to personalize suggestions and control to meet user goals.
-
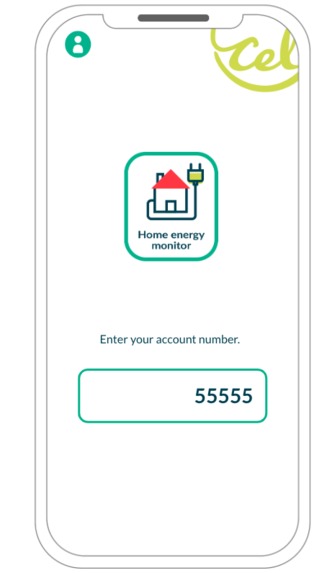
The user can connect device and data sources. Data used to improve load model & personalize suggestions. In future to control device.
-
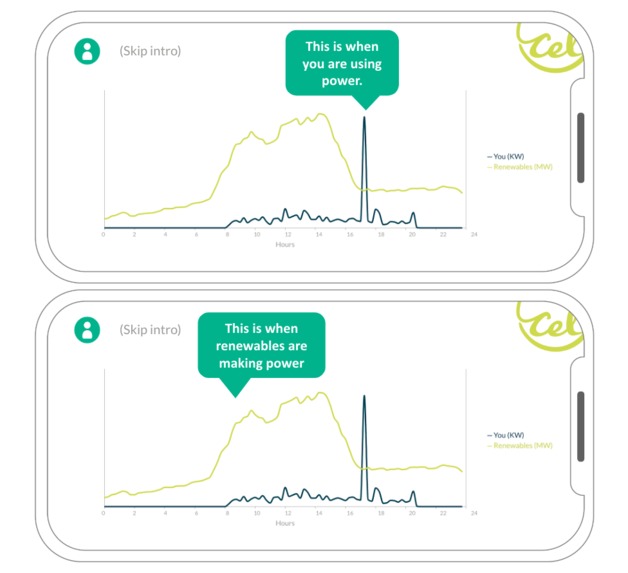
Save the Planet (first use) screen 1 : A quick visual intro to this choice path will instruct the user on the interface.
-
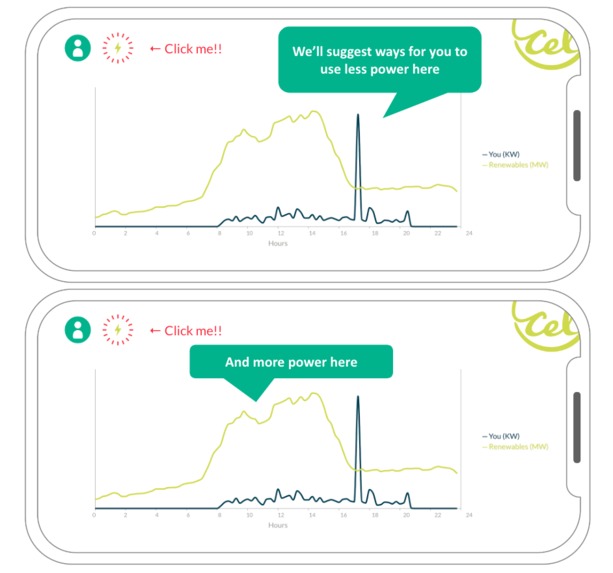
Save the Planet (first use) screen 2: A quick visual intro to this choice path will show where to find tips.
-
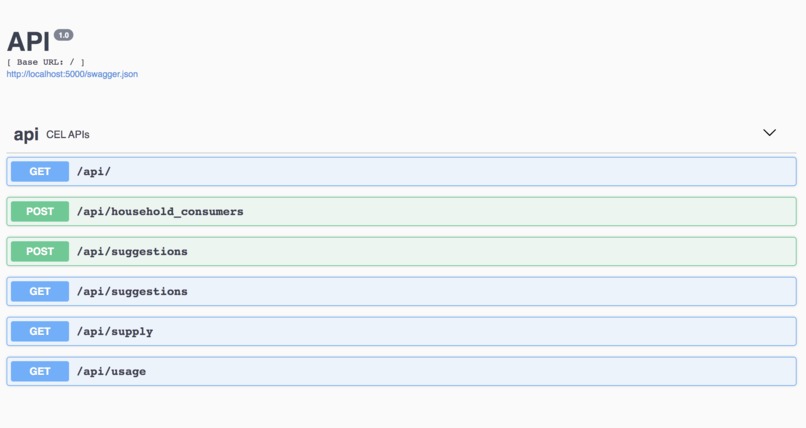
Backend API Integrations: This is live data, people!
-
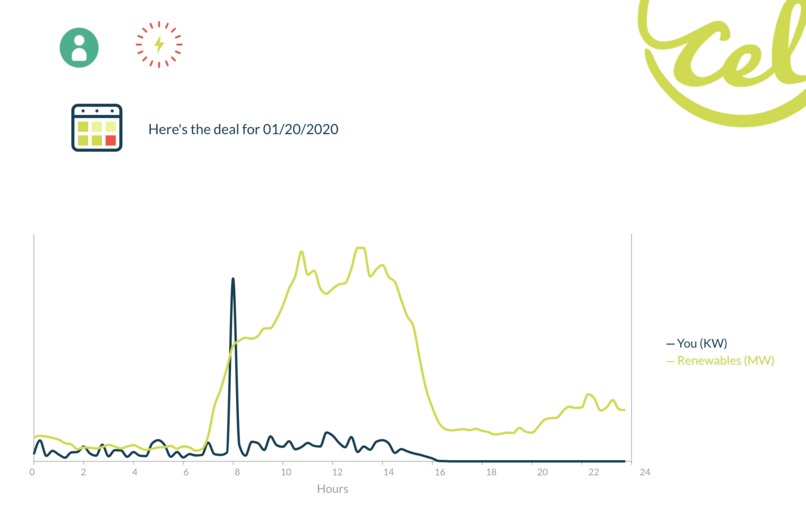
This is a screenshot of the live demo.
-
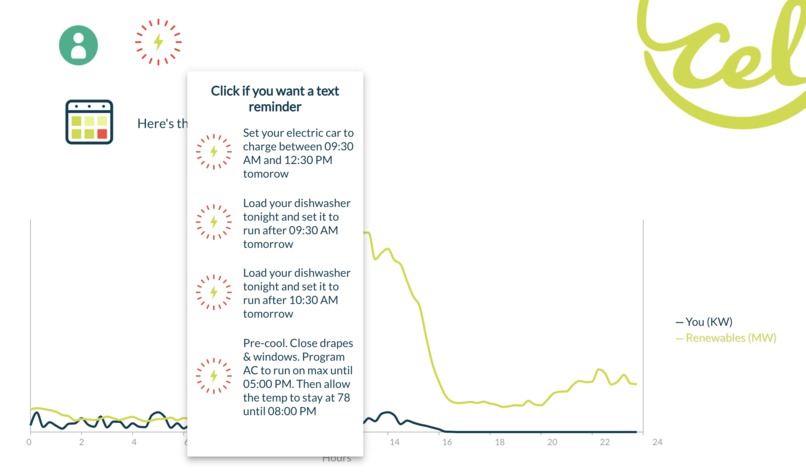
This is another screenshot of the live demo and dynamic suggestions.
-
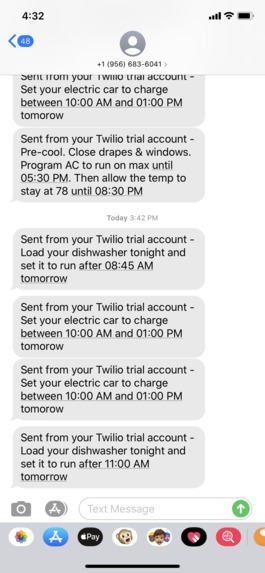
This is live texts. Our app was blowing up Maya's phone. She'll have the greenest house in Palo Alto (word up, Palo Alto Utilities)!
-
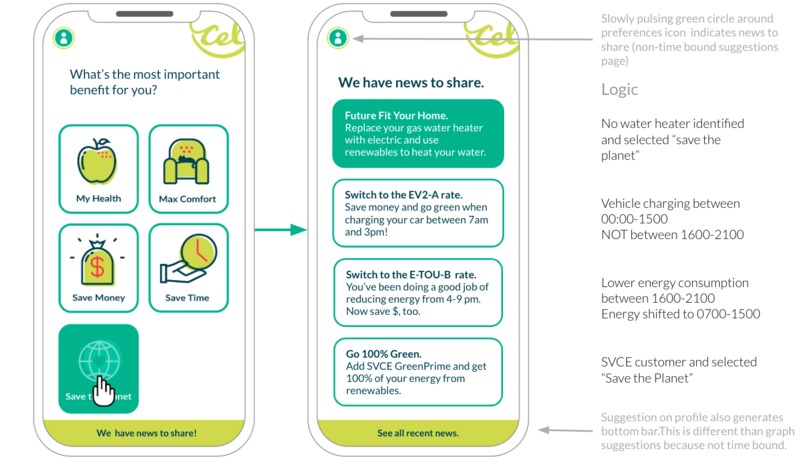
We didn't get a chance to use SVCE detailed API and Additional Data .csv to build but this was our next build cycle idea.
-
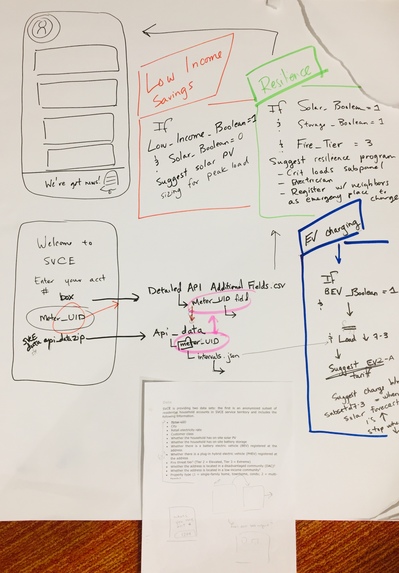
Too many ideas. Too little time. But here is how we were going to use SVCE data files for the second build.


Elevator pitch
Customers aren’t offered much choice in energy and when they are they often don’t have enough information to make the right choice (for example using energy when their solar panels are making it). We want to make the right choice the easy choice. We help customers make simple choices. Community Choice Explorer uses software and personalized data to do the hard work of sorting out the right products, services, tariffs and behaviors for customers based on their preferences.
Inspiration
Lack of customer choice is a problem in energy; however, the lack of choice has often been because customer choice and affordable, reliable grid operation have been at odds. According to a May 2018 MIT Technology Review article, "In April, California solar and wind farms shut down or dialed back nearly 95,000 megawatt-hours of electricity, a new record, according to the California Independent System Operator (CAISO), which manages the vast majority of the state’s electricity. That’s enough to power more than 30 million homes for an hour." Since the publication of the MIT article the CAISO has blown that statistic out of the water - more than doubling curtailment and shutting off 223,195 MWh of power in May of 2019. That's a lot of wasted renewable energy.
When there is too much energy coming onto the grid with no work to do (typically solar in the middle of the day when energy use is lower) grid operators have to turn off or turn down generators to avoid overloading the electrical system. Often customers are inadvertently making this problem worse by exporting their own solar energy when the grid is flush with renewables and then coming home and using energy in the evenings when the grid operator needs to use fossil fuel intensive resources to make enough energy to meet demand. While storage is one important way to address this, the most cost effective means to address the issue is getting people to use more energy when it's plentiful and cheap and use less when renewables are not as abundant.
Most customers are likely not aware of this tradeoff. You should not have to have a PhD in power systems engineering to make the right choice the easy choice. We wanted to make an app that would give users a chance to state their preferences (in this example we only had time to cover renewable energy but resilience, thrift and comfort are other possible choice paths) and use data to suggest behaviors, tariffs, programs and - in the future - controls that allow them to use smart devices in ways that would best meet their objectives without causing instability in power markets or the grid.
What it does
Our current build imports a user's load data via an interval data monitoring app and compares the users' energy usage to renewables forecasts from the CAISO. It tells the user what simple steps they can take tomorrow to use more renewable energy. Behaviors, services and products suggested are based on personalized user data, specifically: the user's main preference is to save the planet, the user's load data from a home energy monitoring device and (if we have time), the user having clicked/indicated that she owns an electric vehicle are all data points we used to populate our suggestions. Once the suggestions display the user can schedule a text reminder the next day to remind them to set their devices. In the future we would link up with CEL's LEEP product which would eliminate the need for the customer to have to manually program their loads - LEEP could control things like water heaters, heat pumps, EV's and any other smart devices to do what the suggestion suggests.
How we built it
Data/API/Integration
- Maya imported day ahead renewable energy supply forecasts for solar + wind from the California Independent System Operator OASIS API.
- Maya imported real time user load data from Tanya's SolarEDGE data monitoring API.
- Maya used python and flask to process the data sets, and create a rest API for the front end developers to pull the load and supply graphs.
- Maya ran basic data processing using python and flask on the supply and usage data to generate a list of basic suggestions (generated by Tanya) and pushed these out through a single suggestions end point and import date parameters from the front end.
- Maya and Tanya worked together to generate custom and appropriate suggestions for users based on forecasted supply and demand. For one of the suggestions Maya created a simple logic that dynamically suggested when the user should charge her car the next day during times where solar production was forecasted to be high (75% percentile). For another suggestion Maya created logic to dynamically suggest the user should pre-cool her home when solar production was forecasted to be high (75% percentile) and to then increase her cooling setpoint to 78 degrees during hours on the same day when renewable energy production is forecasted to rapidly decline.
Front end
- Greg and Zubair paired on all front end. They set up react, installed rechart libraries, react-datepicker, and began styling the UI/UX for all stylings Tanya provided.
- Worked with Maya to test the data picker and API functionality.
- Greg and Zubair got to work on making the suggestions function pull Maya and Tanya's suggestions and display properly. This was no small job.
Challenges we ran into
- The CAISO OASIS renewable day ahead dataset was displaying solar peak at 8 pm in the evening. We figured out this was a GMT/Timestamp issue and corrected. SVCE's Monica P also jumped in to help us out and put us in touch with their load scheduler (Kevin Coffee) who has experience with OASIS. Don Bray from SVCE gave us some awesome feedback about our customer suggestions for pre-cooling. Thank you.
- We didn't have the time to create a sophisticated day ahead demand curve for a single home. We could have used aggregated bulk meter data (the 3000 residential meters) or CAISO day ahead demand curves since we'd already figured out that API, but ultimately we felt those might misrepresent an individual user's load profile and smoothing curves and graphing turned out to be really time consuming. Additionally we'd rather show the customer's actual load curve (even if only historically) with REAL individual user data and say that in a real world application we would use AI for THAT USER's data, weather, loads selected, etc. in order to create an individualized demand curve.
- The files coming from data sources are all over the place - XML, CSV, Zip, etc. Processing these all with python in Flask in order to export them to our front end developers took a lot of futzing and was time consuming.
- We had major issues trying to override the default styling for chart axis labeling in recharts. We sunk a lot of time googling and found some community work arounds for the x axis, but the y and secondary y axis were so time consuming and complicated that we ultimately decided that labeling the axis with values was not going to deliver a lot of user value. The main point was to show the user trends and relationships. We did differentiate kW from MW in the legend for each plot line. Definitely something we'd fix in a real app.
- We wanted to do SO MUCH. It was challenging to try and pick one path and not build the most awesome functionality and get lost in the weeds. We started to use the SVCE "Detailed API Additional Fields" .csv file to identify a user with an EV, low income, etc.; then to pull their interval data from the api_data.zip directories and graph the interval json as our load curve; and then to pick the right programs, but it proved too much to do in a day. Still it was useful to look through the Utility API and csv data.
Accomplishments that we are proud of
We were all strangers before this hackathon. We had so much fun getting to know each other, quickly coming up with an idea, divvying up the work.
We still managed to build an actual usable demo that imported data from a real home monitoring device and the CAISO, used logic to load personalized suggestions based on the data, and sends a reminder to the user!!!
What we learned
Wow. So much. recharts was new to everyone and that took a lot of time to master.
Even though we were not able to use the SVCE data provided we learned a lot of about the Utility API, utility datasets, and CAISO developer kit.
What's next for Customer Choice Explorer (by Community Energy Labs)
We'd like to build out other user choice paths in the interface. We wish we had more time to work on the AI/Machine learning and customized day ahead load forecasts and suggestions. We'd love to keep working with these datasets in order to take our other choice paths (resiliency - monitoring battery state of charge against load; price - monitoring cost curves against load; etc.) to the next step and provide a useful tool for Customer Choice Energy!


Log in or sign up for Devpost to join the conversation.