-
-

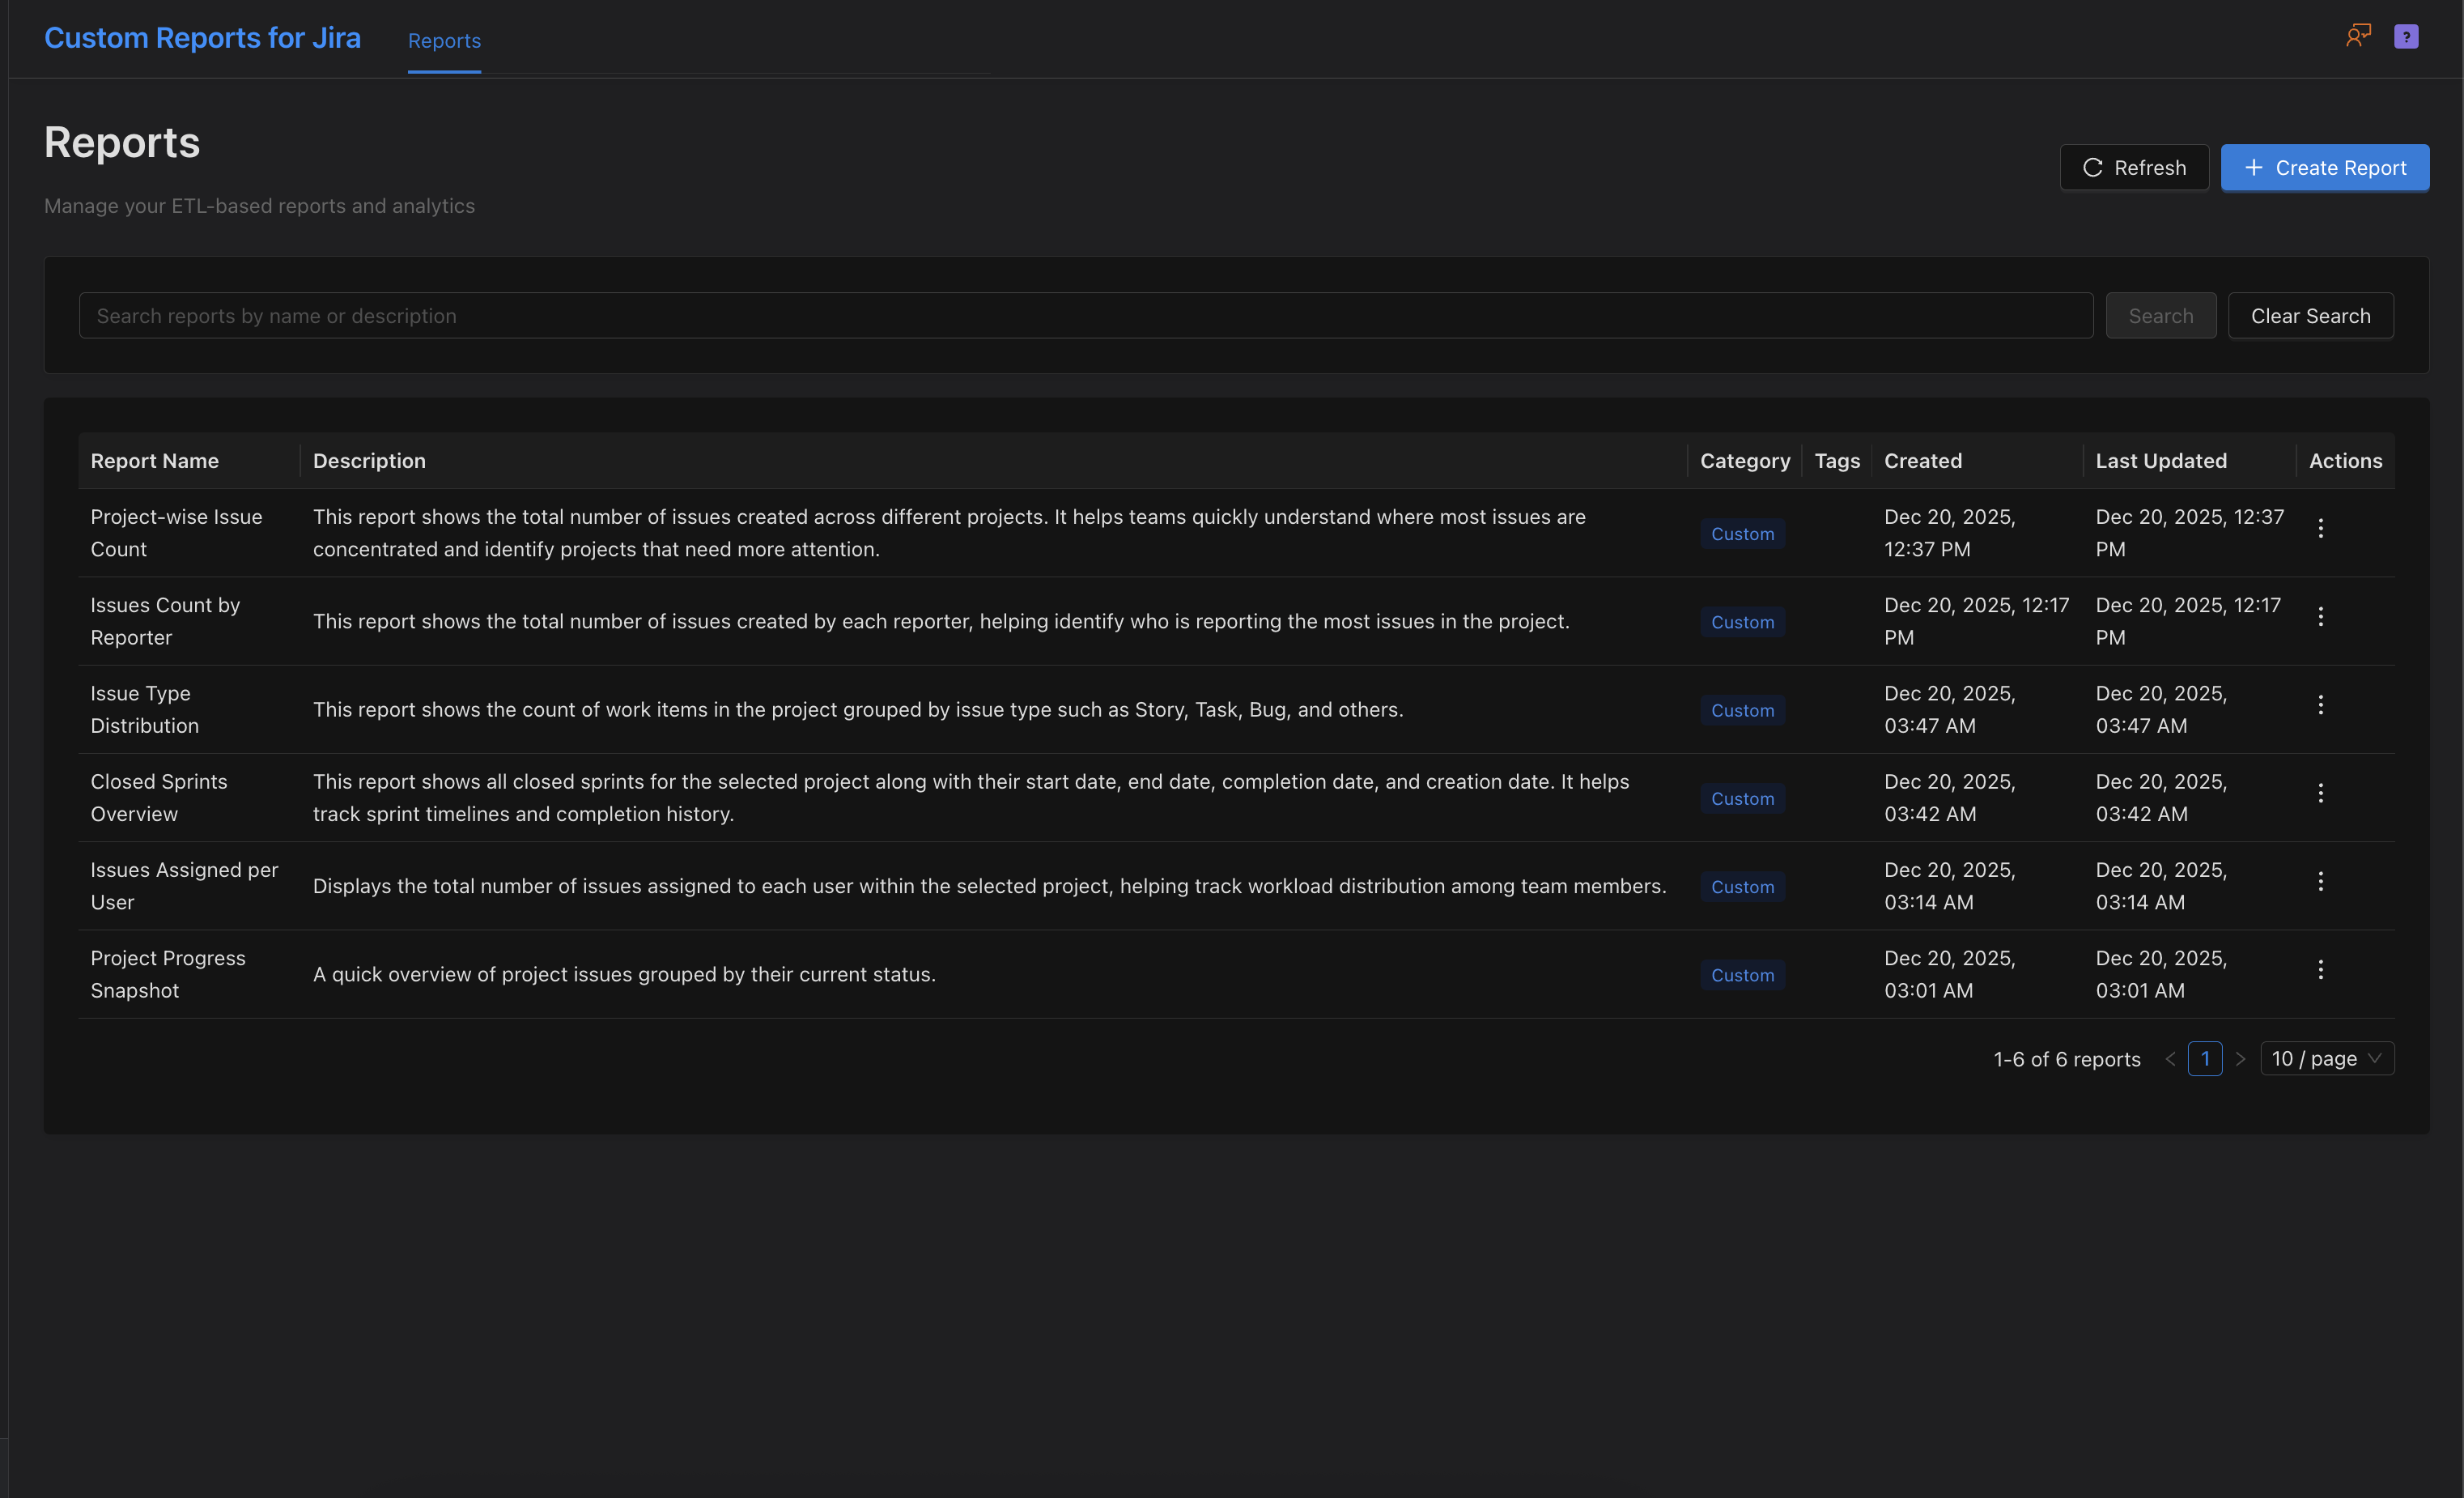
Custom Reports for Jira - Dashboard
-
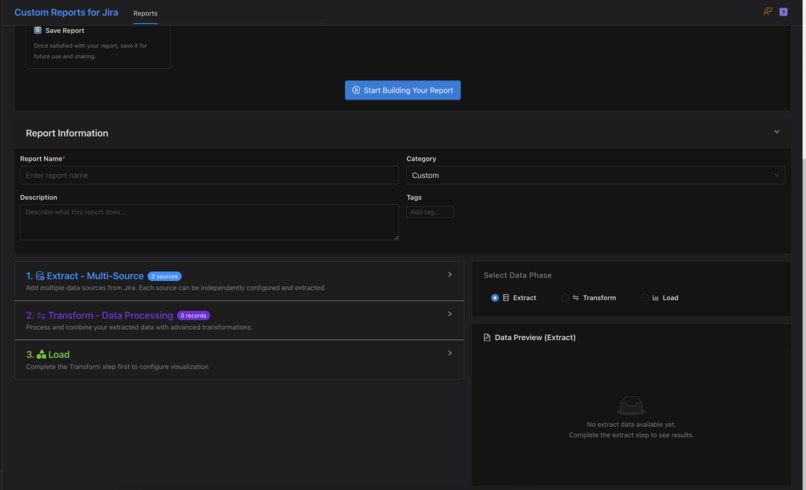
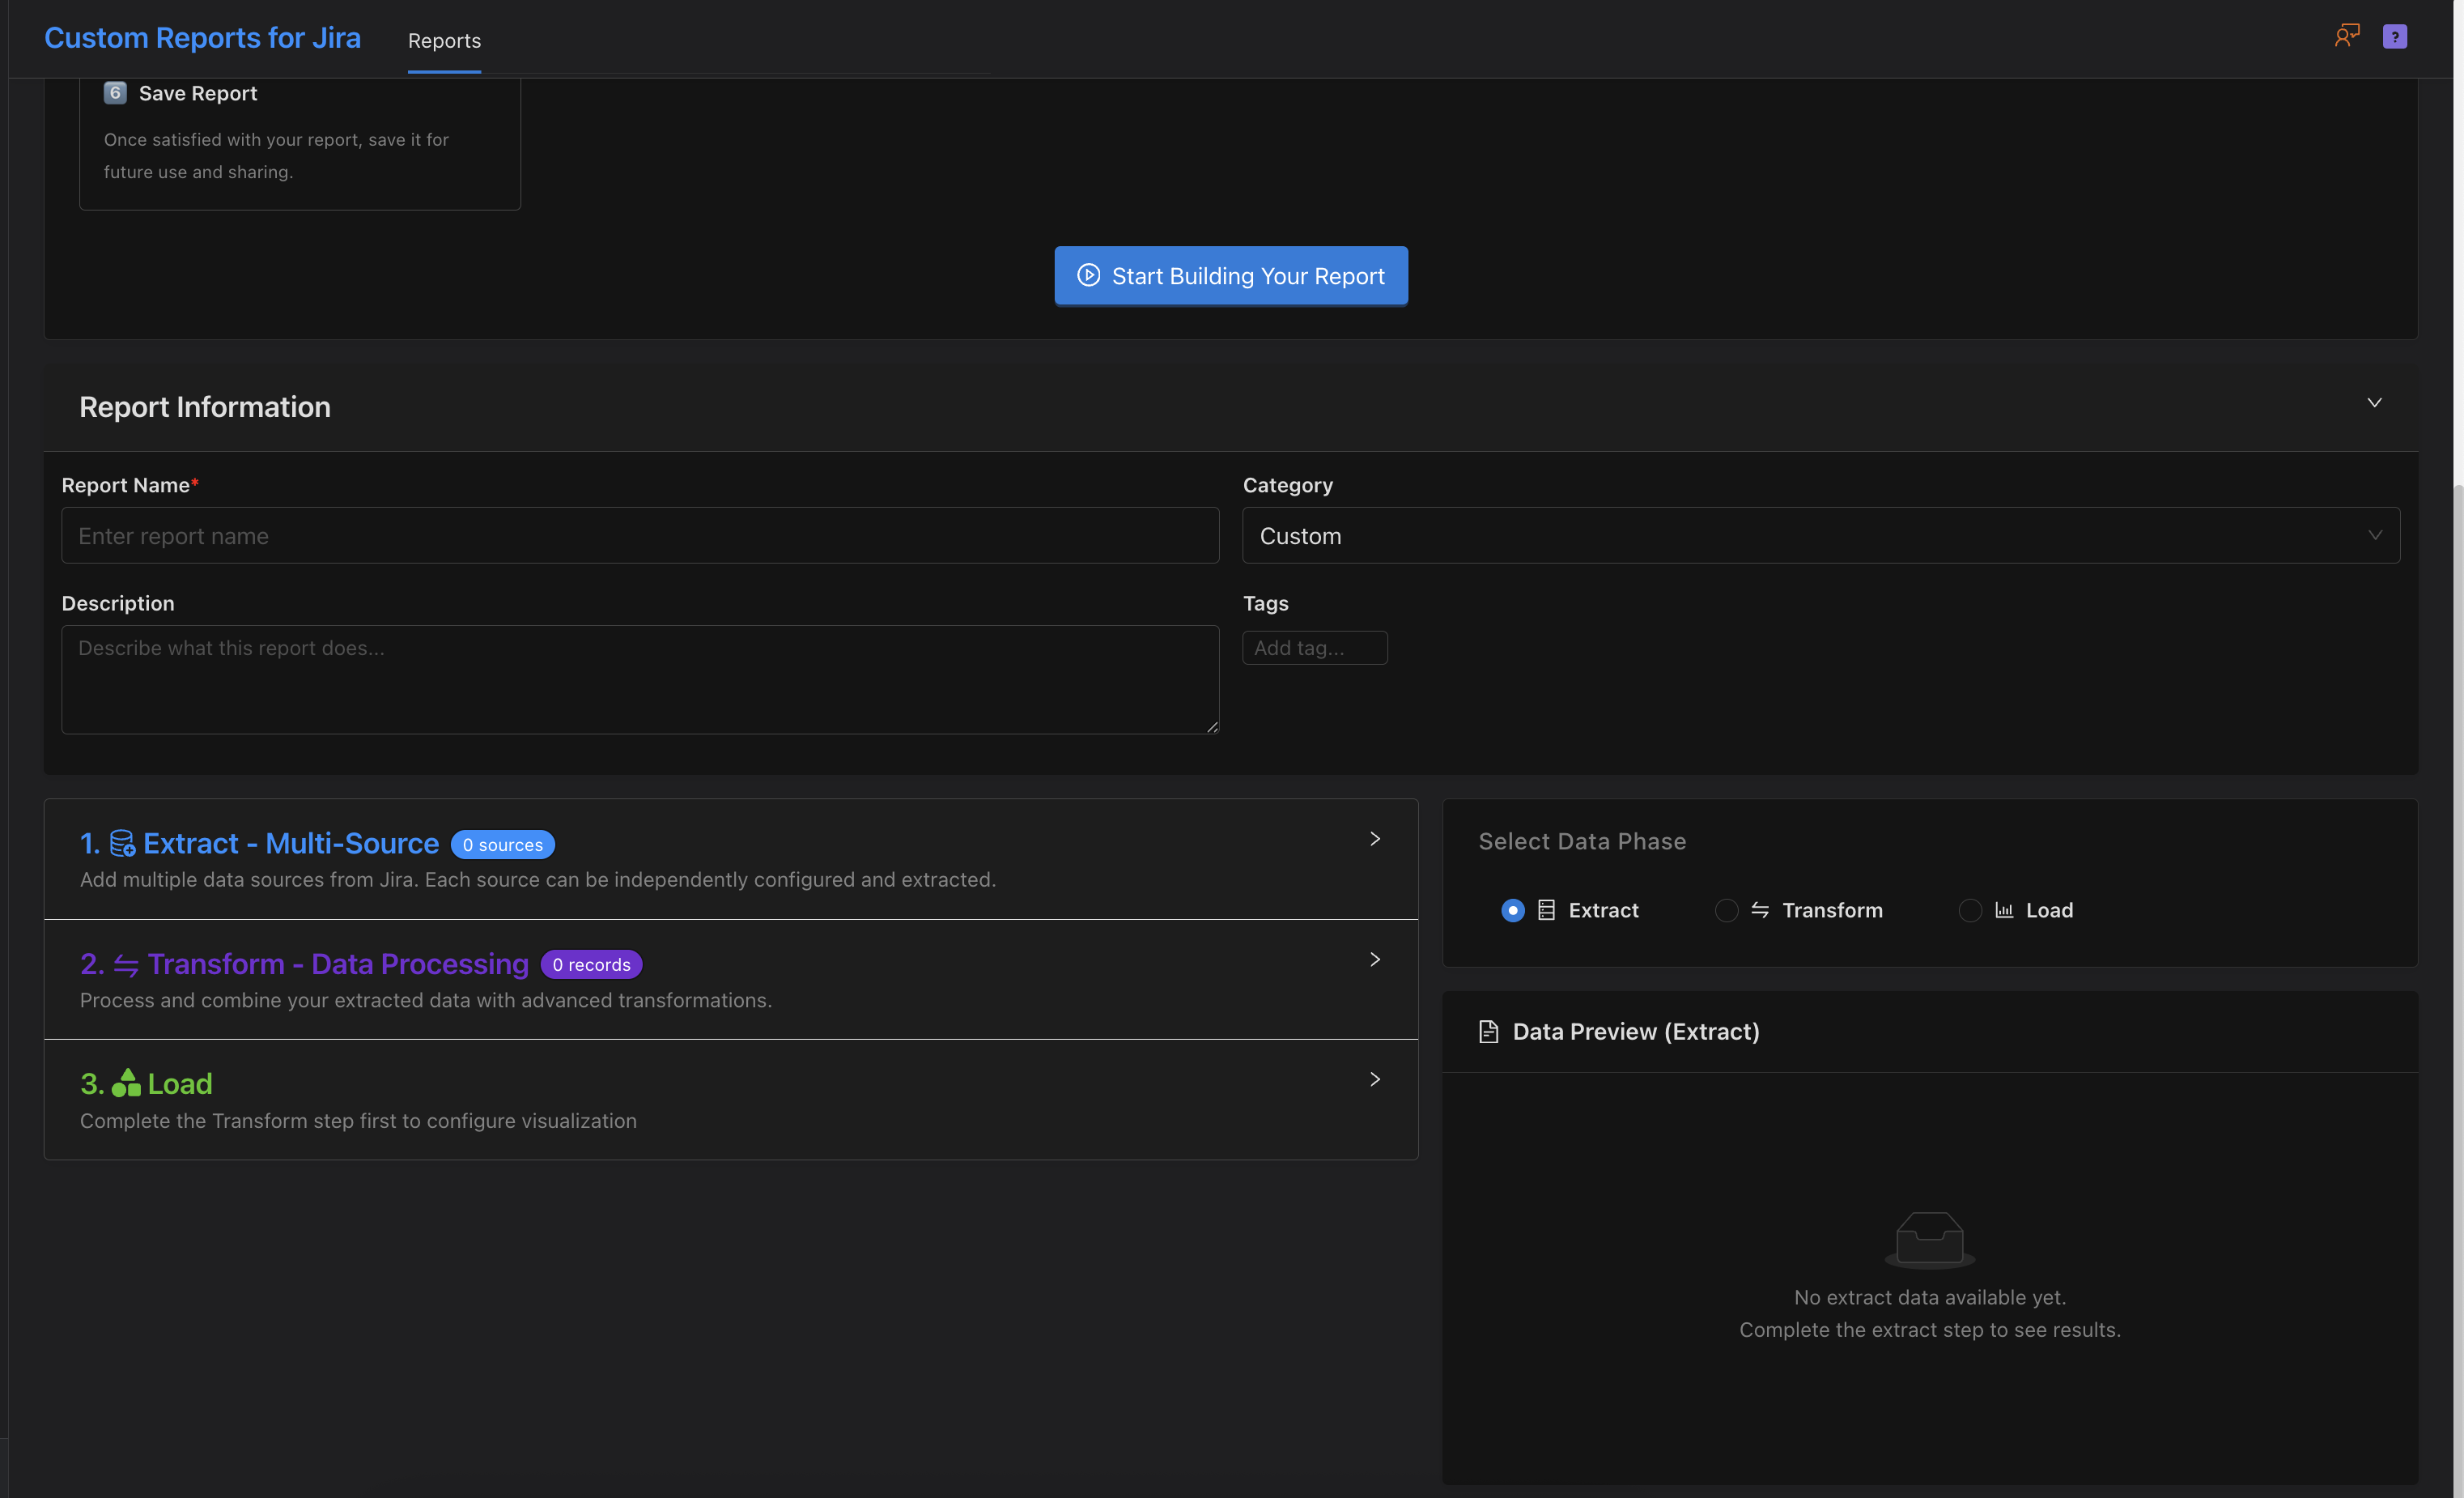
Create a new report page
-
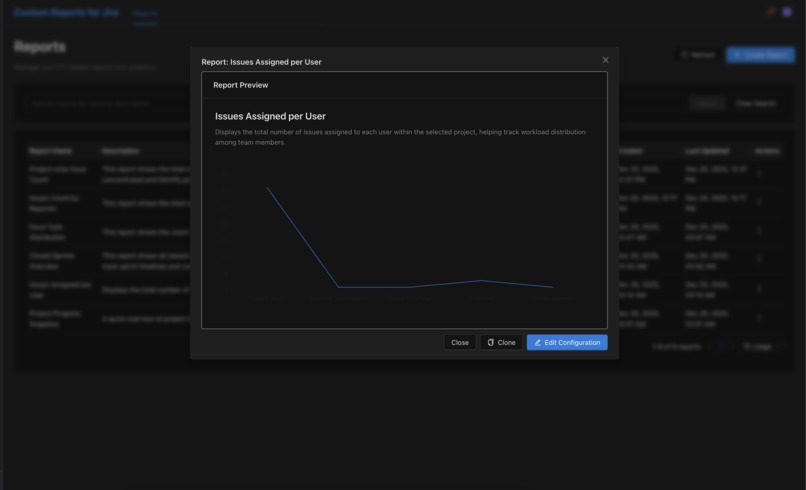
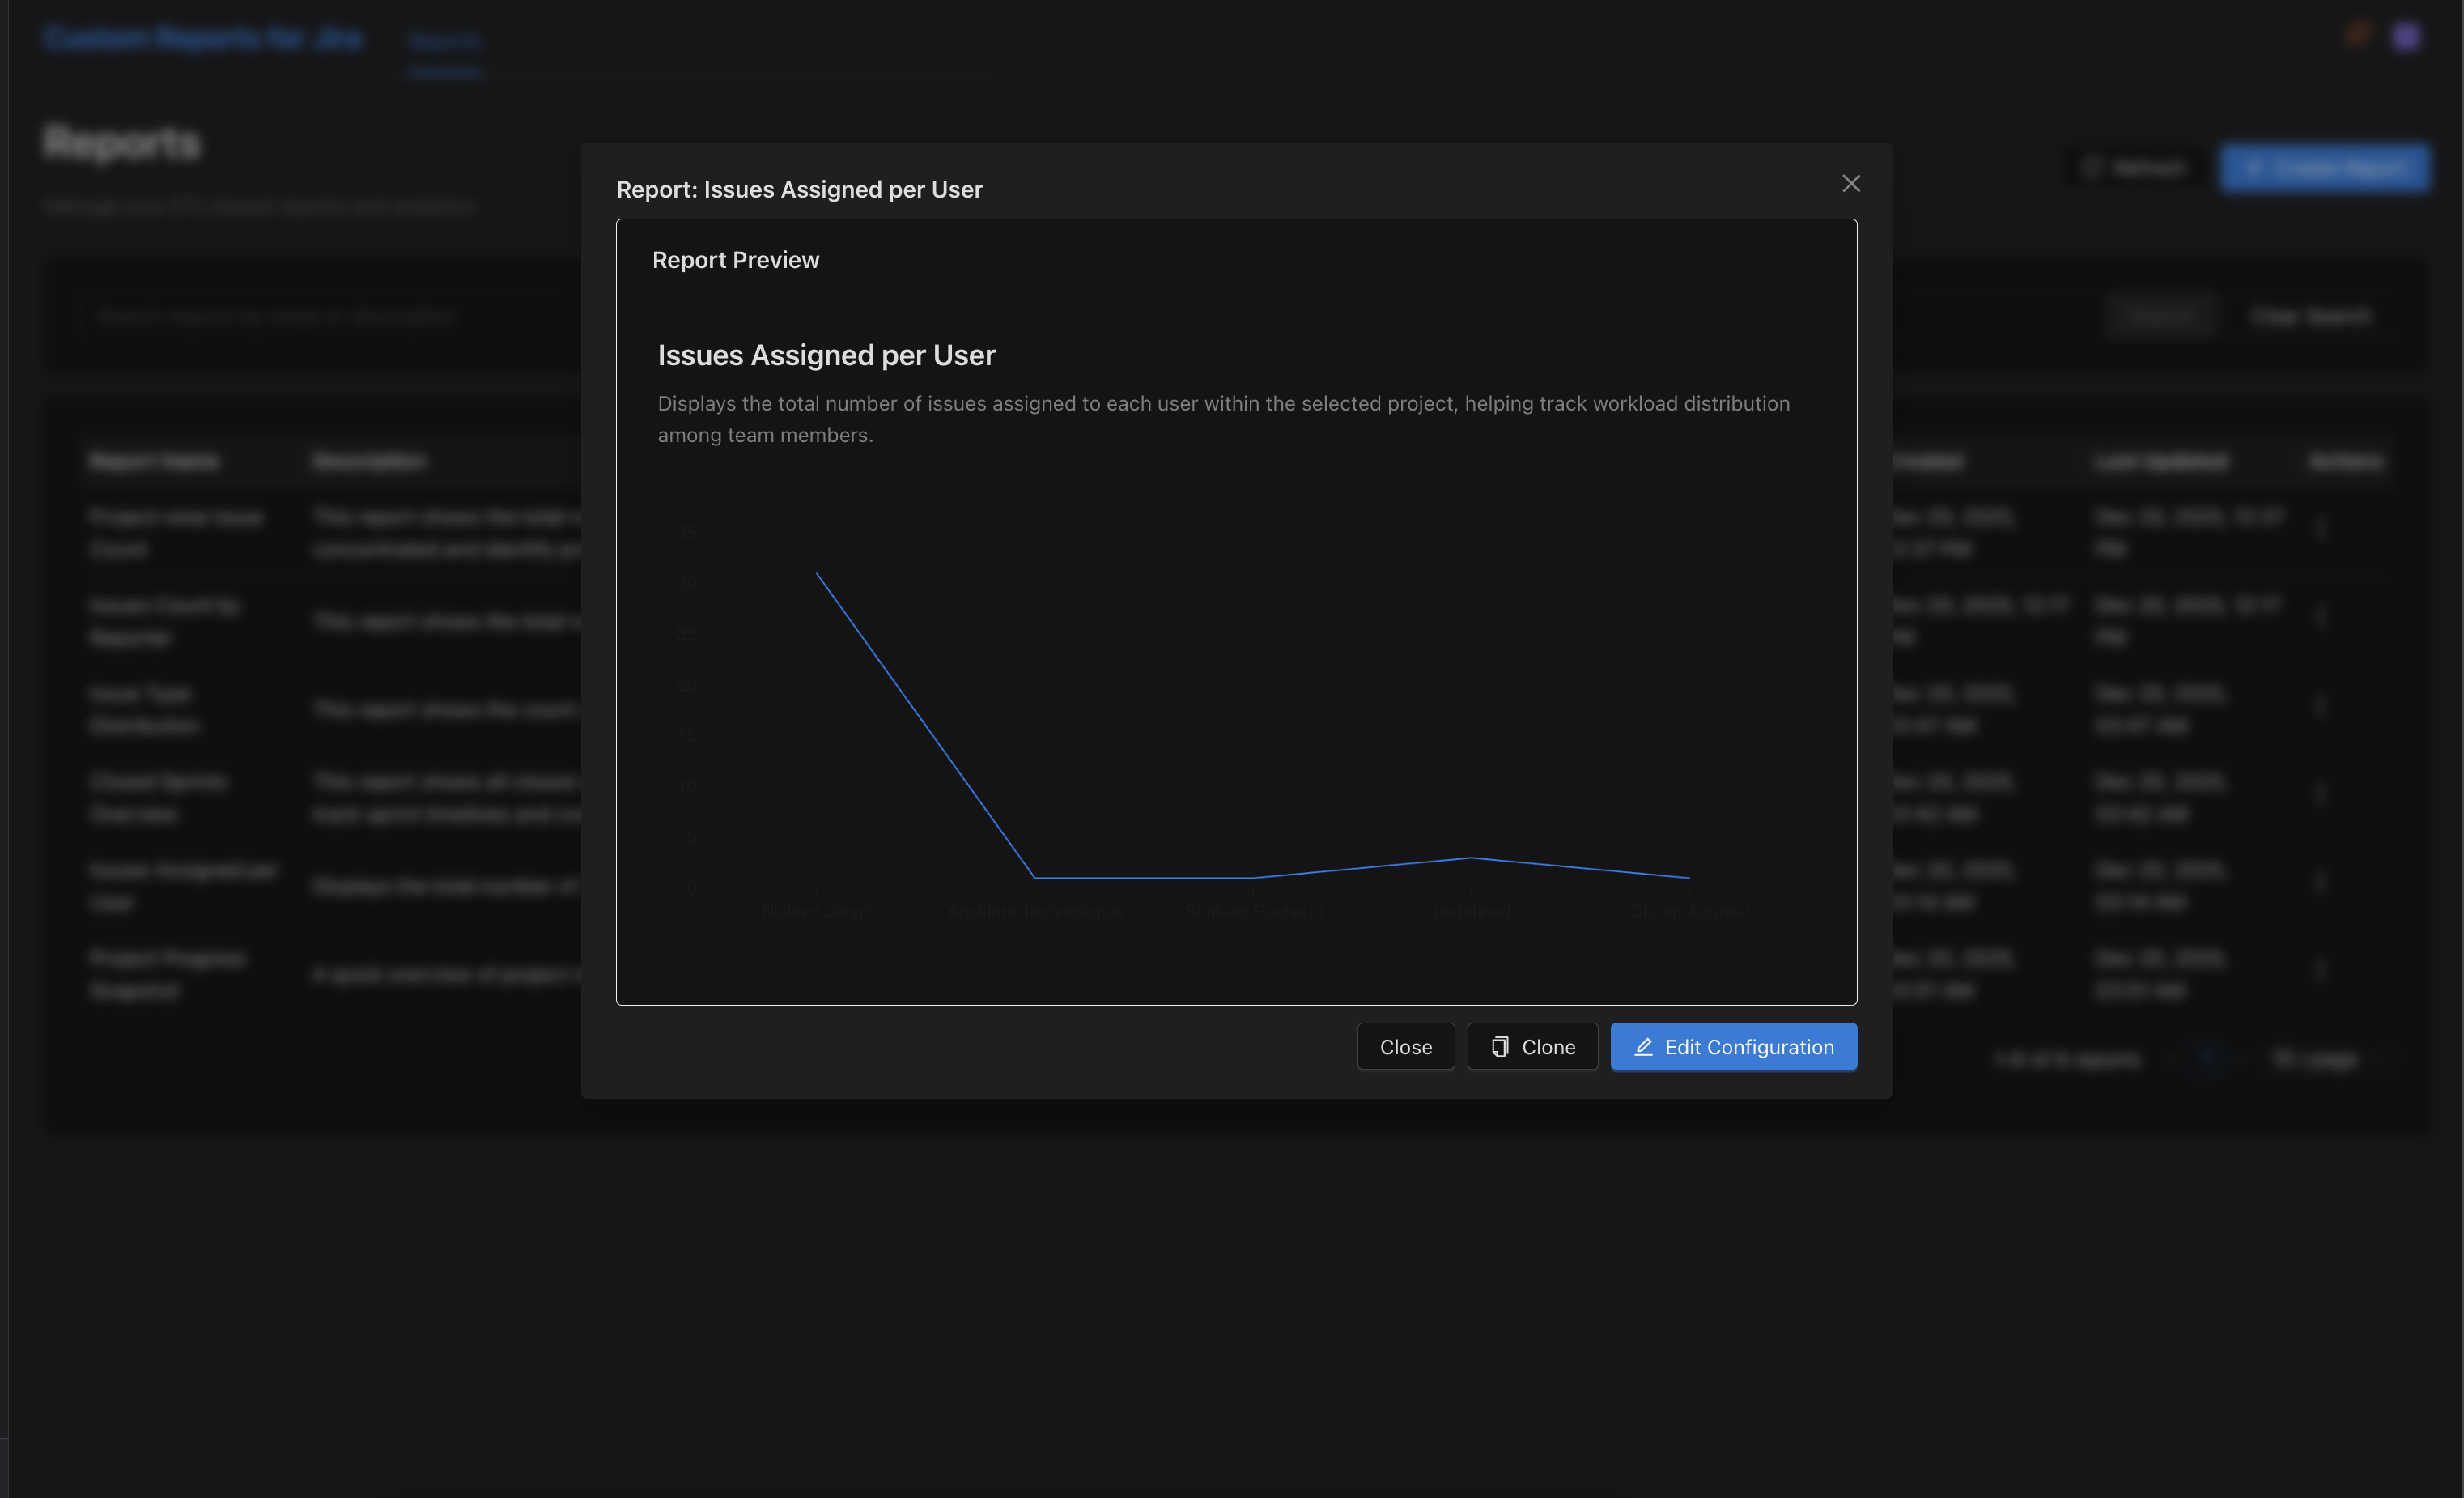
Quick glance at a report
-
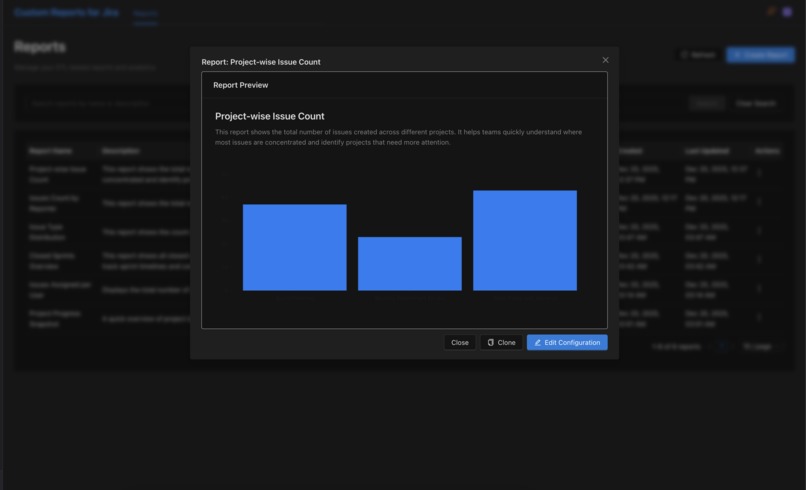
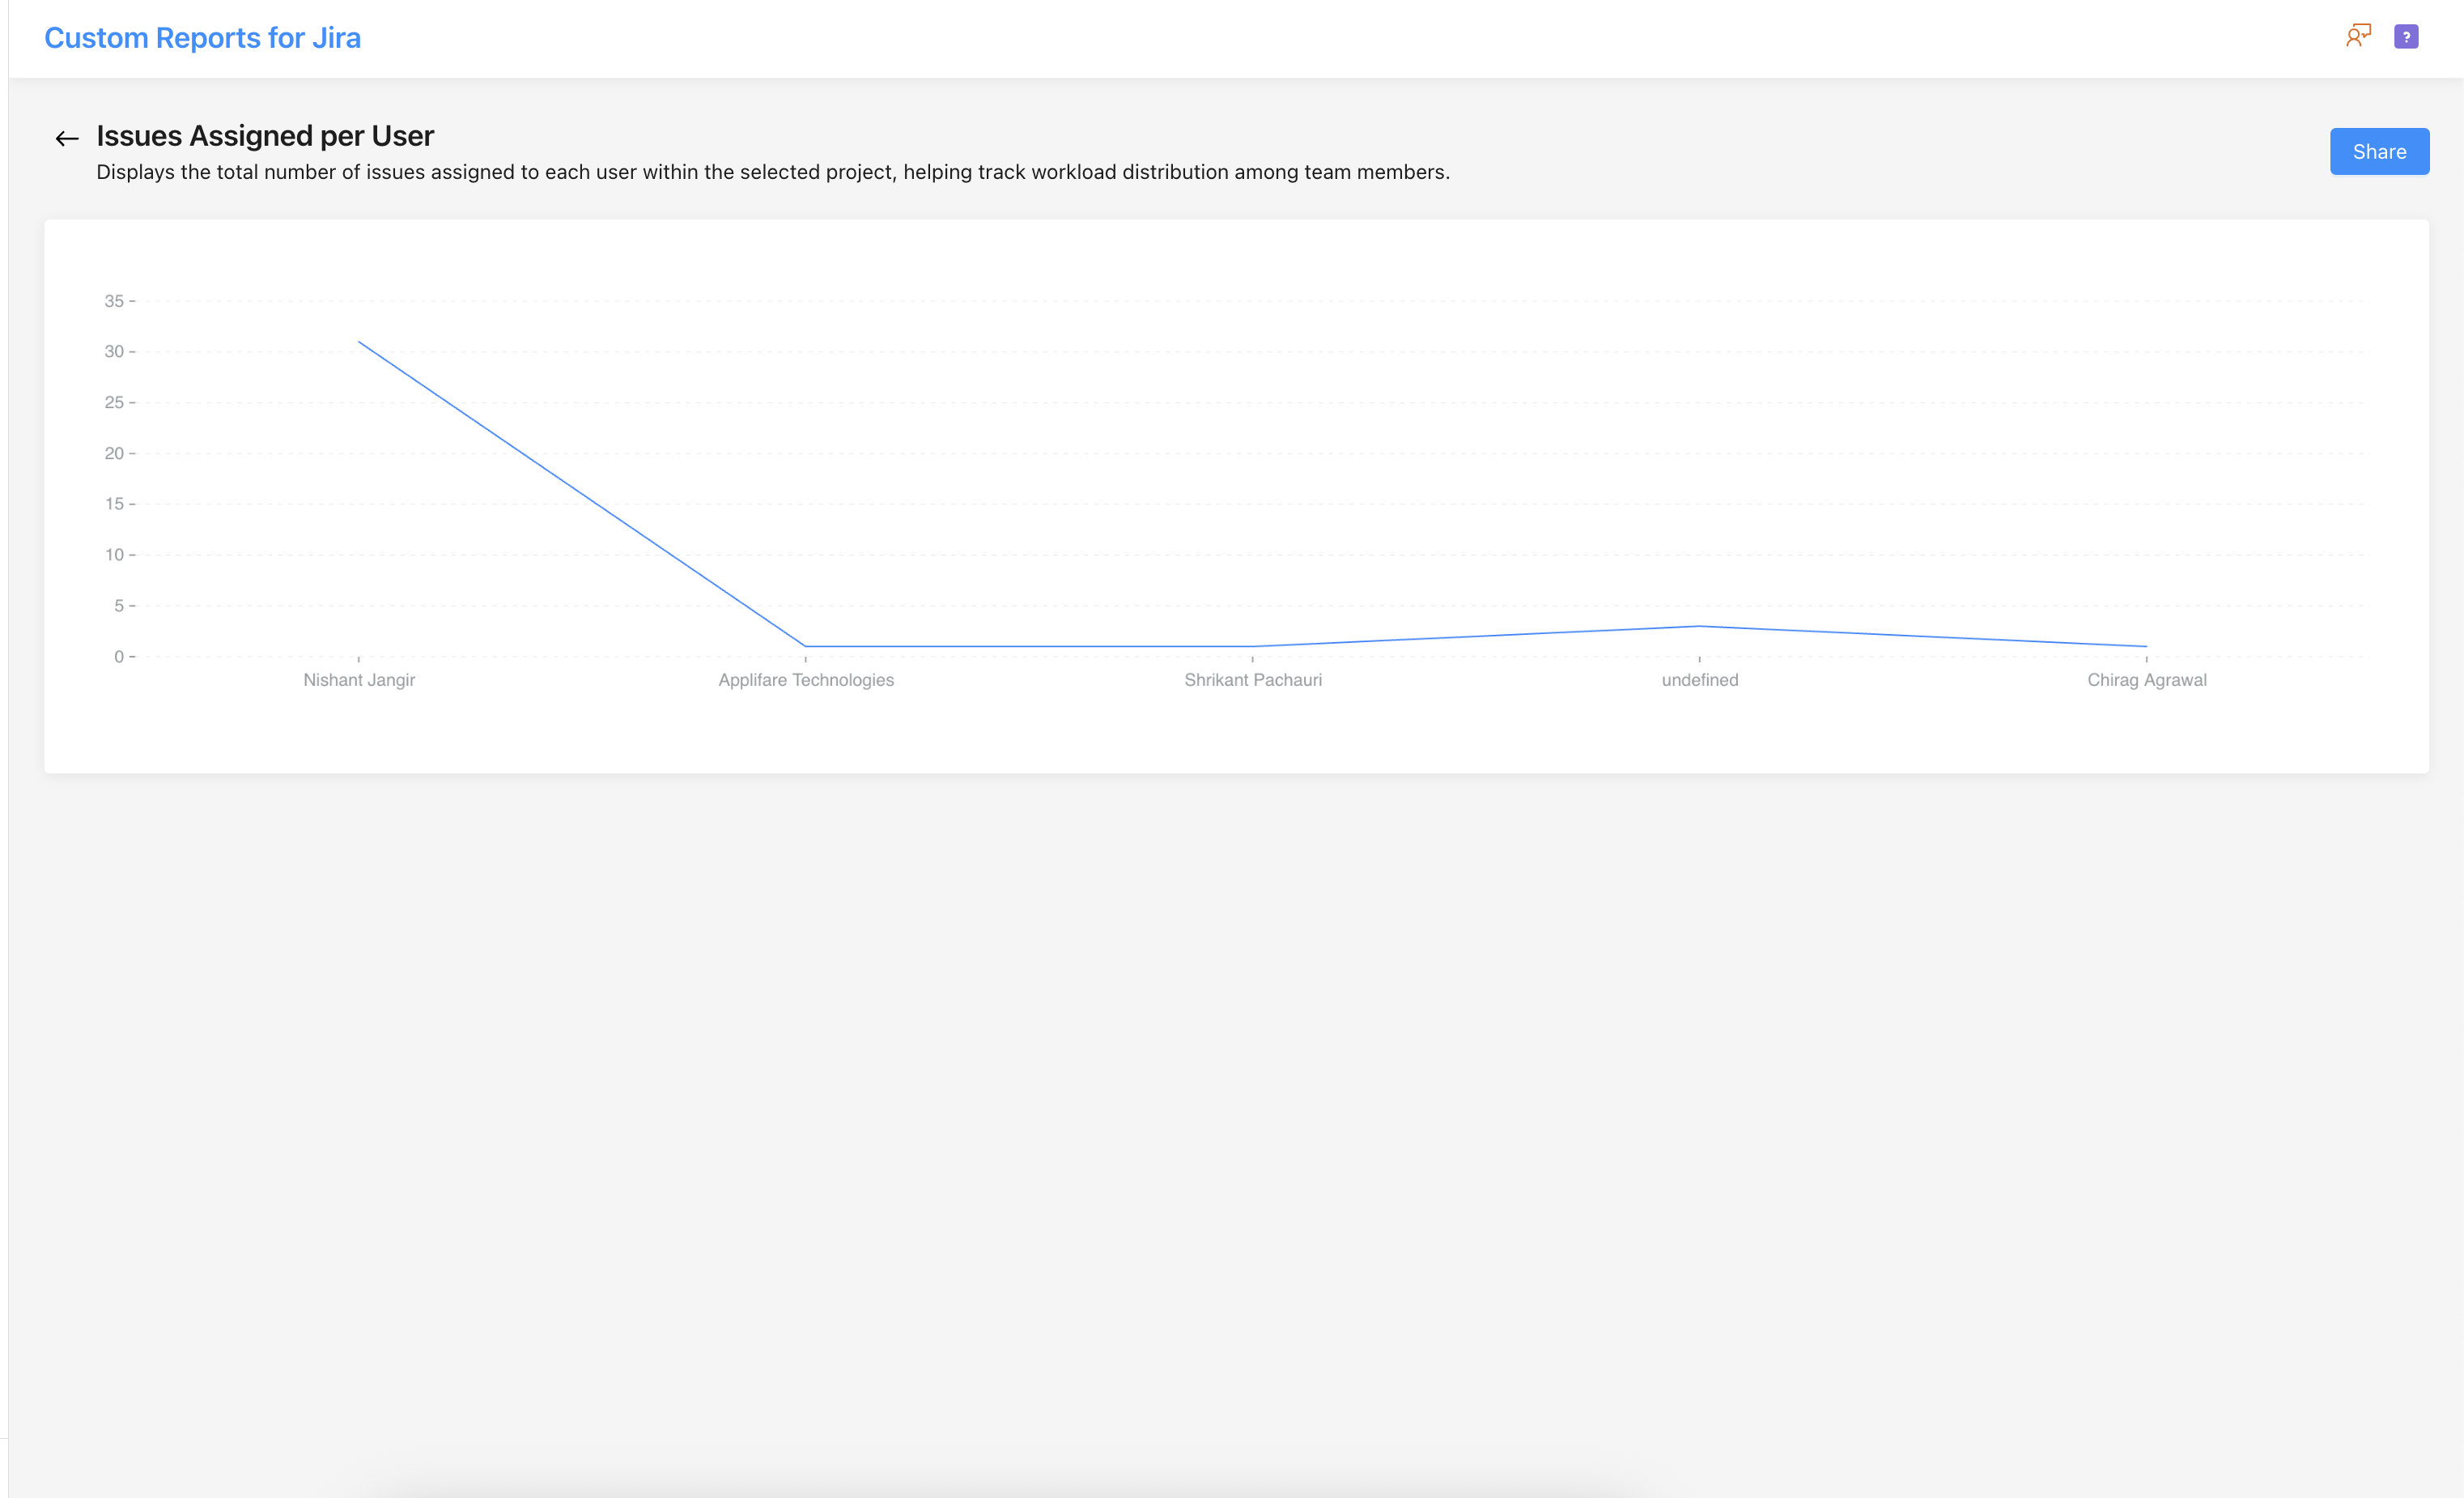
Quick glance at a report
-
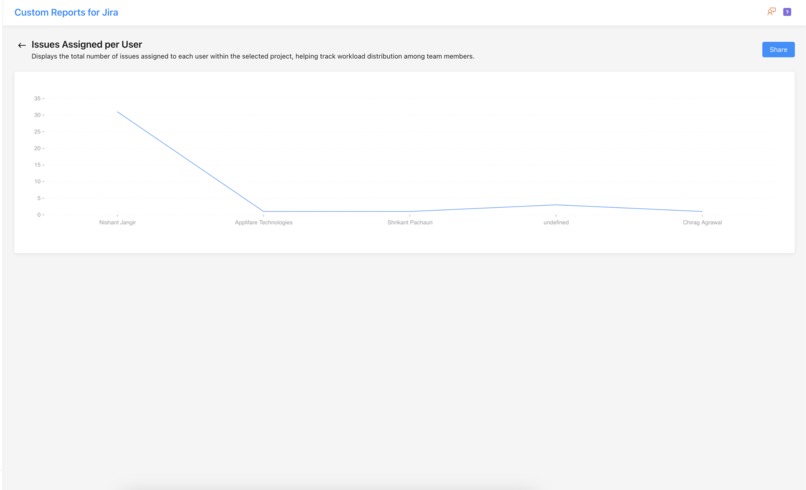
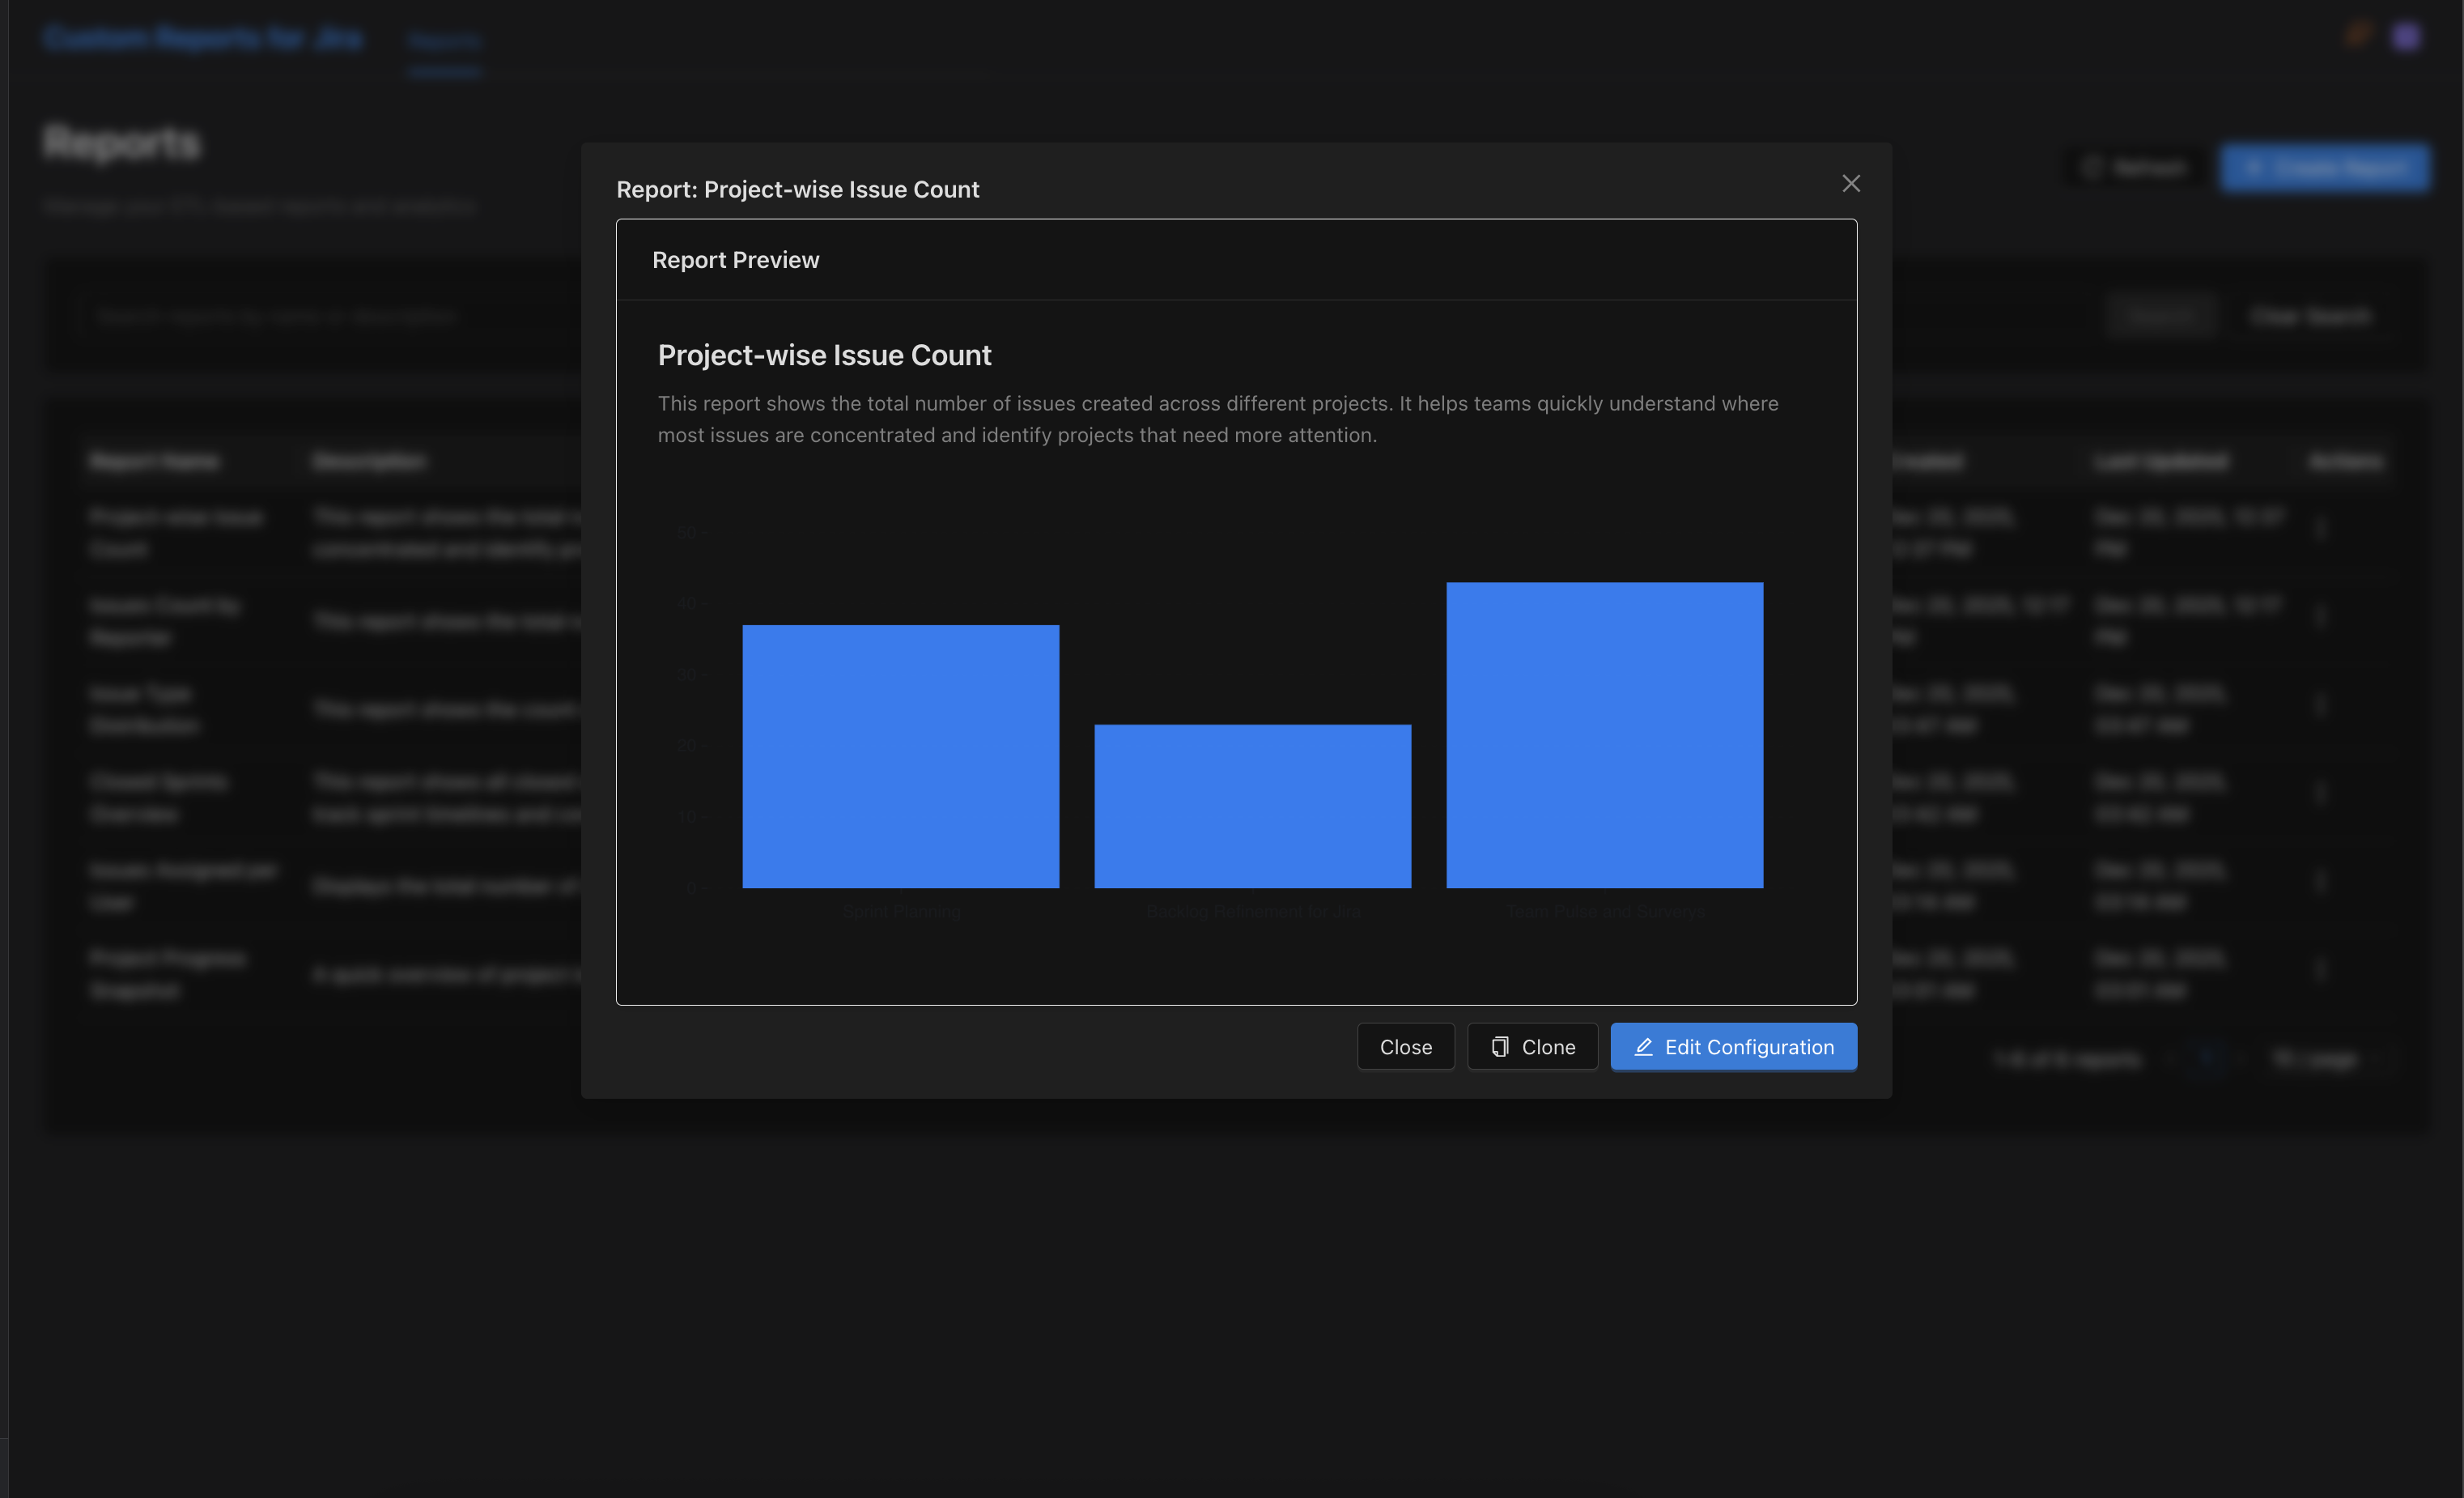
Full Page Report
Building the Custom Reports for Jira: A Development Story
🎯 The Inspiration
Every Jira user has experienced it: you need a specific report, but Jira's built-in reports don't quite cut it. Maybe you need to track story points by assignee across multiple projects, or visualize sprint spillover patterns, or create a custom pivot table of issue statuses. The options are limited:
- Jira's native reports: Too rigid, inconsistent across project types
- EazyBI: Powerful but complex, requires MDX knowledge and significant learning curve
- Custom Charts: Limited scope, can't handle complex transformations
- External BI tools: Require separate infrastructure, data exports, and maintenance
We asked ourselves: "What if teams could build any report they need, visually, without leaving Jira or learning complex query languages?"
That question sparked the creation of the Custom Reports for Jira — a Forge-native solution that brings enterprise-grade ETL (Extract, Transform, Load) capabilities directly into Jira with a no-code visual interface.
🧠 What We Learned
1. The Power of Forge Architecture
Building on Atlassian's Forge platform taught us that modern app development doesn't always need external servers. By leveraging:
- Forge SQL for persistent storage
- UI Kit for native Jira integration
- Forge Functions for serverless compute
- Automatic permission inheritance from Jira
We created a fully integrated experience that feels like a native Jira feature, not a bolt-on tool.
2. ETL Principles Apply to Every Data Problem
The classic ETL pattern (Extract → Transform → Load) isn't just for data warehouses. We learned that this paradigm perfectly fits reporting needs:
- Extract: Fetch data from Jira's REST API (issues, sprints, users, projects)
- Transform: Apply filters, aggregations, calculations, pivots, and joins
- Load: Render as tables, charts, calendars, or export formats
By making each stage configurable and visual, we democratized data transformation.
3. Expression Languages Are User-Friendly (When Done Right)
We implemented a custom expression evaluator that supports:
// Field calculations
storyPoints * 2;
timeSpent / 3600; // Convert seconds to hours

// Conditional logic
status === "Done" ? "Complete" : "In Progress";

// Array operations
labels.includes("backend") ? "Backend" : "Frontend";
This gave users spreadsheet-like power without requiring JavaScript knowledge. The key learning: provide good examples, clear error messages, and a live preview.
4. Progressive Disclosure Wins
Our initial designs were overwhelming. We learned to use a Quick Start Guide that progressively introduces:
- Select a dataset (Issues, Sprints, Users)
- Choose basic filters
- Add a simple visualization
- Unlock advanced features gradually
This reduced cognitive load and improved adoption.
🏗️ How We Built It
Phase 1: Foundation (Weeks 1-2)
Goal: Establish the Forge app structure and basic data flow
Key Decisions:
- Used Vite + React for the frontend (faster than Create React App)
- Chose UI Kit over Custom UI for better Jira integration
- Implemented Forge SQL with MySQL engine for report storage
- Set up automatic schema migrations on app install
Technical Stack:
Backend:
- Forge Functions (Node.js)
- Forge SQL (MySQL)
- Jira REST API integration

Frontend:
- React 18 + Vite
- Atlassian UI Kit (@forge/react)
- Chart.js for visualizations
- Monaco Editor for JSON/expression editing
Phase 2: Core ETL Pipeline (Weeks 3-5)
Goal: Build the visual ETL workflow engine
We created three key hooks:
useEtlPipeline.js: Manages basic Extract → Transform → Load flowuseAdvancedEtlPipeline.js: Adds joins, pivots, and multi-source extractionuseETLWorkflow.js: Orchestrates the entire workflow state
Key Components Built:
- AdvancedExtractPanel: Multi-source data extraction with JQL support
- AdvancedTransformPanel: Filter, aggregate, calculate, flatten, pivot operations
- LoadPanel: Multiple output formats (table, chart, export)
- DataShapeInspector: Real-time schema viewer showing available fields
- JsonPreviewPanel: Live preview of transformed data
Critical Learning: We initially tried to make everything fully visual, but discovered that power users wanted hybrid modes — visual for structure, code for complex expressions. The Monaco editor integration solved this.
Phase 3: Advanced Visualizations (Weeks 6-7)
Goal: Go beyond basic tables and charts
We implemented four specialized visualizations:
- Calendar Timesheet (
CalendarTimesheet.jsx)
- Month/week views of issue assignments
- Color-coded by status or priority
- Hover tooltips with issue details
- Hierarchical Tree (
HierarchicalTree.jsx)
- Epic → Story → Sub-task visualization
- Collapsible nodes with aggregate metrics
- D3.js-based interactive tree
- Pivot Table (
PivotTable.jsx)
- Drag-and-drop row/column configuration
- Multiple aggregation functions (sum, avg, count, min, max)
- Excel-like interface familiar to business users
- Timeline Gantt (
TimelineGantt.jsx)- Sprint timelines with issue dependencies
- Progress tracking with completion percentages
- Drag-to-adjust durations (view-only in v1)
Challenge: These components needed to handle thousands of issues without freezing the browser. Solution: Virtual scrolling and pagination.
Phase 4: Storage & Persistence (Week 8)
Goal: Allow users to save and share reports
We implemented:
- Report definitions stored in Forge SQL with full ETL configuration
- Views (Dashboards) that combine multiple reports
- Export capabilities (CSV, JSON) for external analysis
- URL-based navigation for shareable report links
Schema Design:
CREATE TABLE reports (
  id INT PRIMARY KEY AUTO_INCREMENT,
  name VARCHAR(255),
  description TEXT,
  etl_config JSON,  -- Complete ETL pipeline definition
  visualization_type VARCHAR(50),
  created_by VARCHAR(255),
  created_at TIMESTAMP
);

CREATE TABLE views (
  id INT PRIMARY KEY AUTO_INCREMENT,
  name VARCHAR(255),
  layout JSON,  -- Dashboard layout configuration
  report_ids JSON  -- Array of report IDs to include
);
Phase 5: Polish & UX Refinement (Weeks 9-10)
Goal: Make the app production-ready
Improvements Made:
- Added loading states and error boundaries
- Implemented "Quick Start Guide" for first-time users
- Created example reports (Sprint Velocity, Burndown, Assignee Workload)
- Added field validation and helpful error messages
- Implemented responsive design for smaller screens
- Added keyboard shortcuts for power users
- Created comprehensive documentation
💪 Challenges We Faced
Challenge 1: Forge UI Kit Limitations
Problem: Forge UI Kit is not full React. You can't use standard HTML elements like <div>, <span>, or <strong>. Only UI Kit components are allowed.
Solution:
- Built a mental model: "Think in UI Kit components, not HTML"
- Created a component mapping guide (e.g.,
<div>→<Box>,<strong>→<Strong>) - Discovered there's NO
<Table>component — must use<DynamicTable>instead
Code Example:
// ❌ This breaks the app
<div className="container">
  <strong>Total: {count}</strong>
</div>

// ✅ This works
<Box>
  <Strong>Total: {count}</Strong>
</Box>
Challenge 2: Handling Large Datasets
Problem: Fetching 10,000+ issues from Jira could take minutes and freeze the UI.
Solution: Implemented a multi-pronged approach:
- Pagination: Fetch data in chunks of 100 issues
- Progress indicators: Show real-time progress during extraction
- Background processing: Use Web Workers for heavy transformations
- Smart caching: Cache API responses for 5 minutes
- Lazy loading: Only fetch data when needed
Before/After:
- Before: 10,000 issues took 120 seconds, UI frozen
- After: 10,000 issues in 15 seconds, UI remains responsive
Challenge 3: Permission Management
Problem: Users should only see issues they have access to, but checking permissions for thousands of issues is slow.
Solution: Leverage Forge's built-in permission model:
- Use
.asUser()for all API requests (not.asApp()) - Jira automatically filters results based on user permissions
- No need for manual permission checks
- Trusted the platform to handle security
Key Insight: This is where Forge truly shines — automatic permission inheritance without extra code.
Challenge 4: Deployment & Tunneling Workflow
Problem: Understanding when to redeploy vs. when to rely on tunneling was confusing.
Solution: Established clear rules:
- Manifest.yml changes: Must redeploy + reinstall (if scopes change)
- Code changes during tunnel: Hot-reloaded automatically
- Production deployment: Always deploy + verify with
forge lint
Lesson Learned: Always run forge lint before deploying to catch manifest syntax errors early.
Each panel only updates its portion of state, preventing cascading re-renders.
🎓 Key Takeaways
Start with the problem, not the technology: We could have built this with Custom UI or external servers, but Forge UI Kit was the right choice for Jira integration.
Progressive enhancement beats feature dumps: The Quick Start Guide made adoption 10x easier than showing all features at once.
Expression languages need great DX: Live preview, syntax highlighting, and clear errors turned a potential nightmare into a superpower.
Visualization matters: A good chart tells a story instantly. We invested heavily in making data beautiful, not just functional.
Trust the platform: Forge's permission model, storage, and deployment tools saved us months of custom infrastructure work.
Puns make everything better: "Let's Forge ahead!" never gets old. ⚒️
🚀 What's Next
The app is production-ready, but we have exciting ideas for v2:
- AI-powered report suggestions: "Based on your Jira data, we recommend these reports..."
- Scheduled report delivery: Email reports daily/weekly
- Custom connectors: Pull data from Confluence, Bitbucket, external APIs
- Template marketplace: Share report templates with the community
- Real-time dashboards: Auto-refresh for live metrics
- Advanced permissions: Field-level security and role-based access
🙏 Acknowledgments
This project was made possible by:
- Atlassian Forge Documentation: Comprehensive and well-maintained
- The Forge Community: Quick support on the forums
- Our beta testers: Invaluable feedback on UX and features
- Chart.js & D3.js: Making beautiful visualizations accessible
📝 Conclusion
Building the Custom Reporting App taught us that simplicity at the surface can hide immense complexity underneath. By abstracting away the technical details of ETL pipelines, Jira API quirks, and data transformations, we created something that feels effortless to use.

Log in or sign up for Devpost to join the conversation.