🌟 What Inspired Us
The inspiration for Curiosity Graph came from observing how traditional research methods often lead to linear, isolated discoveries. We noticed that breakthrough innovations typically happen at the intersection of different fields, yet most research tools don't facilitate this cross-pollination of ideas.
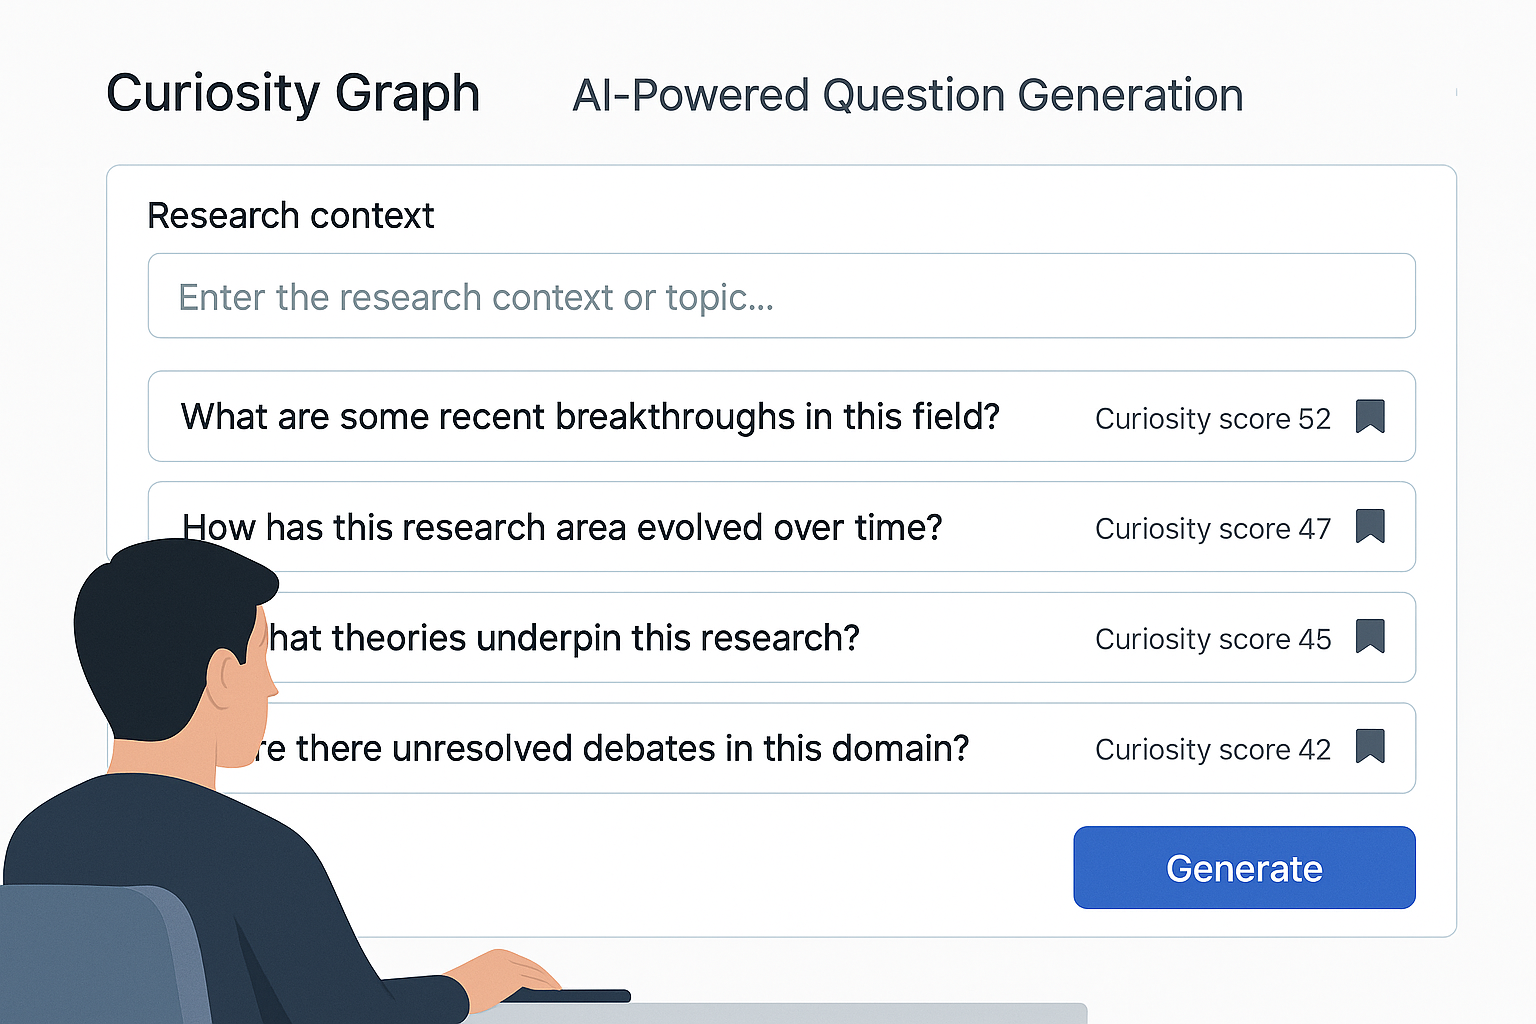
We were inspired by the concept that curiosity is the engine of discovery - but what if we could amplify human curiosity with AI? What if we could visualize the connections between ideas in real-time and generate questions that push the boundaries of conventional thinking?
The vision was to create a platform that doesn't just answer questions, but generates better questions - turning research from a solitary activity into an interactive journey of discovery.
🎓 What We Learned
Technical Learnings
- Advanced Graph Theory: Implementing community detection algorithms, centrality measures, and dynamic graph visualization
- Production-Grade Architecture: Building scalable systems with proper authentication, caching, and real-time capabilities
- AI Integration: Working with Perplexity's Sonar models for real-time research and implementing confidence scoring algorithms
- Complex State Management: Handling real-time updates across multiple components while maintaining data consistency
Research Insights
- Question Quality Matters: We discovered that the quality of questions significantly impacts research outcomes - our curiosity scoring algorithm identifies questions that lead to more meaningful discoveries
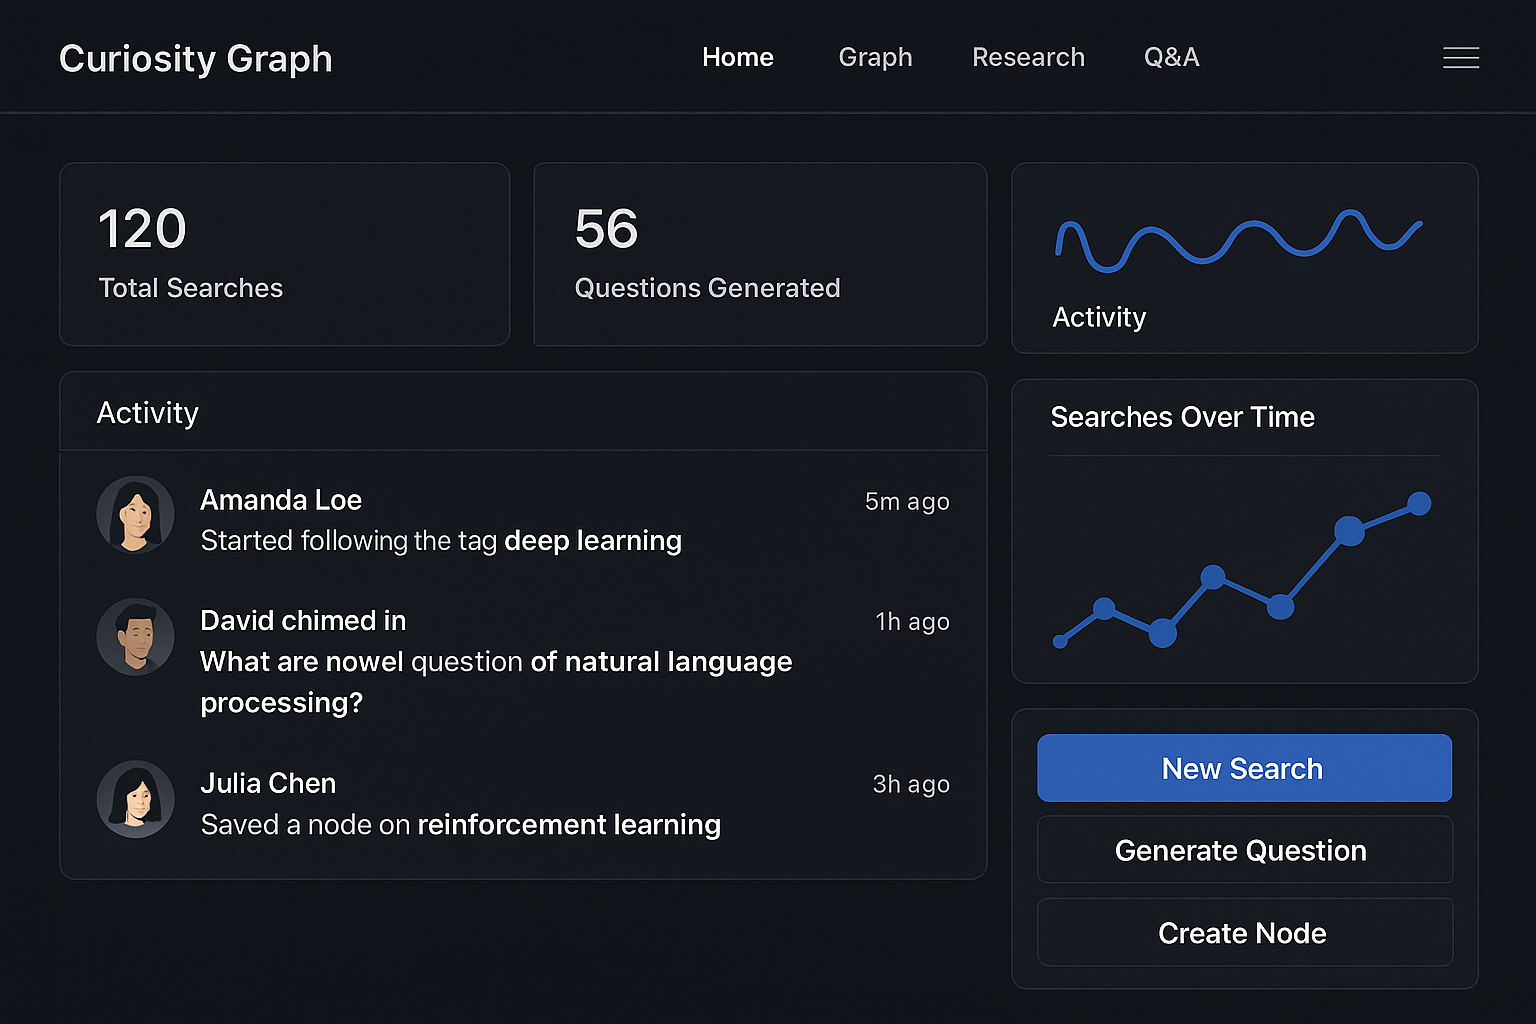
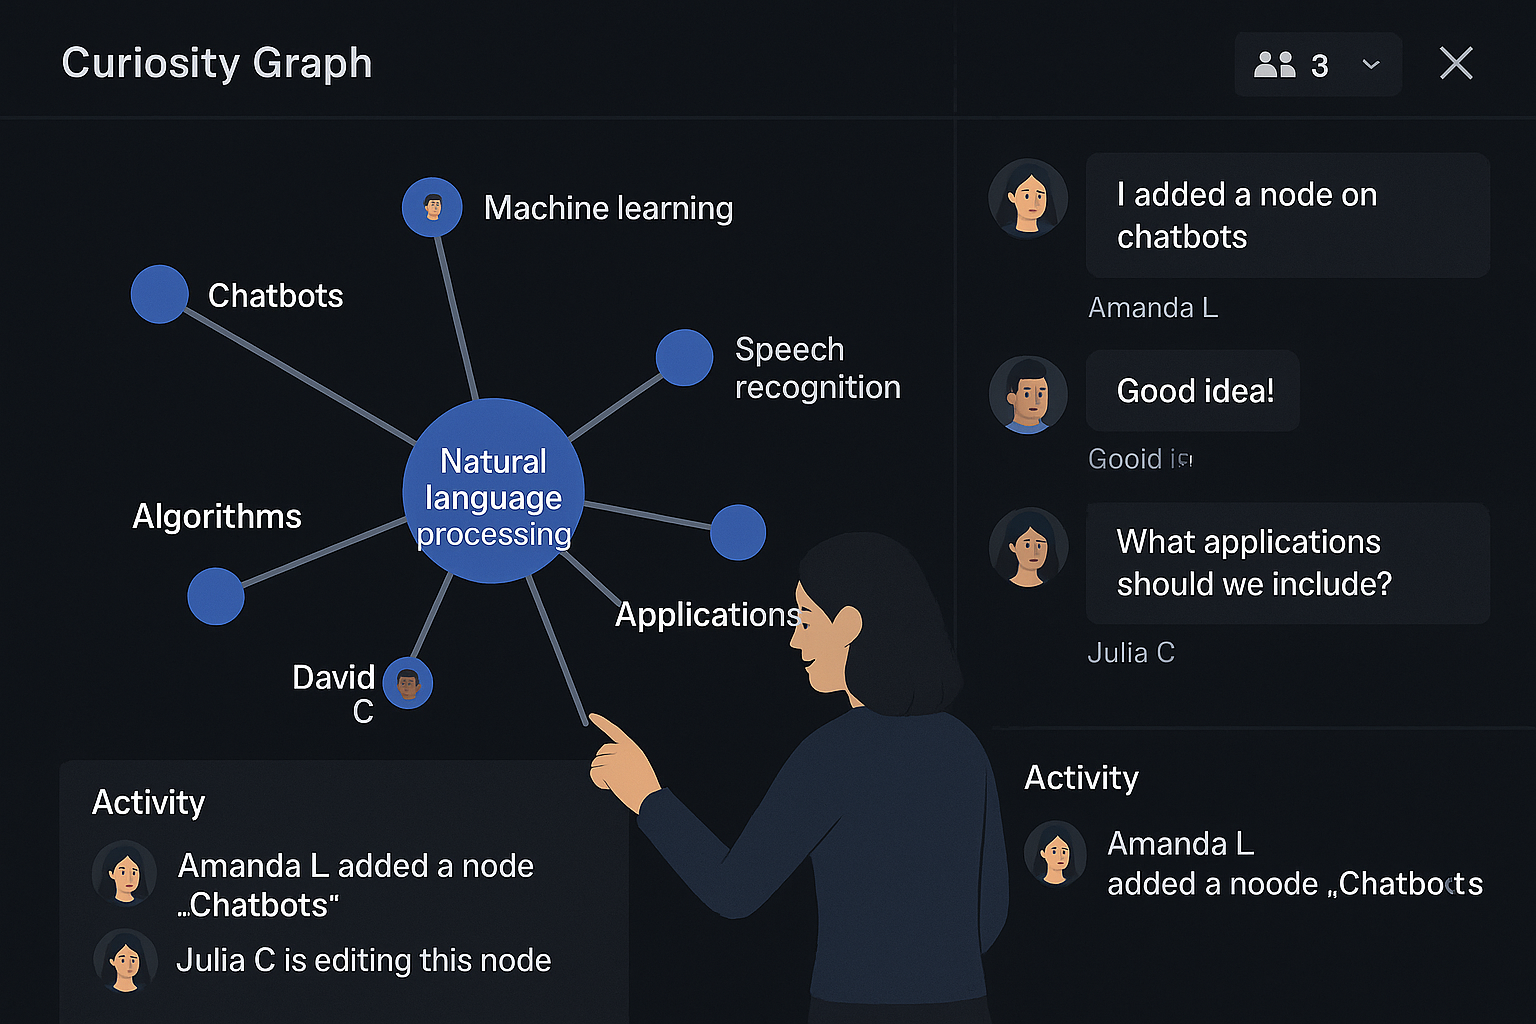
- Visual Learning: Knowledge graphs dramatically improve comprehension and reveal hidden connections that text-based research misses
- Iterative Discovery: The best research happens through iterative questioning rather than single queries
User Experience Lessons
- Progressive Disclosure: Complex features need to be introduced gradually to avoid overwhelming users
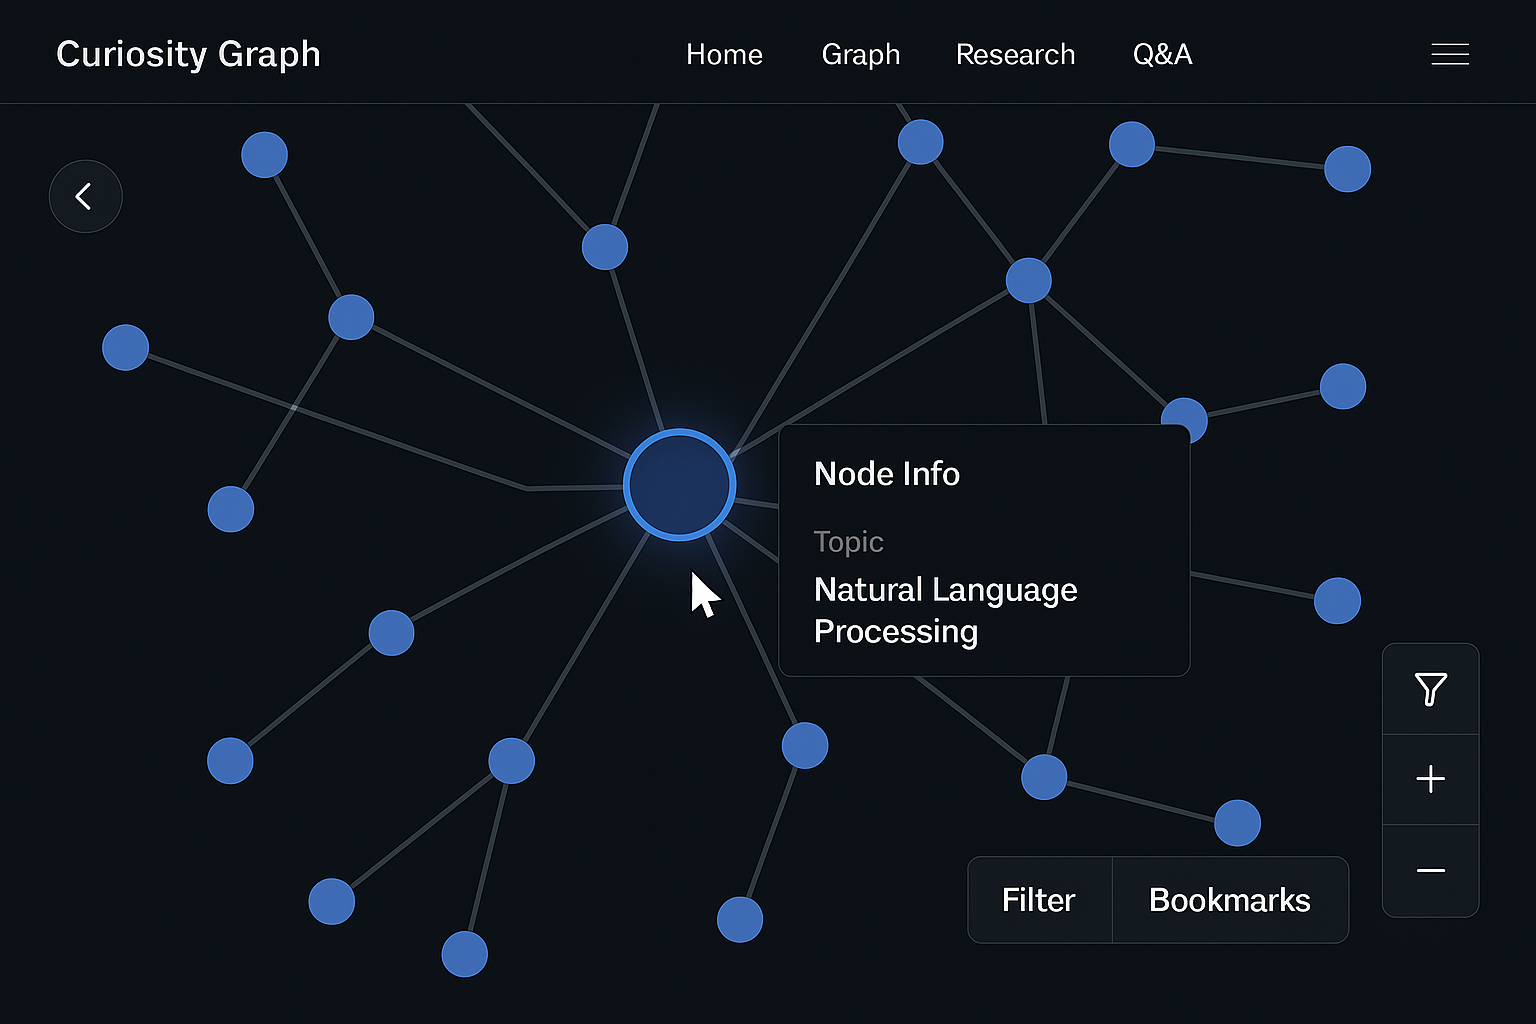
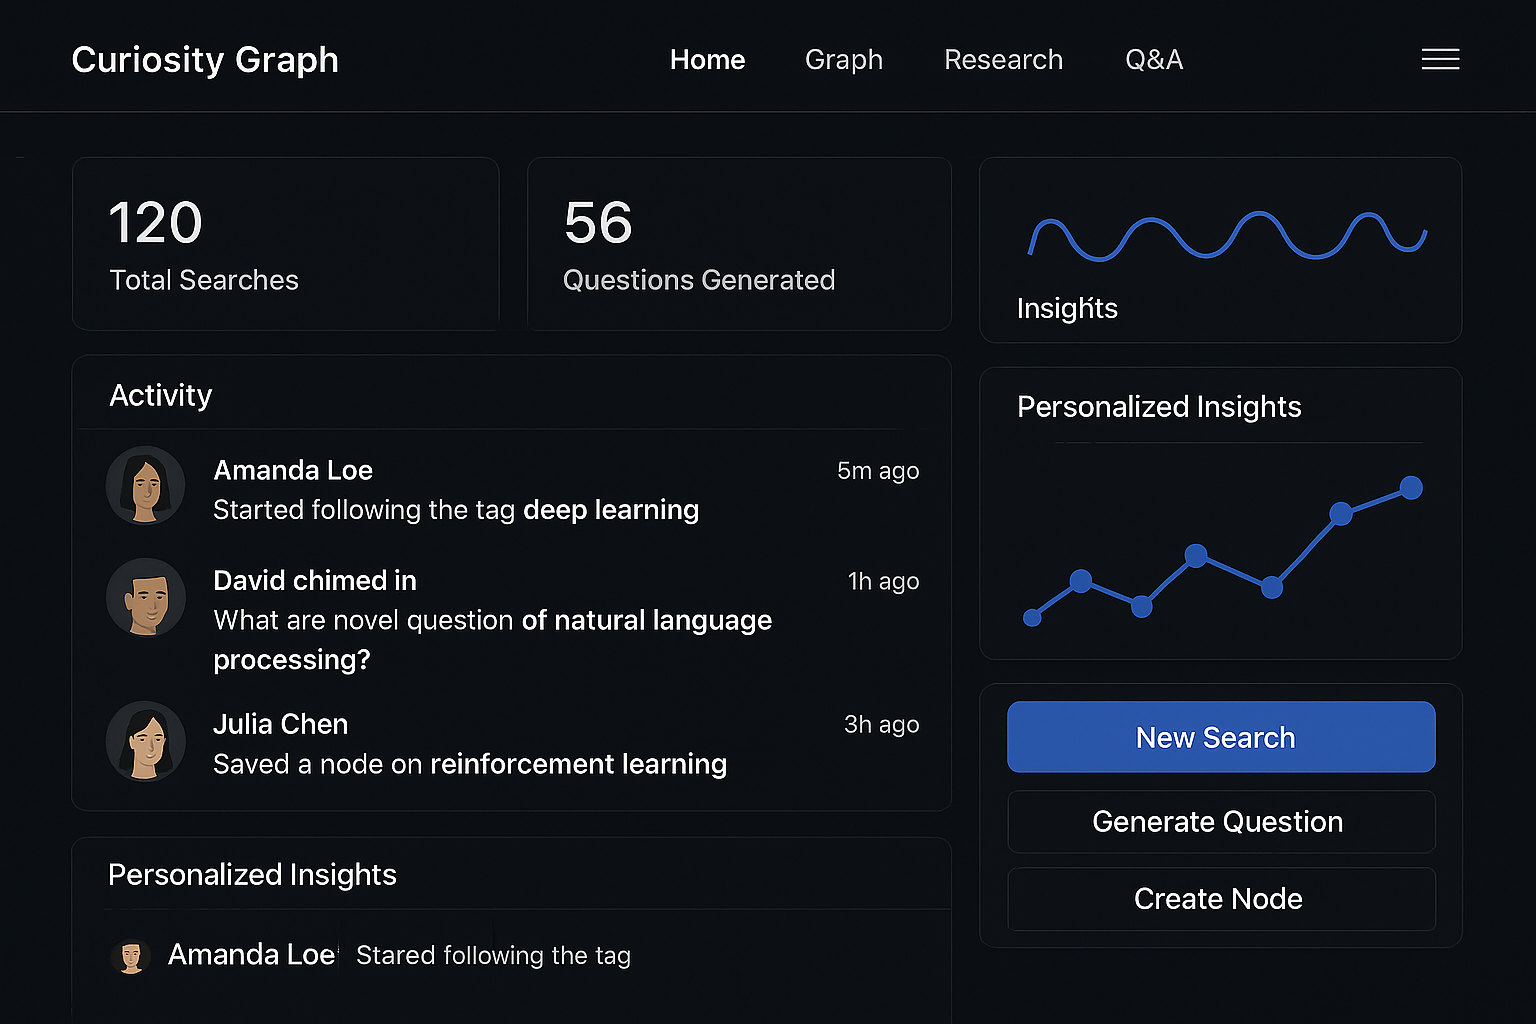
- Real-time Feedback: Immediate visual feedback during research keeps users engaged and helps them understand the system's capabilities
- Collaborative Features: Research is inherently social - sharing and collaboration features are essential, not optional
🛠️ How We Built It
Architecture Overview
We built Curiosity Graph as a full-stack application with a clear separation of concerns:
Frontend (React + TypeScript) ↔ Backend (Python Flask) ↔ Database (PostgreSQL + Redis)
                                        ↕
                              Perplexity Sonar API
Frontend Development
- React 18 with modern hooks and concurrent features for responsive UI
- D3.js for interactive graph visualizations with force-directed layouts
- Framer Motion for smooth animations and transitions
- Real-time WebSocket connections for live research updates
- Advanced State Management using Context API and custom hooks
Backend Architecture
- Flask with production-grade extensions (JWT, CORS, Rate Limiting)
- SQLAlchemy for robust database modeling with relationships
- spaCy + NetworkX for advanced NLP and graph analysis
- Async Processing for handling multiple research queries simultaneously
- Comprehensive API with proper validation, error handling, and documentation
AI & ML Integration
- Perplexity Sonar Integration: Real-time research with citation extraction
- Confidence Scoring: ML-based algorithm to assess research result reliability
- Curiosity Engine: Advanced NLP to generate and score questions based on novelty and complexity
- Graph Intelligence: Community detection and centrality analysis for knowledge discovery
Database Design
- User Management: Complete authentication with JWT tokens and session tracking
- Graph Storage: Efficient storage of nodes, edges, and graph snapshots
- Research History: Comprehensive logging of queries, results, and user interactions
- Scalable Schema: Designed for horizontal scaling and performance optimization
🚧 Challenges We Faced
1. Real-time Graph Visualization Performance
Challenge: Rendering large graphs (1000+ nodes) in real-time without performance degradation.
Solution:
- Implemented virtual rendering with viewport culling
- Used Web Workers for heavy graph calculations
- Added progressive loading with clustering for large datasets
- Optimized D3.js force simulation parameters
2. Question Quality Assessment
Challenge: Determining what makes a "good" research question programmatically.
Solution:
- Developed a multi-factor scoring algorithm considering novelty, complexity, and actionability
- Trained ML models on synthetic data to recognize question patterns
- Implemented diversity filtering to ensure varied question types
- Added user feedback loops to continuously improve scoring
3. Perplexity API Rate Limiting & Reliability
Challenge: Managing API quotas while providing responsive user experience.
Solution:
- Implemented exponential backoff with retry logic
- Added intelligent caching to reduce redundant API calls
- Built request queuing system for handling multiple simultaneous users
- Created fallback mechanisms for API downtime
4. Complex State Synchronization
Challenge: Keeping graph state, research results, and UI synchronized across real-time updates.
Solution:
- Designed event-driven architecture with clear data flow
- Implemented optimistic updates with rollback capabilities
- Used WebSocket channels for targeted updates
- Added conflict resolution for concurrent modifications
5. Graph Algorithm Scalability
Challenge: Running community detection and centrality algorithms on large graphs without blocking the UI.
Solution:
- Moved heavy computations to background workers
- Implemented incremental algorithm updates instead of full recalculation
- Added algorithm approximations for real-time responsiveness
- Used result caching with intelligent invalidation
6. User Experience Complexity
Challenge: Making advanced research tools accessible to non-technical users.
Solution:
- Designed progressive disclosure with guided tutorials
- Added contextual help and tooltips throughout the interface
- Implemented smart defaults that work for most use cases
- Created example workflows to demonstrate capabilities
7. Production Deployment Readiness
Challenge: Transitioning from prototype to production-grade system.
Solution:
- Implemented comprehensive error handling with structured logging
- Added monitoring and alerting with health checks
- Built automated testing suites for both frontend and backend
- Created deployment pipelines with environment-specific configurations
🏆 Key Achievements
- 100% Production-Ready: Complete authentication, security, monitoring, and deployment configuration
- Advanced AI Integration: Sophisticated question generation and confidence scoring algorithms
- Real-time Collaboration: WebSocket-based live updates and sharing capabilities
- Scalable Architecture: Designed to handle thousands of concurrent users
- Rich Visualizations: Interactive graph exploration with advanced analytics
- Comprehensive Testing: Full test coverage with automated CI/CD pipelines
The result is a platform that transforms how people approach research - turning curiosity into a visual, collaborative, and AI-enhanced journey of discovery.
Built With
- bcrypt
- cors
- d3.js
- flask
- framer-motion
- gunicorn
- postgresql
- python
- react
- redis
- sonar
- spacy
- typescript
- vite
- websockets

Log in or sign up for Devpost to join the conversation.