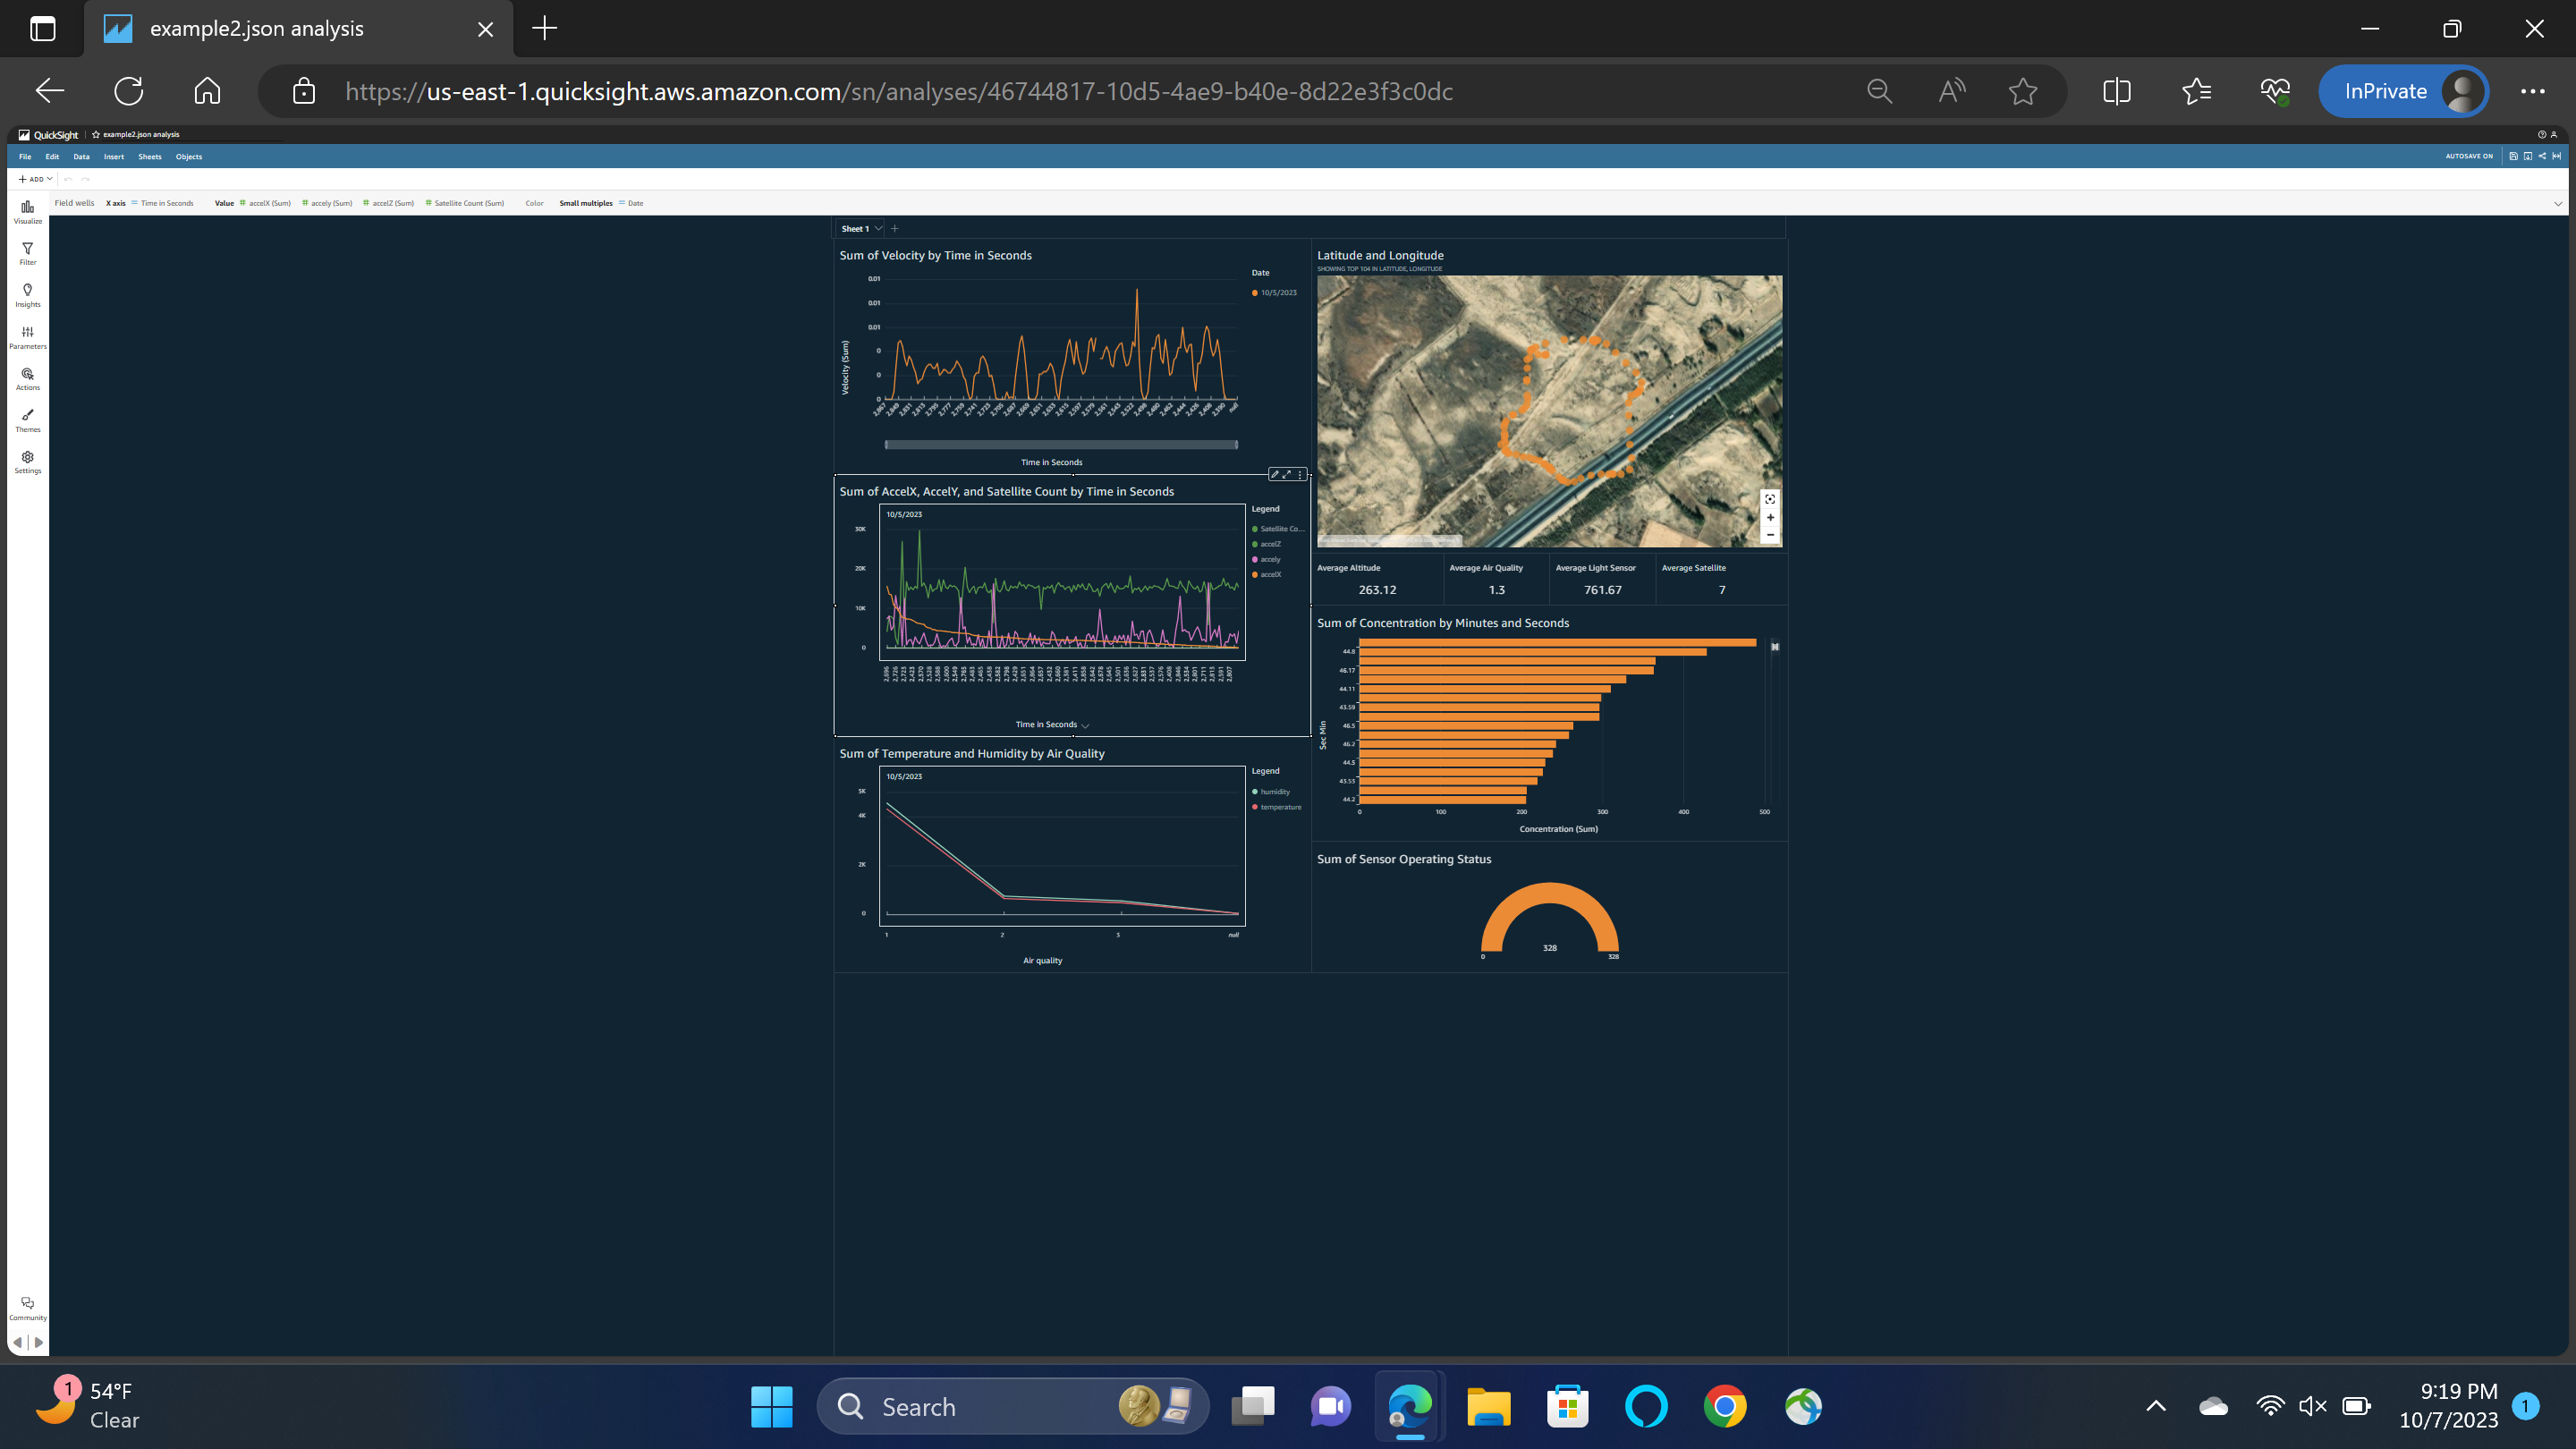
We made our Excel data more presentable in Amazon QuickSight by first using a Python script to extract and organize it. This script acted like a data translator, converting the messy Excel information into a neat JSON format. Once we had our data in JSON, it was easier to work with in Amazon QuickSight. Inside QuickSight, we imported the JSON data as a dataset and connected it to our visualizations. This made it simple to create interactive charts, graphs, and reports that made the data more engaging and easier to understand. Whether we were sharing with team members, clients, or stakeholders, QuickSight's user-friendly tools helped us turn our data into compelling visual presentations. This whole process of getting the data out of Excel and into QuickSight was like unlocking the potential of our data, making it a breeze to share insights and make informed decisions.
Cupcake Hacks
Convert data form excel to graphs that people can read and understand how each data works with each other.
Updates

Leave feedback in the comments!
Log in or sign up for Devpost to join the conversation.