-

Main Page
-

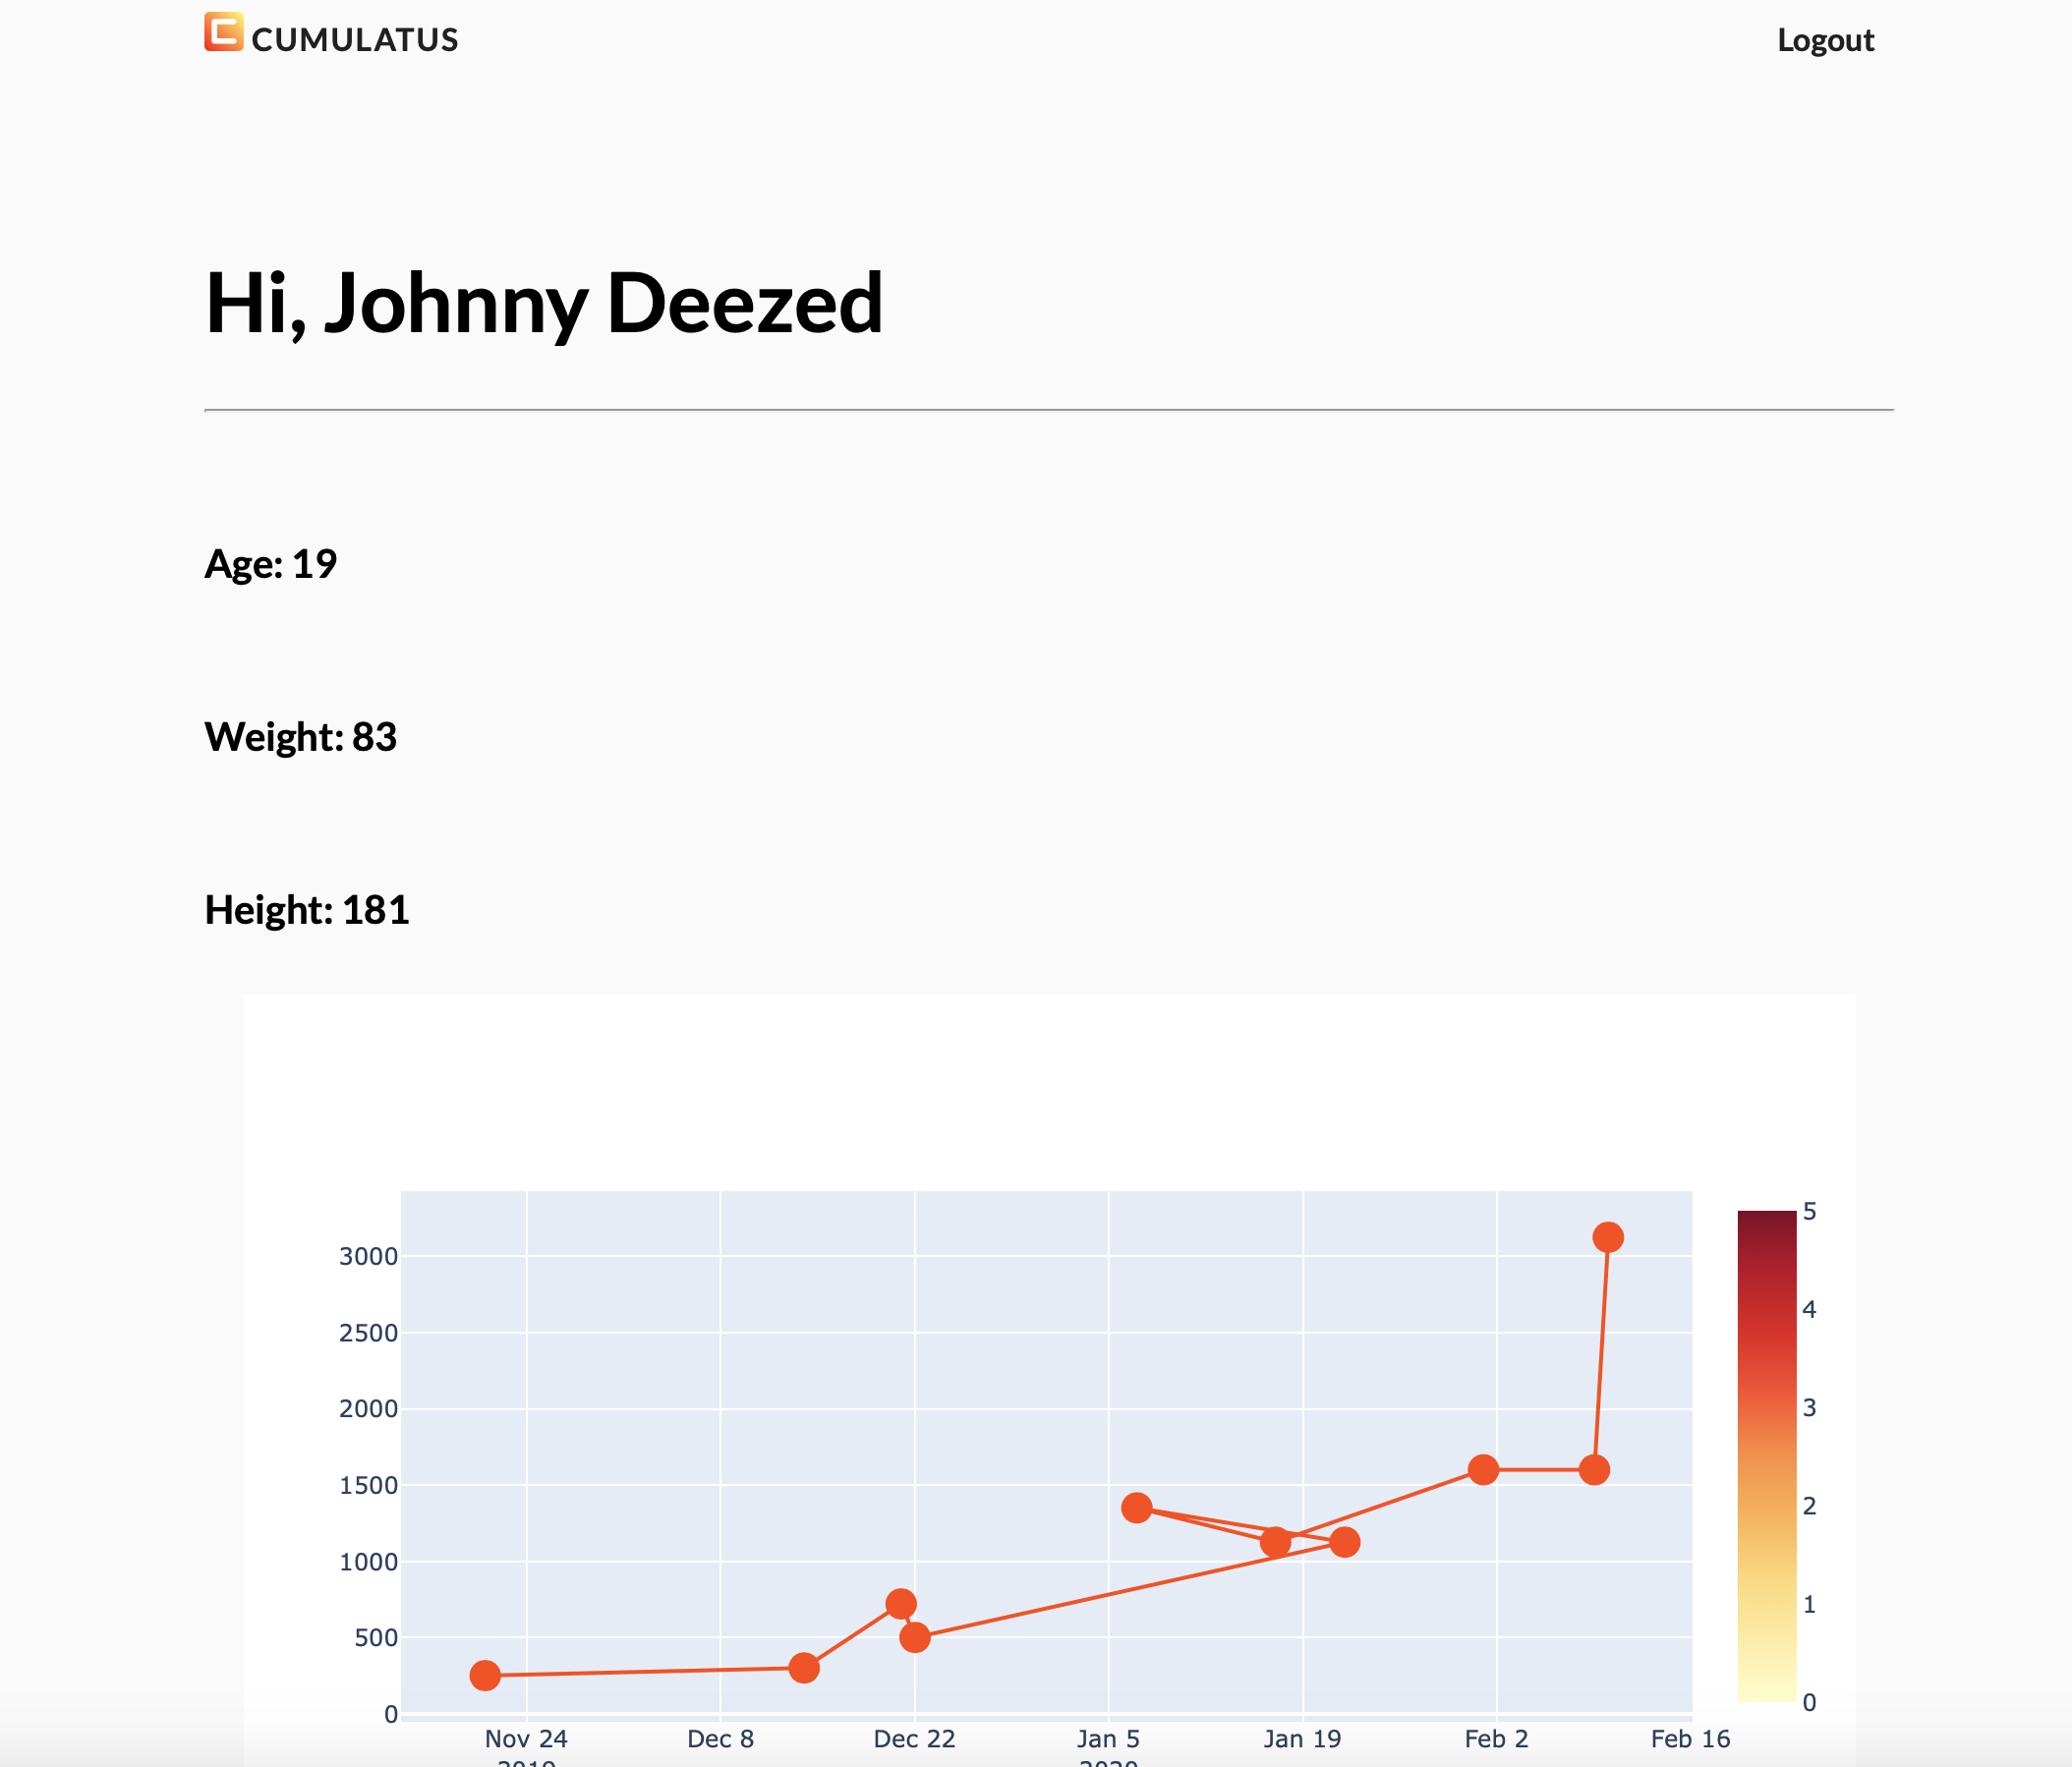
Graphical representation
Inspiration
As regular gym-goers, we understand that recording our work out progress is very beneficial. But as computer science students, we thought about what we can do with this data. Thus, we decided to create a website that takes in your workout data and produces a graphical representation of it.
What it does
Cumulatus.online accumulates and analyzes a regular gym goer's workout data(weight and reps) through their manual input. From the data, our website then produces a table, graph, and chart for the user to see the visualization of their accumulated progress. We will also give suggestions to the user according to their exercise pattern.
How we built it
We started with the free domain we got from domain.com for hackathons. We then built the interface of the website using HTML, the database using SQL, The visualization ploty and the framework using flask and python.
Challenges we ran into
There were many challenges we ran into: One of them is that none of us started knowing SQL, but we eventually learned it through coding out database. We also had a time when our team coordination fell apart in planning, we later resolved this issue by establishing team-working structures and task separations.
Accomplishments that we're proud of
This is our team’s first hackathon, we are extremely proud of what we did within the past two days. This includes coming down to an idea and successfully implementing it within 24 hours, conquering our challenges with new knowledge, and establishing a stable working structuring among the four of us.
What we learned
This hackathon has been great learning progress for us. On the technical side, we learned how to code with SQL and use the Flask framework to connect our data with our interface. On the communication skills side, we learned to coordinate coding tasks in teams, namely the distribution of tasks and identifying each of our strengths and weaknesses.
Log in or sign up for Devpost to join the conversation.