-
-
Brief
-
Report
-
Network
-
New-campaign
-
-
Research-running
-
Search
-
Cretive-brief
-
Opportunities
-
Strategy
-
Devil-advocate
-
Copilot
-
Qloo-Culture
-
Story-board
-
Ch1-who
Inspiration
Every brand says it wants to be “part of culture”. Very few can prove what their audience’s culture actually is.
At agencies, the work is split in two. The strategy team produces a deck of paragraphs. Weeks later, the creative team builds moodboards from Pinterest and stock photos, often drifting away from what the research said. The client picks a direction from text they can’t picture, usually the safest one. And when someone asks “why this image?”, nobody can trace it back to anything real.
We saw something missing. Qloo’s taste graph knows what people love beyond any one category: the music, brands, shows and places that travel together. Large language models can read the web and reason about it. Image models can now run on a laptop. Nobody had connected the three into one chain: audience taste data → evidence → strategy → creative, with receipts at every step. That’s CultureCrash.
What it does
CultureCrash is a cultural-intelligence and campaign-strategy workspace for agencies and brand teams. It follows five stages:
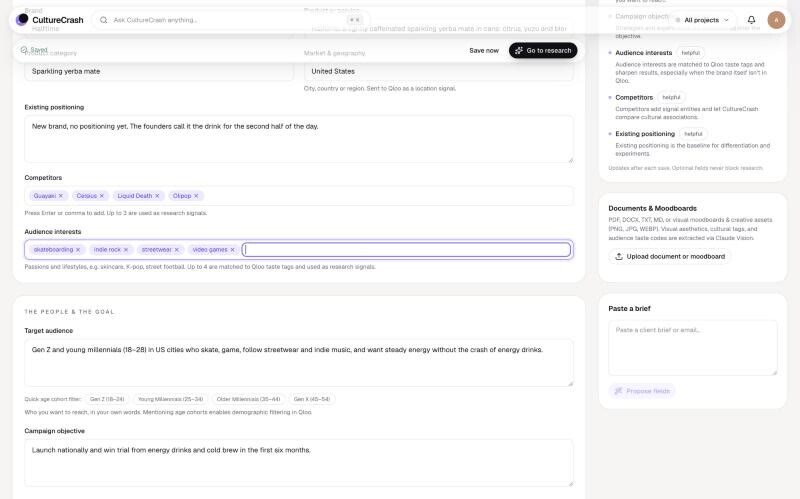
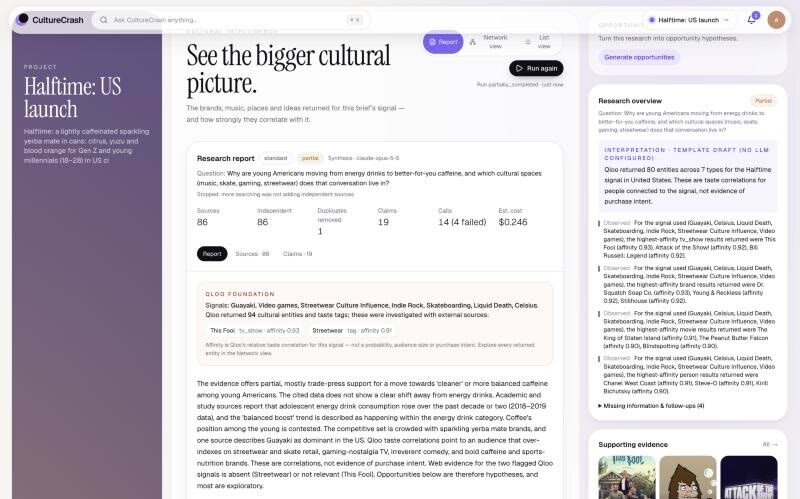
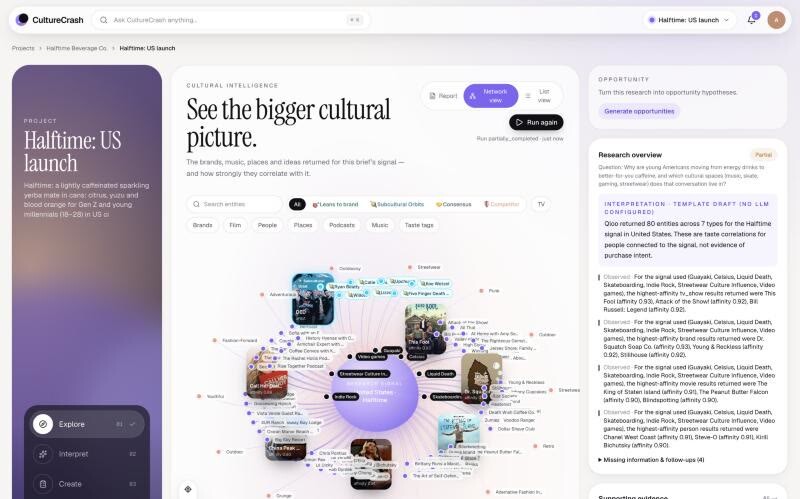
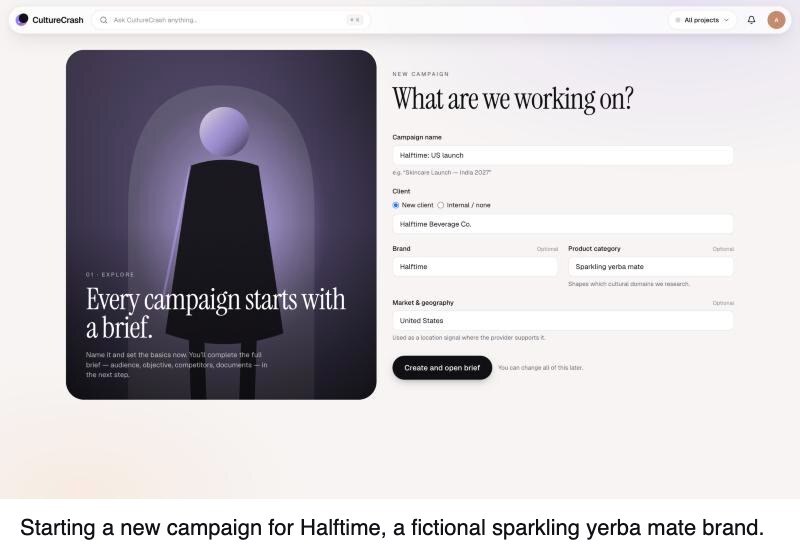
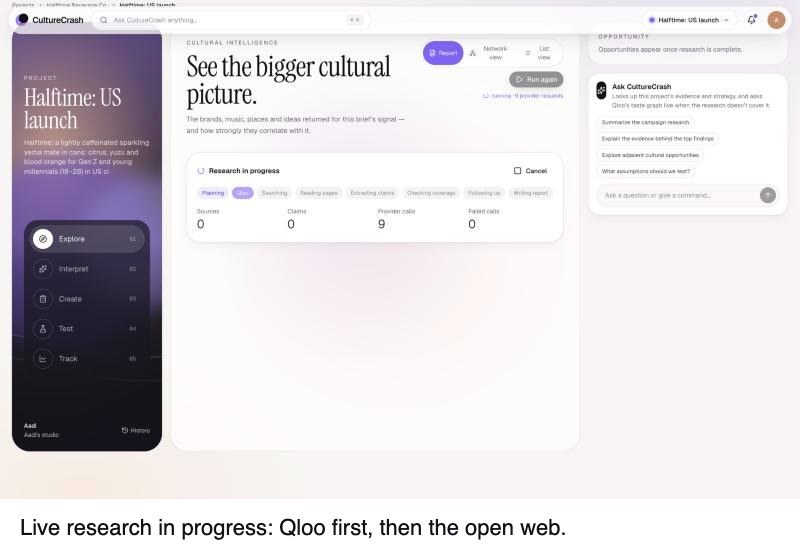
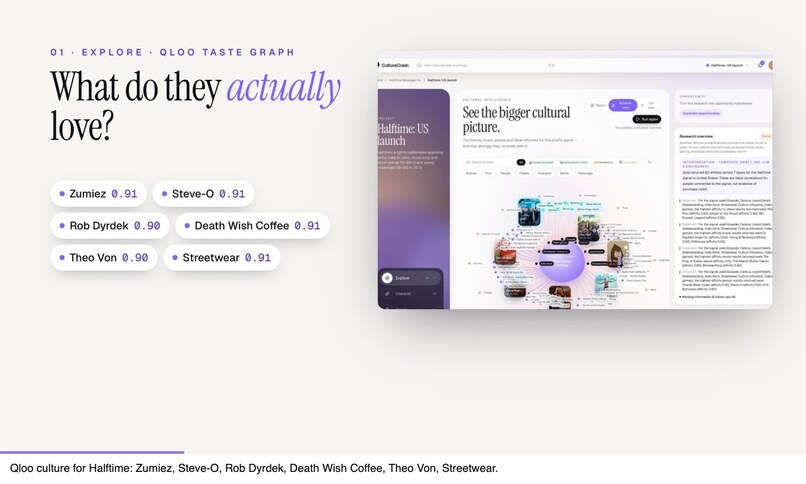
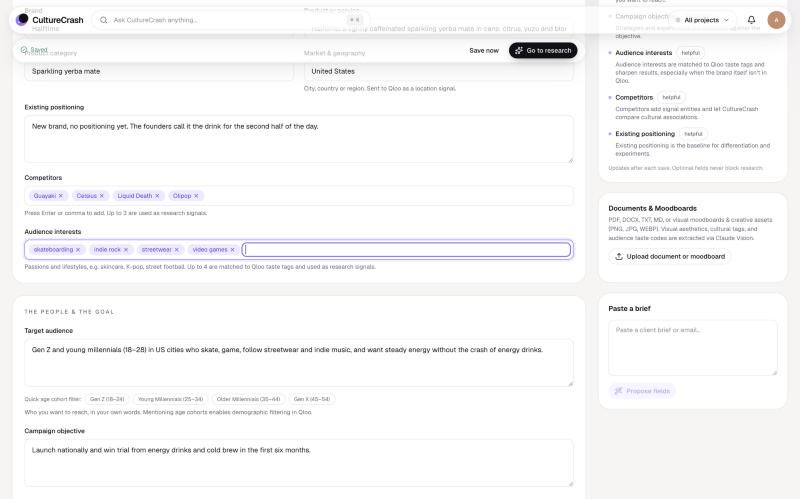
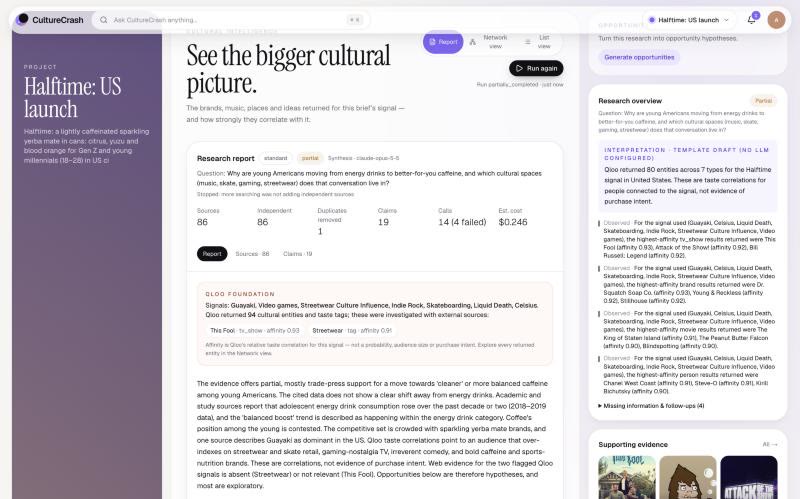
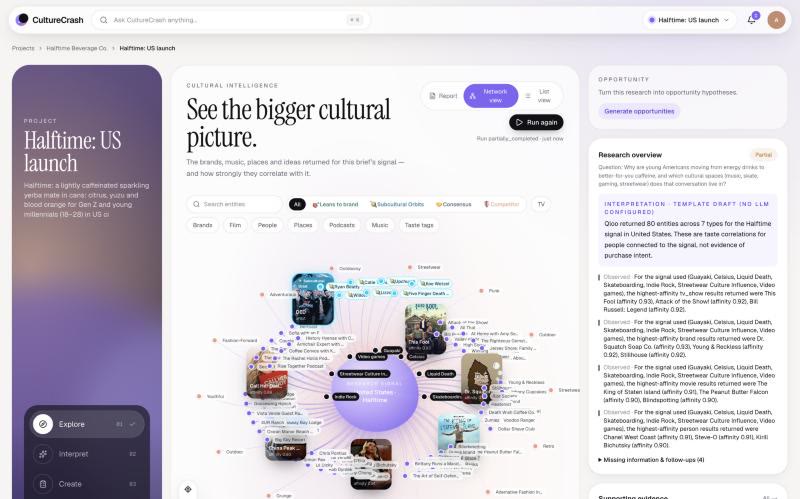
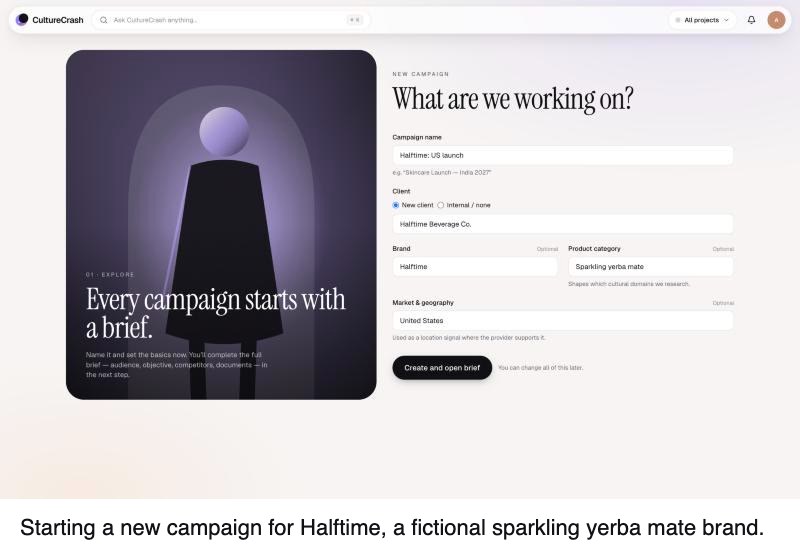
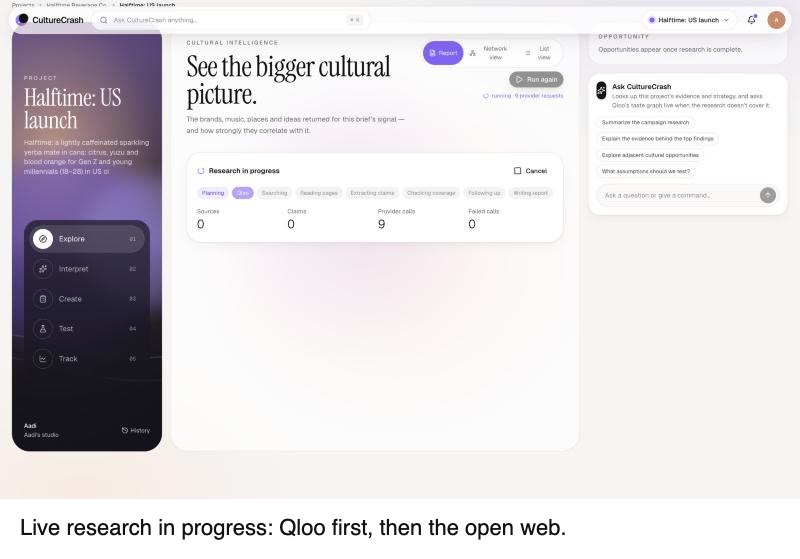
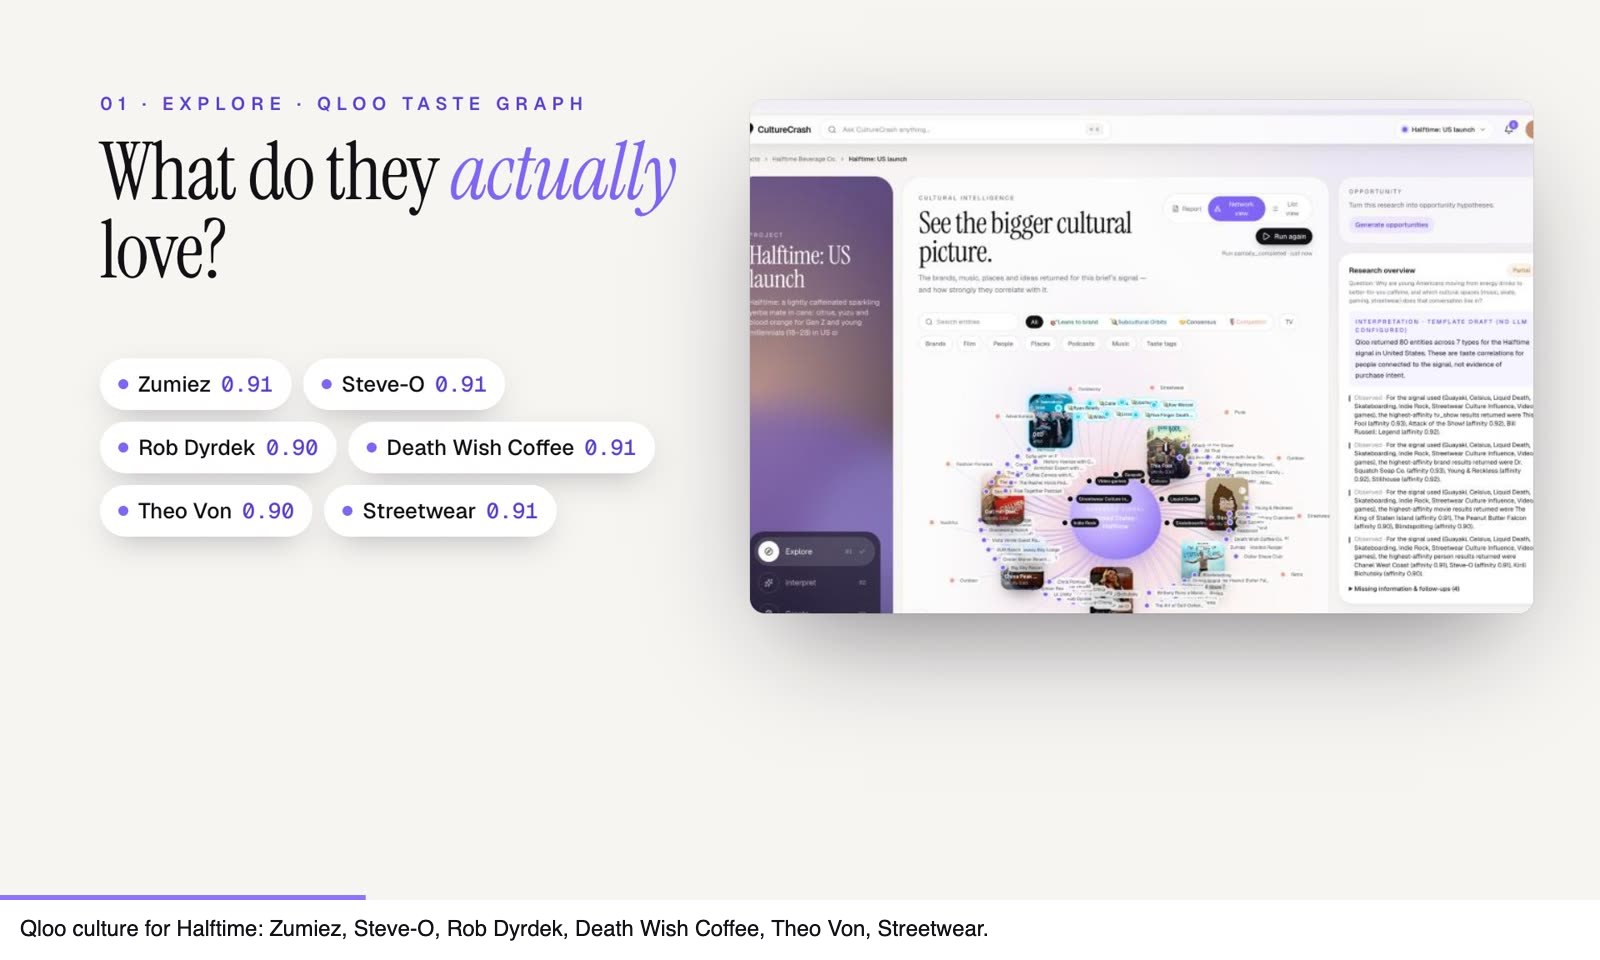
01 · Explore. You write a brief: brand, audience, objective, competitors, interests, plus uploaded brand guidelines or moodboards. CultureCrash then runs live research. Qloo maps what the audience is into across brands, artists, people, TV, podcasts and places. The open web (Google via Serper, Exa, Tavily, YouTube, Wikipedia, Reddit, Hacker News) explains why. Every claim is cited, every API call is in a cost ledger, and the report is written by Claude. Real run: 86 sources, 19 cited claims and 101 Qloo entities in about four minutes, for $0.25.
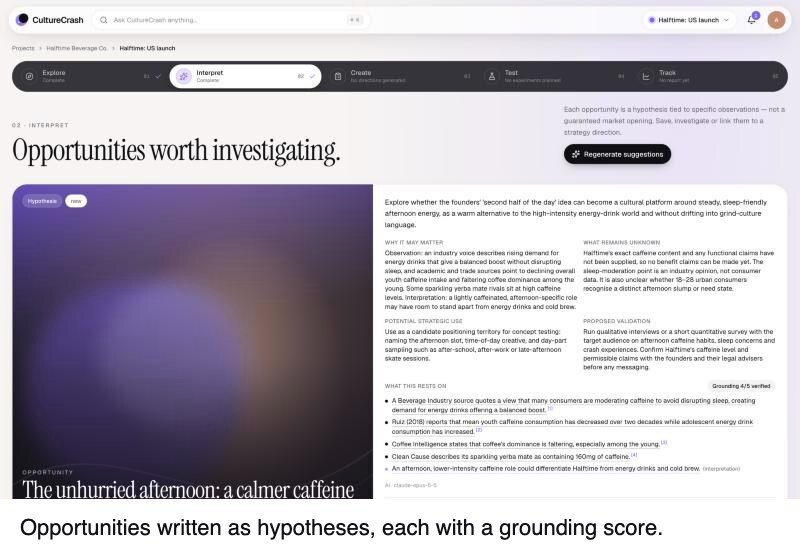
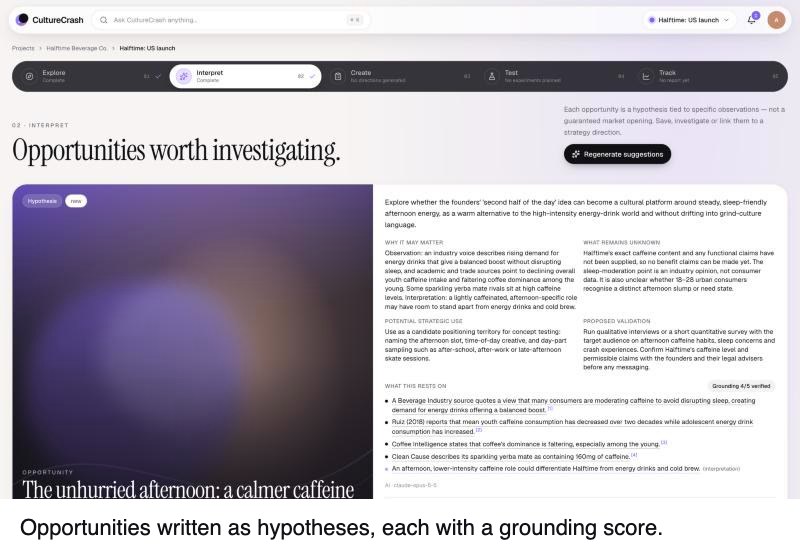
02 · Interpret. An evidence ledger labels everything as observed, interpretation or hypothesis. Opportunities are written as hypotheses, each with why it may matter, what’s still unknown, how to validate it, and a grounding score that checks every claim against its own source.
03 · Create.
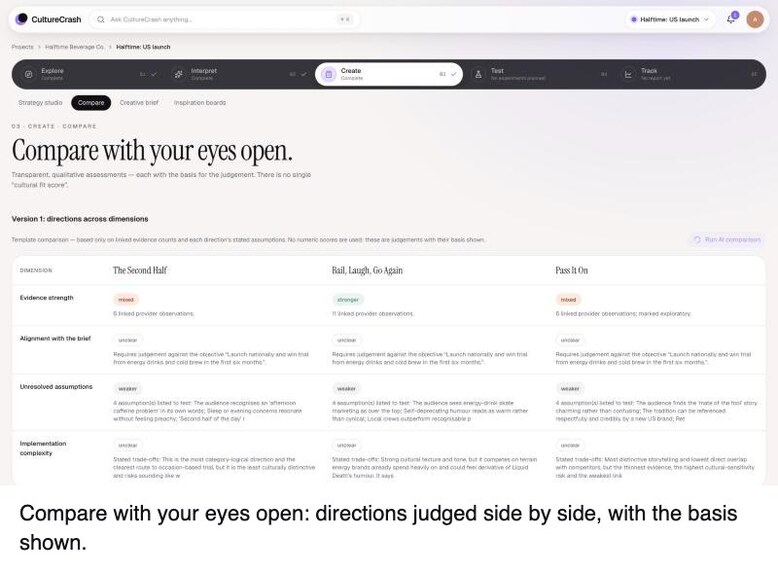
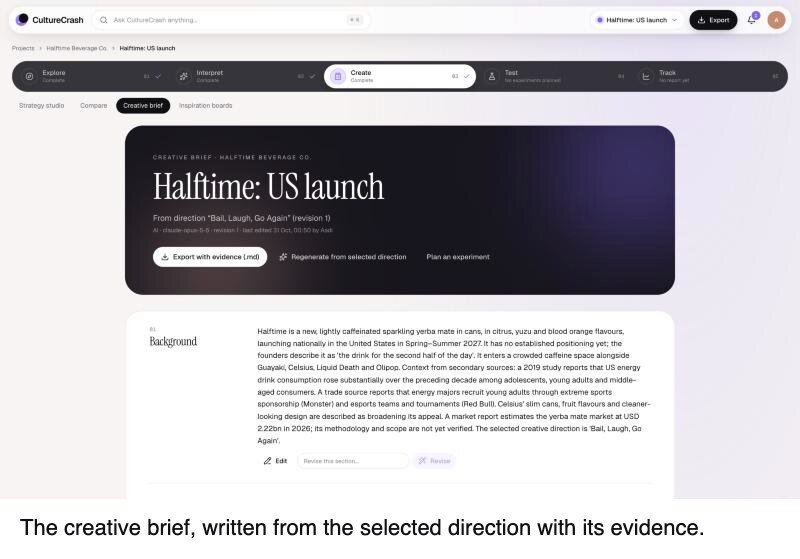
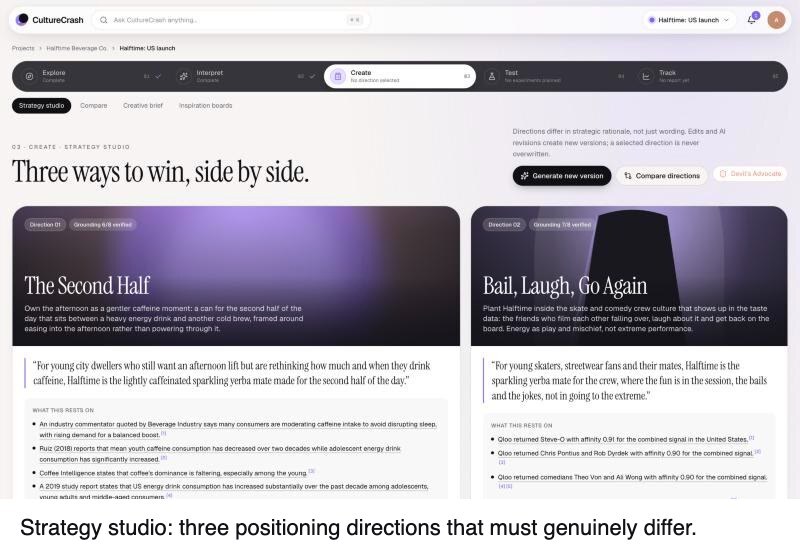
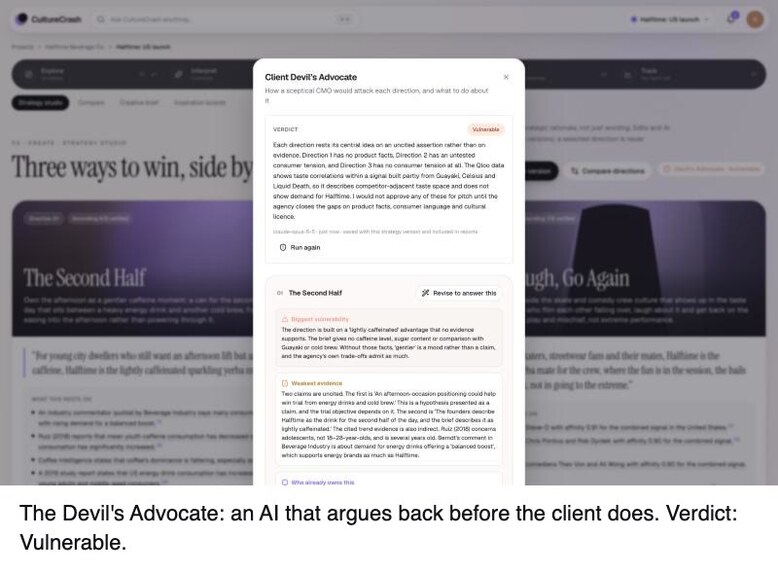
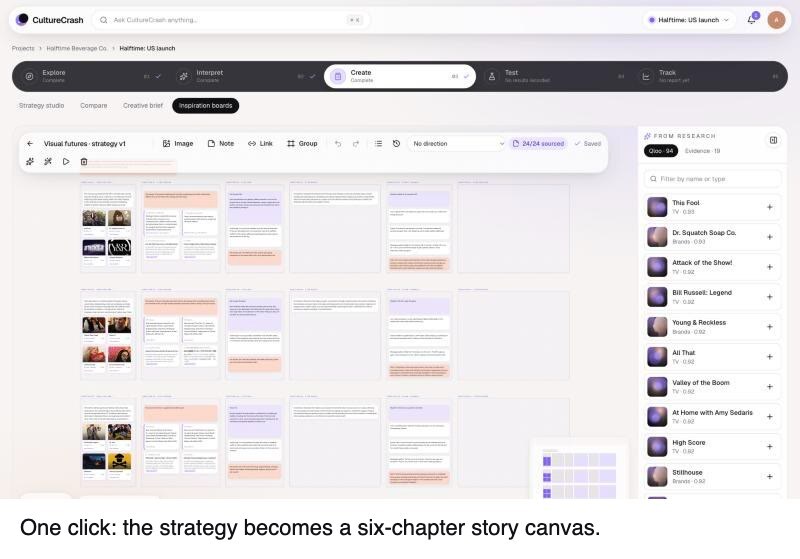
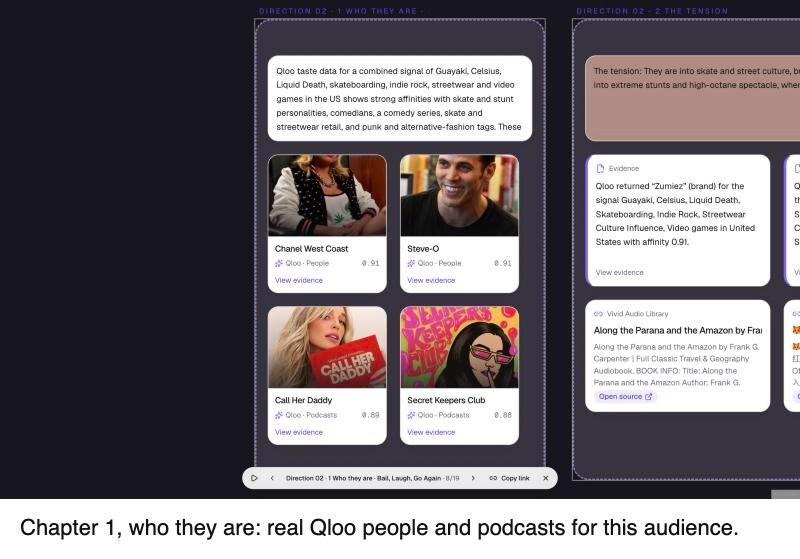
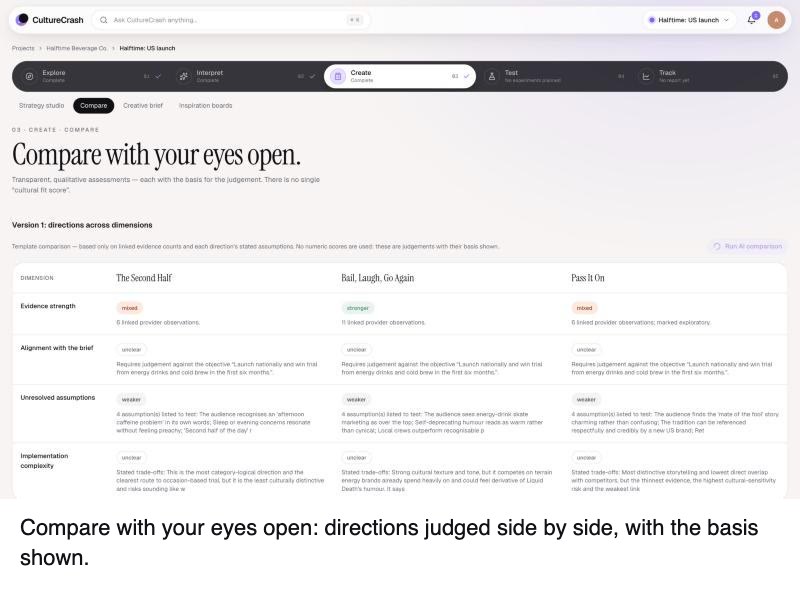
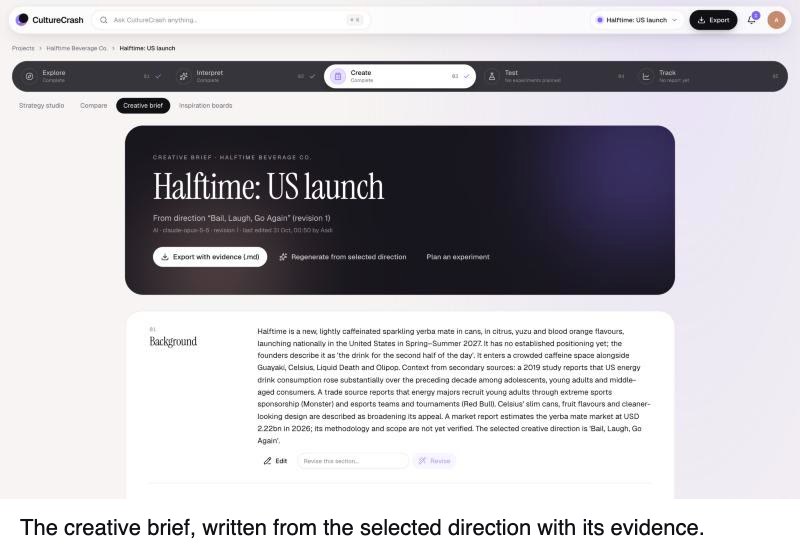
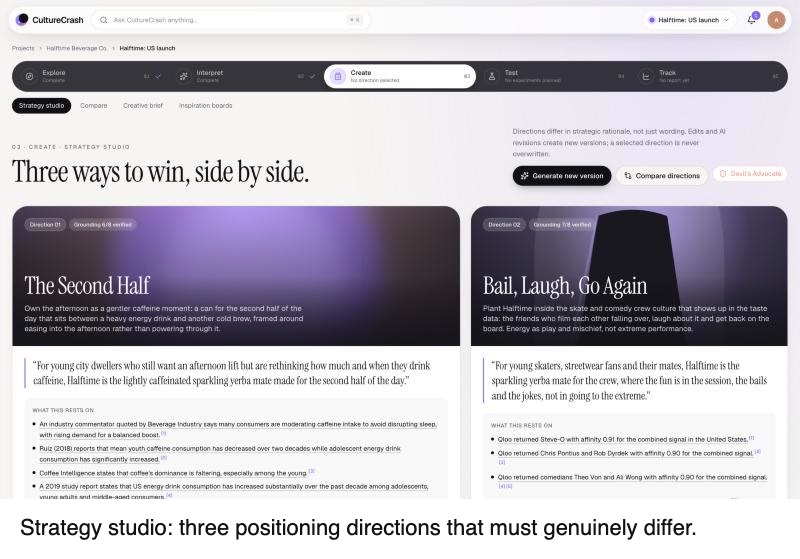
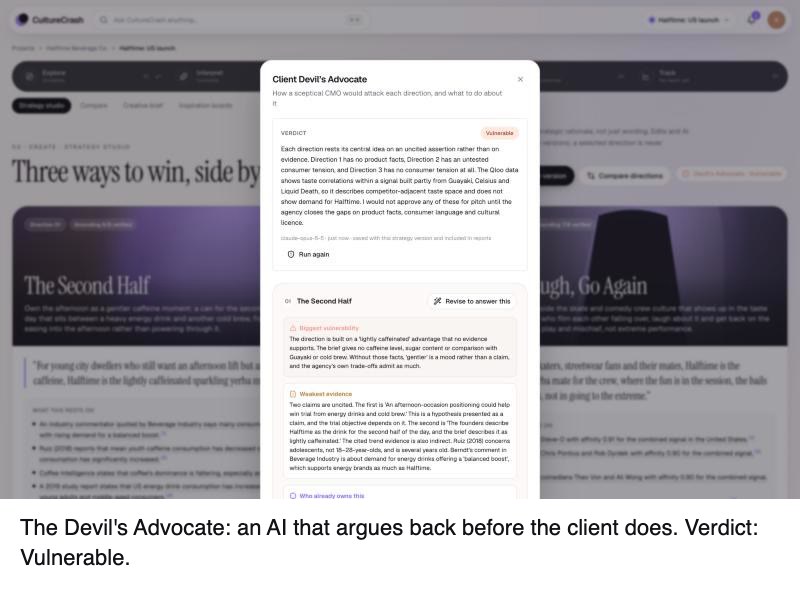
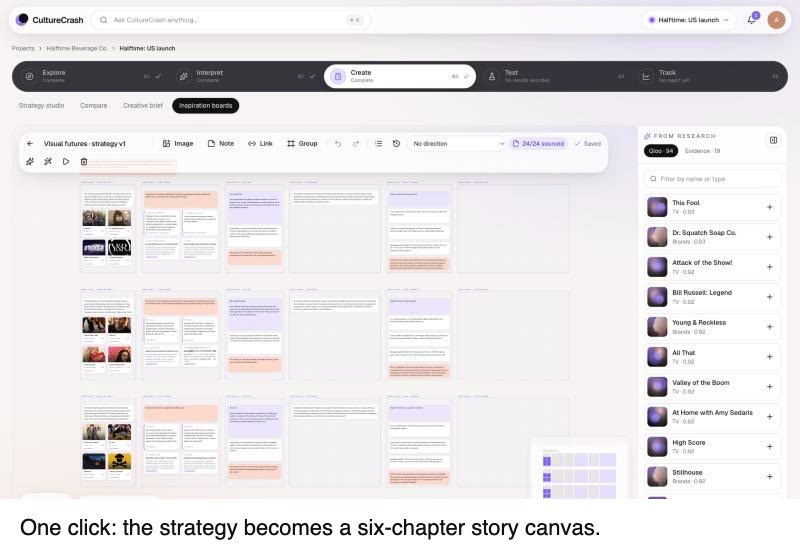
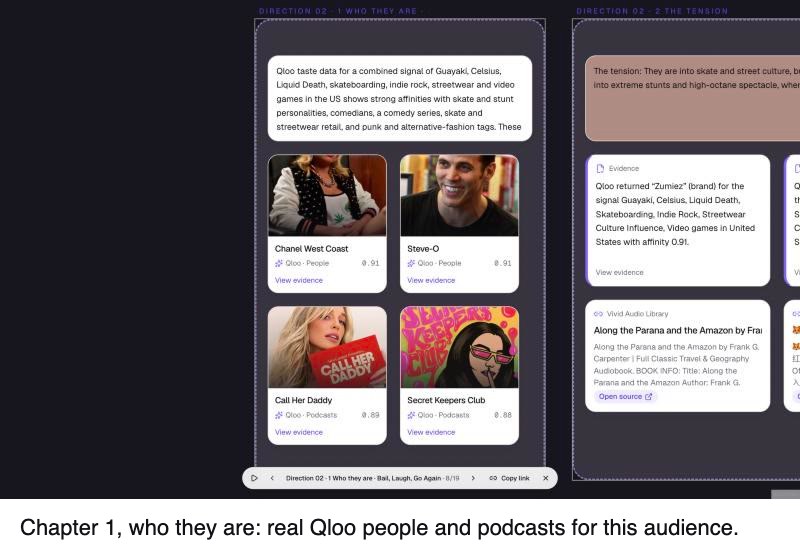
Three positioning directions that must differ in rationale, not just wording, plus a side-by-side compare. The Client Devil’s Advocate: an AI that attacks each direction like a sceptical CMO before your client does. It found our own demo strategy “Vulnerable” and said exactly why. A creative brief written from the chosen direction. “Show me these directions”: one click turns the strategy into a six-chapter story canvas (who they are, the tension, the idea, the world, how it shows up, touchpoints). It’s filled with real Qloo people and places, cited evidence, AI-written copy, and concept frames rendered on the agency’s own GPU. Why this image: every frame carries its receipts, from Qloo signal to evidence, direction, art direction, exact prompt and cultural-fit score. Make it fit better: on a weak frame, the AI art director looks at the image, says what’s wrong, and re-renders it. Touchpoint mockups: a social post, story, playlist cover and billboard, generated from each frame.
04 · Test. Experiments with a hypothesis, variants and a decision rule agreed before results arrive. Results get real statistics (lift, a 95% range, a plain-English verdict) and flow back into the evidence ledger.
05 · Track. Versioned reports and pitch packs with a “Three visual futures” page, one-click PDF and read-only share links. Watch monitors the client and two competitors in the news daily.
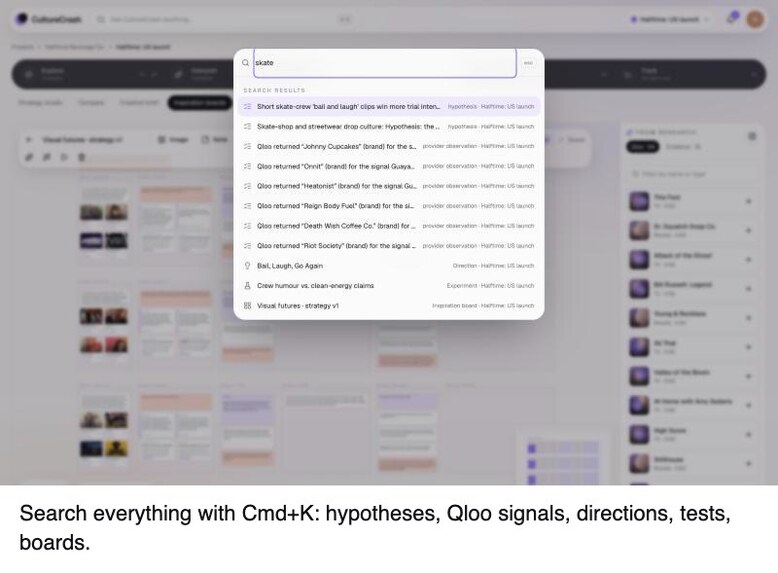
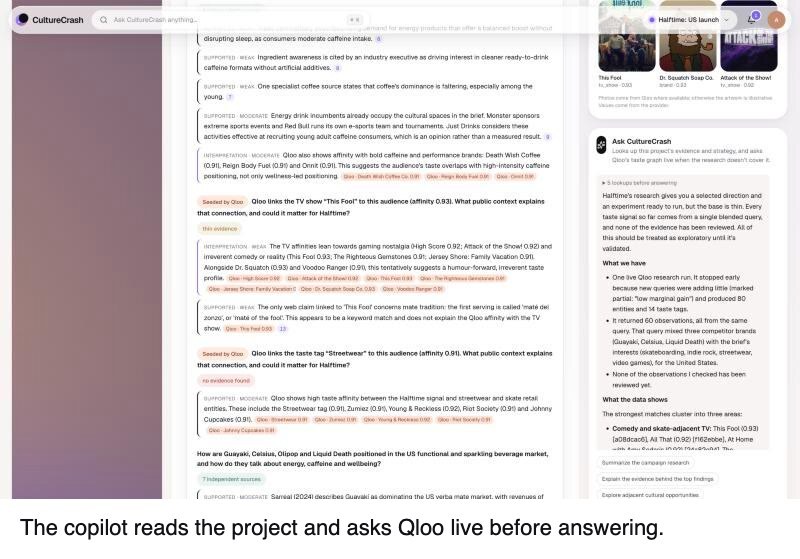
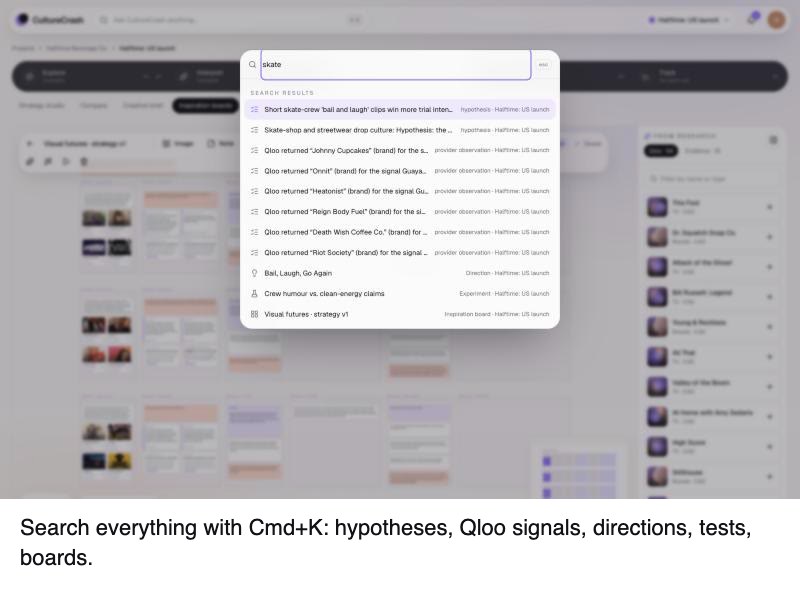
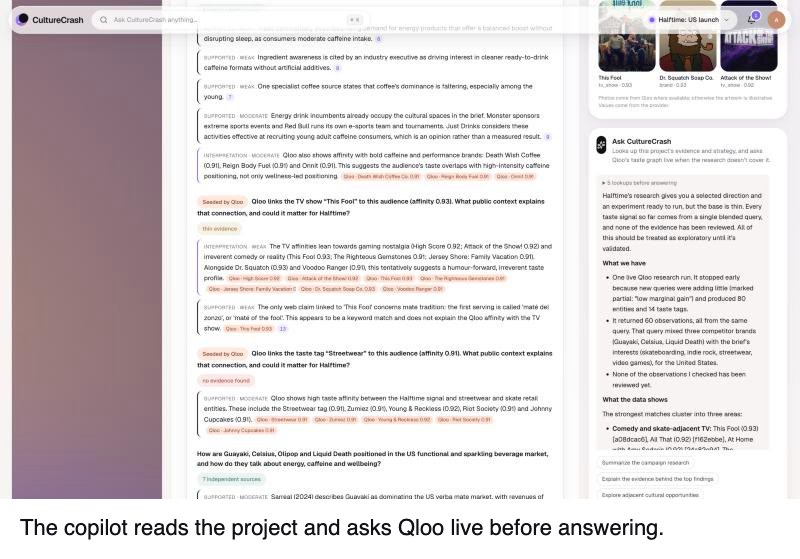
Across all of it: a copilot that reads the project and queries Qloo live, ⌘K search over everything, real-time presence, roles, notifications and per-workspace spending limits.
How we built it App: Next.js 16 (App Router, server actions), React 19, TypeScript in strict mode, Tailwind CSS v4 with design tokens, and React Flow for the canvases. Data and security: Supabase Postgres with Row Level Security on every table. Every query runs as the signed-in user, so the database enforces permissions, not just the app. We deliberately never use Supabase’s master (service-role) key, even for the image pipeline. AI: Claude Opus 5.5 handles research synthesis, strategy, the Devil’s Advocate and art direction. Claude Haiku 5.5 handles fast checks. Every model output is validated against a strict schema before it’s saved. Evidence the model cites is checked against what’s actually stored. Without a key, a labelled template engine still produces drafts, so the product never silently pretends. Research engine: plans questions, routes them to the right sources, reads full pages, removes duplicate copies, extracts cited claims, follows up on gaps, and stops on coverage, budget or diminishing returns. Qloo: brand and competitors via /search, audience interests via /v2/tags, cultural affinities via /v2/insights per entity type, plus location and age-cohort signals. The local GPU studio: ComfyUI on a 6 GB RTX 3050 laptop, running through Pinokio, with commercially licensed models only: Z-Image Turbo for concepts, RealVisXL V5 for variations and Real-ESRGAN for upscaling. The PC polls the website for jobs, so it needs no open port or tunnel. It renders a frame in about 2 minutes and uploads the result. Why local: running locally is how we cut out heavy usage cost. Image generation costs nothing per image, however much clients use it, and no image ever leaves the studio. Delivery: Vercel for hosting and scheduled jobs (daily Watch, retention, weekly digest), react-pdf for reports, and sharp for image processing (metadata stripped). Quality: 179 unit tests, database security tests, and Playwright end-to-end scenarios. We also ran the whole product as a real client, from brief to report, before submitting. Challenges we ran into Culture data isn’t equally rich everywhere. Our first demo, a skincare brand in India, paired skincare with classical playback singers, which made no sense to a viewer. Qloo’s taste graph is strongest for Western markets, so we re-ran the demo for a US Gen Z brand. The culture came back coherent: skate, stunt comedy and streetwear. Making AI images not look like AI. The first frames all looked like the same photo shoot. We built an AI art director that picks a distinct photographic look per direction (film stock, light, lens), plus portrait and landscape formats. The difference was dramatic. Running image models on 6 GB of VRAM meant low-VRAM settings, tiled decoding and careful image sizes. The PC’s gateway caps images at 1152px, which broke our first batch until we caught it. Connecting a laptop to the cloud securely. Exposing the PC through a tunnel felt risky, so we flipped it around: the PC asks the website for work. That way there’s no public port, and we never needed the database master key. Trust in AI output. Hallucinated citations would kill this product with agencies. So every claim is checked against its source, every frame keeps a provenance trail, and anything AI-generated is labelled. Real-world bugs found by using it for real: a database security rule that silently blocked the “Make it fit better” feature a production deployment that got rolled back mid-demo a laptop disk that kept filling up
We found and fixed all of them by running the product end to end as a client.
Accomplishments that we’re proud of The full chain works, live: brief → Qloo + web research → evidence → opportunities → three strategies → Devil’s Advocate → creative brief → story board with GPU-rendered frames → mockups → experiment → PDF report. It runs on real APIs, not mock data. $0.25 for a research run across 86 sources, and $0 per image on a laptop GPU. Every image shows its receipts. No other tool we know of can answer “why does this image fit this audience?” with the data behind it. An AI that disagrees with you. The Devil’s Advocate called our own strategy “Vulnerable”, which is exactly the honesty agencies need before a pitch. Concept frames that look like real campaign photography, made on consumer hardware. Security done properly: database-level permissions on every table, no master key anywhere, private storage, and AI content clearly labelled. What we learned Taste data is a starting point, not an answer. Qloo tells you what travels together; you still need evidence to explain why and experiments to prove it works. That’s why we built the evidence ladder: observed, interpretation, hypothesis, validated. Grounding beats eloquence. A shorter answer with a source beats a beautiful one without. Agencies trust receipts. Local models change the economics. Once generation runs on your own GPU, the cost of trying ten more ideas drops to zero, and creativity goes up. Data coverage varies by market. Picking the right market and audience matters as much as the model. Use your own product like a client. Running Halftime end to end found more real bugs in an hour than our test suites did in days. What’s next for CultureCrash
Our vision: become the operating system for culture-led marketing, where every brand decision is grounded in culture and every campaign makes the next one smarter.
Today CultureCrash is a strong research → strategy → pitch engine. That’s our wedge, because no one else turns taste data into positioning. Here’s the six-stage roadmap and where each stage stands:
1 · Brand intelligence + Watch: live
Built: Qloo-first research explained by the web, YouTube, Reddit, Wikipedia and client documents. Every claim cited, rejected evidence excluded. Per-client brand memory and guidelines. Watch now re-checks a client and two competitors daily. Next: alerts like “a competitor just moved into your territory”, and trend lines that build automatically over time.
2 · Opportunity and strategy engine: live
Built: opportunities as hypotheses, three genuinely different directions, claim-by-claim grounding with receipts, the Client Devil’s Advocate, side-by-side comparison, version history and the pitch pack. The live AI path now runs end to end with real keys. Next: scoring and ranking which opportunity to pursue first, and sizing the audience and the opportunity.
3 · Creative production studio: early, and moving fast
Built: the creative brief, plus concept frames rendered on your own GPU, an AI art director, headlines, lines and social captions, touchpoint mockups, cultural-fit checks and “make it fit better”. Next: brand-safety checks that creative stays on-brand, review and approval flows, and video concepts.
4 · Campaign operations and integrations: next
Built: email notifications, and importing ad-platform results from CSV. Next: live connections to Meta, Google, TikTok and analytics; launch planning, content calendars and budget tracking; pushing work into Figma, Slack, Asana and Drive, where agencies already work.
5 · Performance measurement and optimisation: early
Built: experiments with a decision rule agreed in advance, real statistics, design locking, and results flowing into evidence and reports. Next: live performance feeds, dashboards over time, and “here’s what to change next” recommendations.
6 · Persistent learning and controlled autonomy: the vision
Building blocks today: brand memory, the evidence ladder up to “validated conclusion”, saved critiques, cost limits, and a copilot that only proposes actions a person must approve. That’s the right model for controlled autonomy. Next: experiment results feeding the next strategy automatically; learning that carries across campaigns and clients (“what worked for beverage launches”); and agents that work on their own within limits you set, like re-running research weekly or drafting the monthly report.
Built With
- anthropic
- claude
- comfyui
- exa
- next.js
- pinokio
- postgresql
- qloo
- react
- react-flow
- react-pdf
- real-esrgan
- realvisxl
- serper
- sharp
- supabase
- tailwindcss
- tavily
- typescript
- vercel
- wikipedia-api
- youtube-data-api
- z-image-turbo
- zod

Log in or sign up for Devpost to join the conversation.