Inspiration
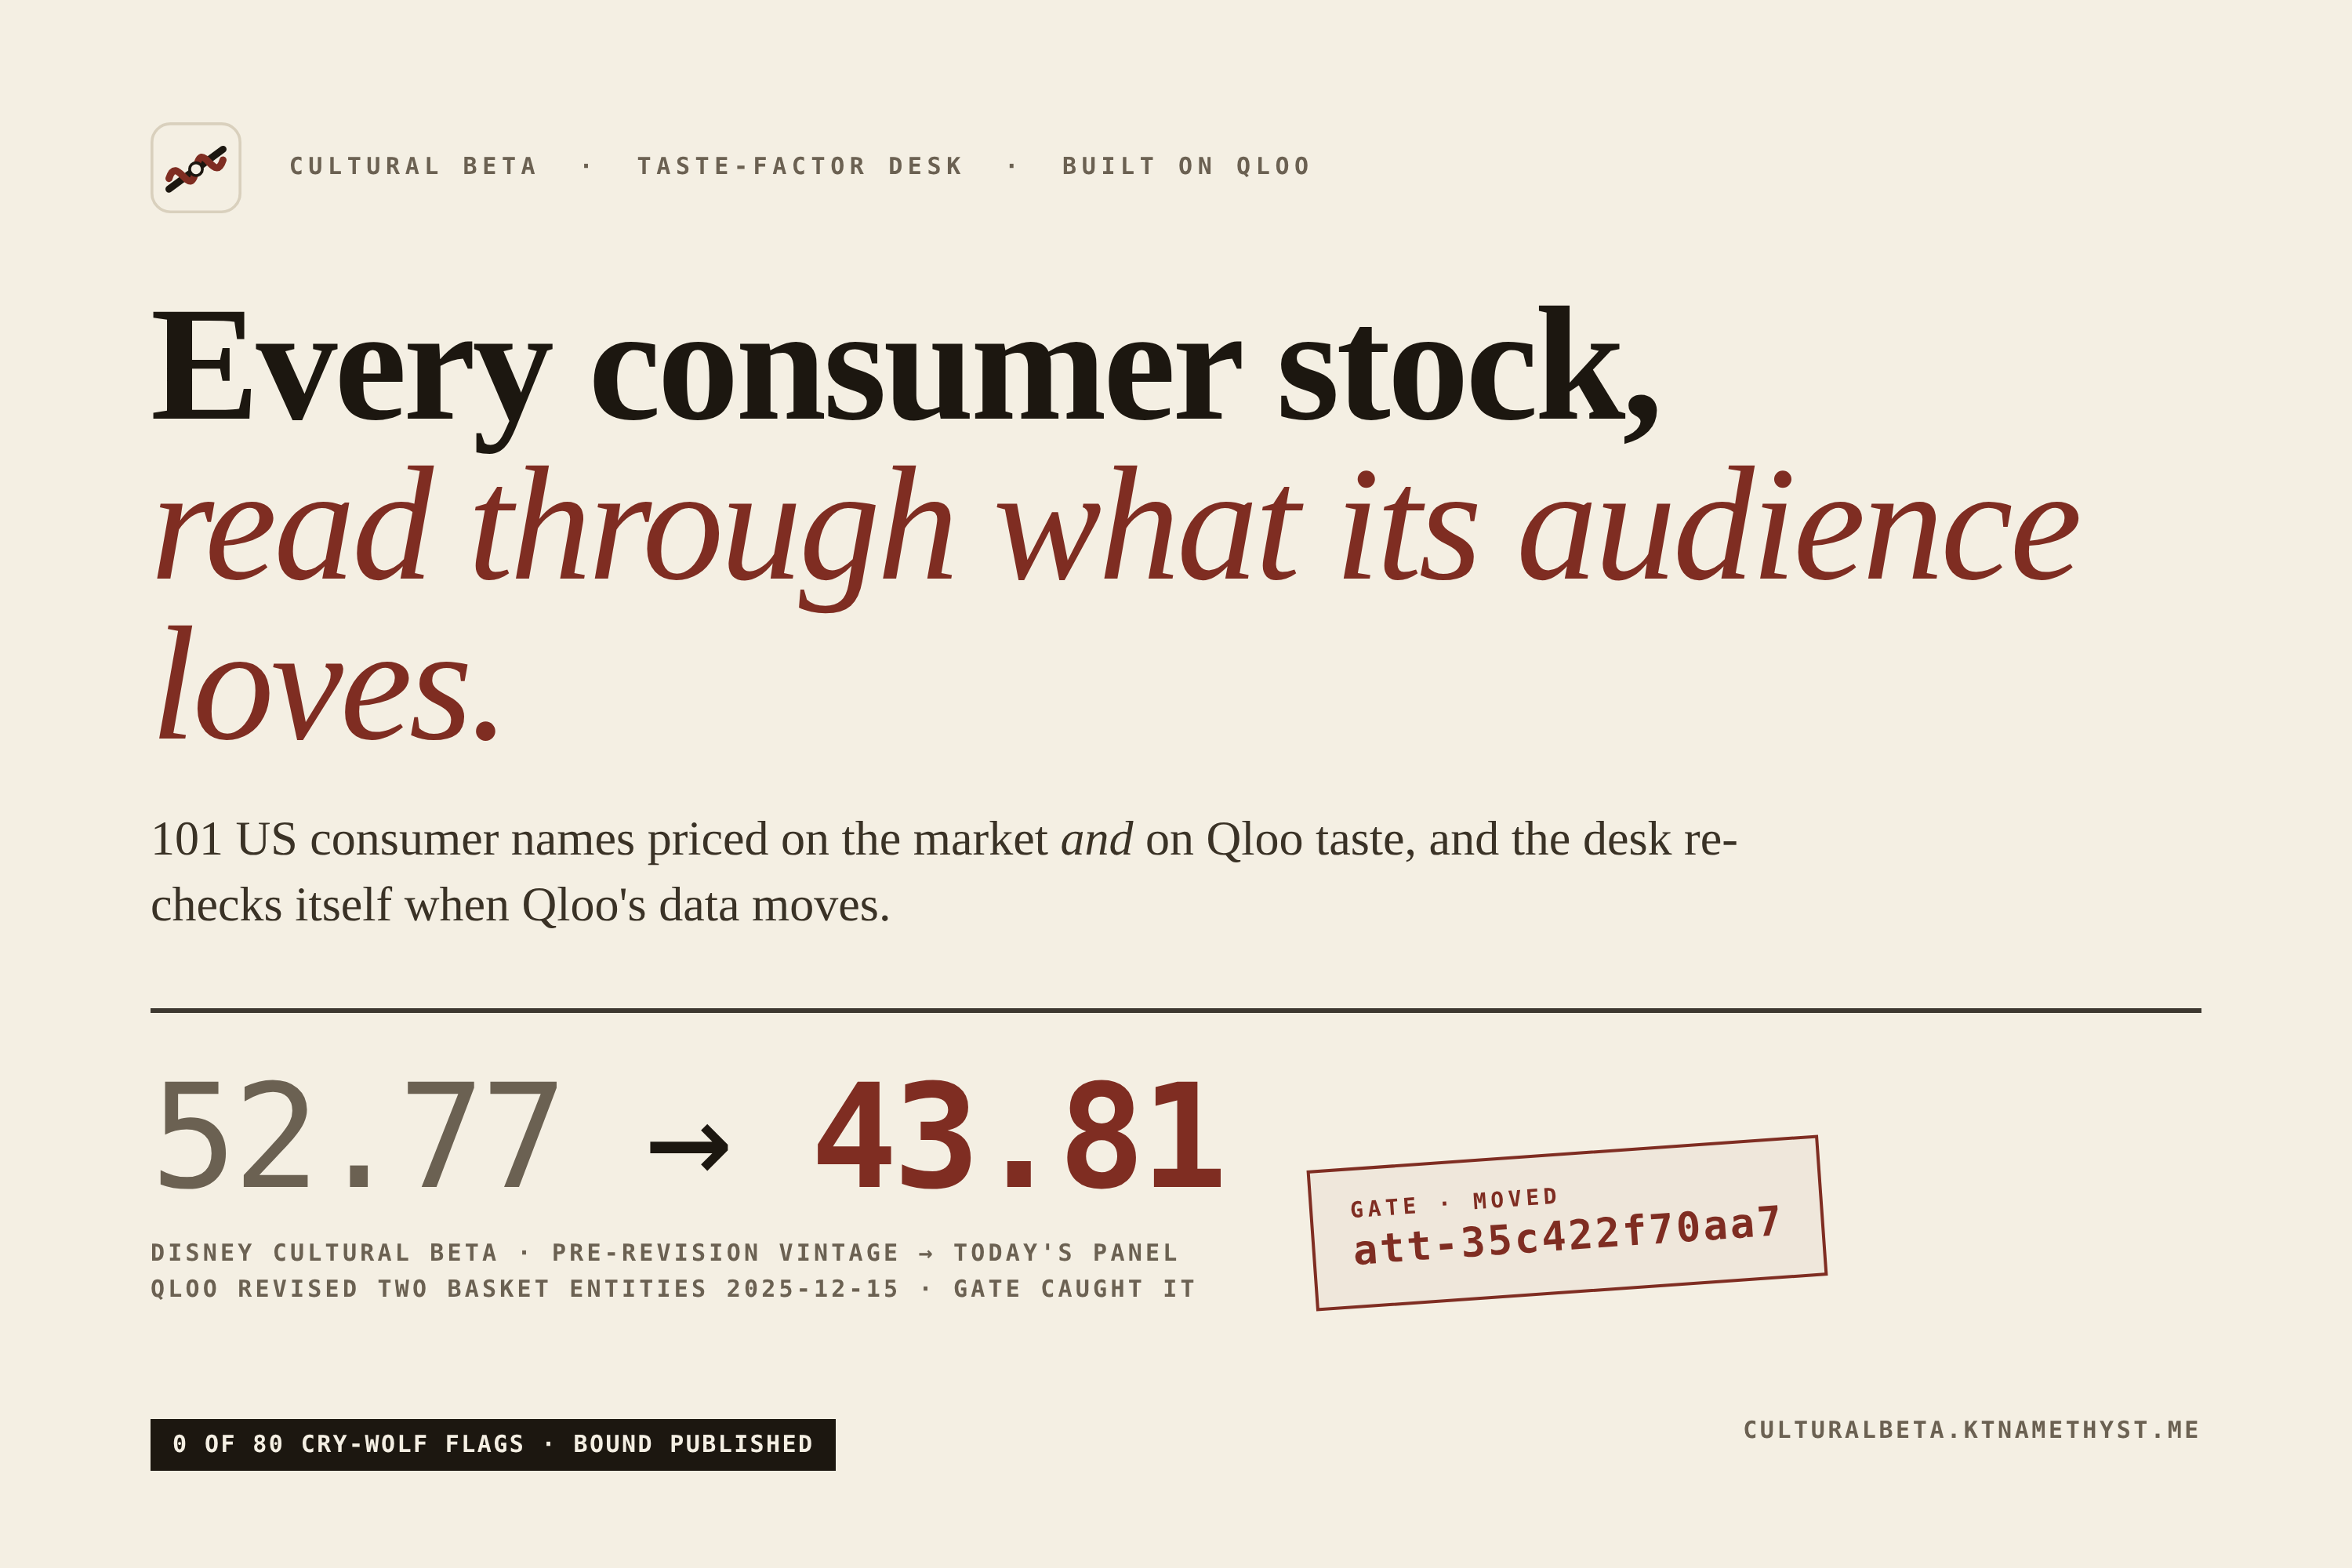
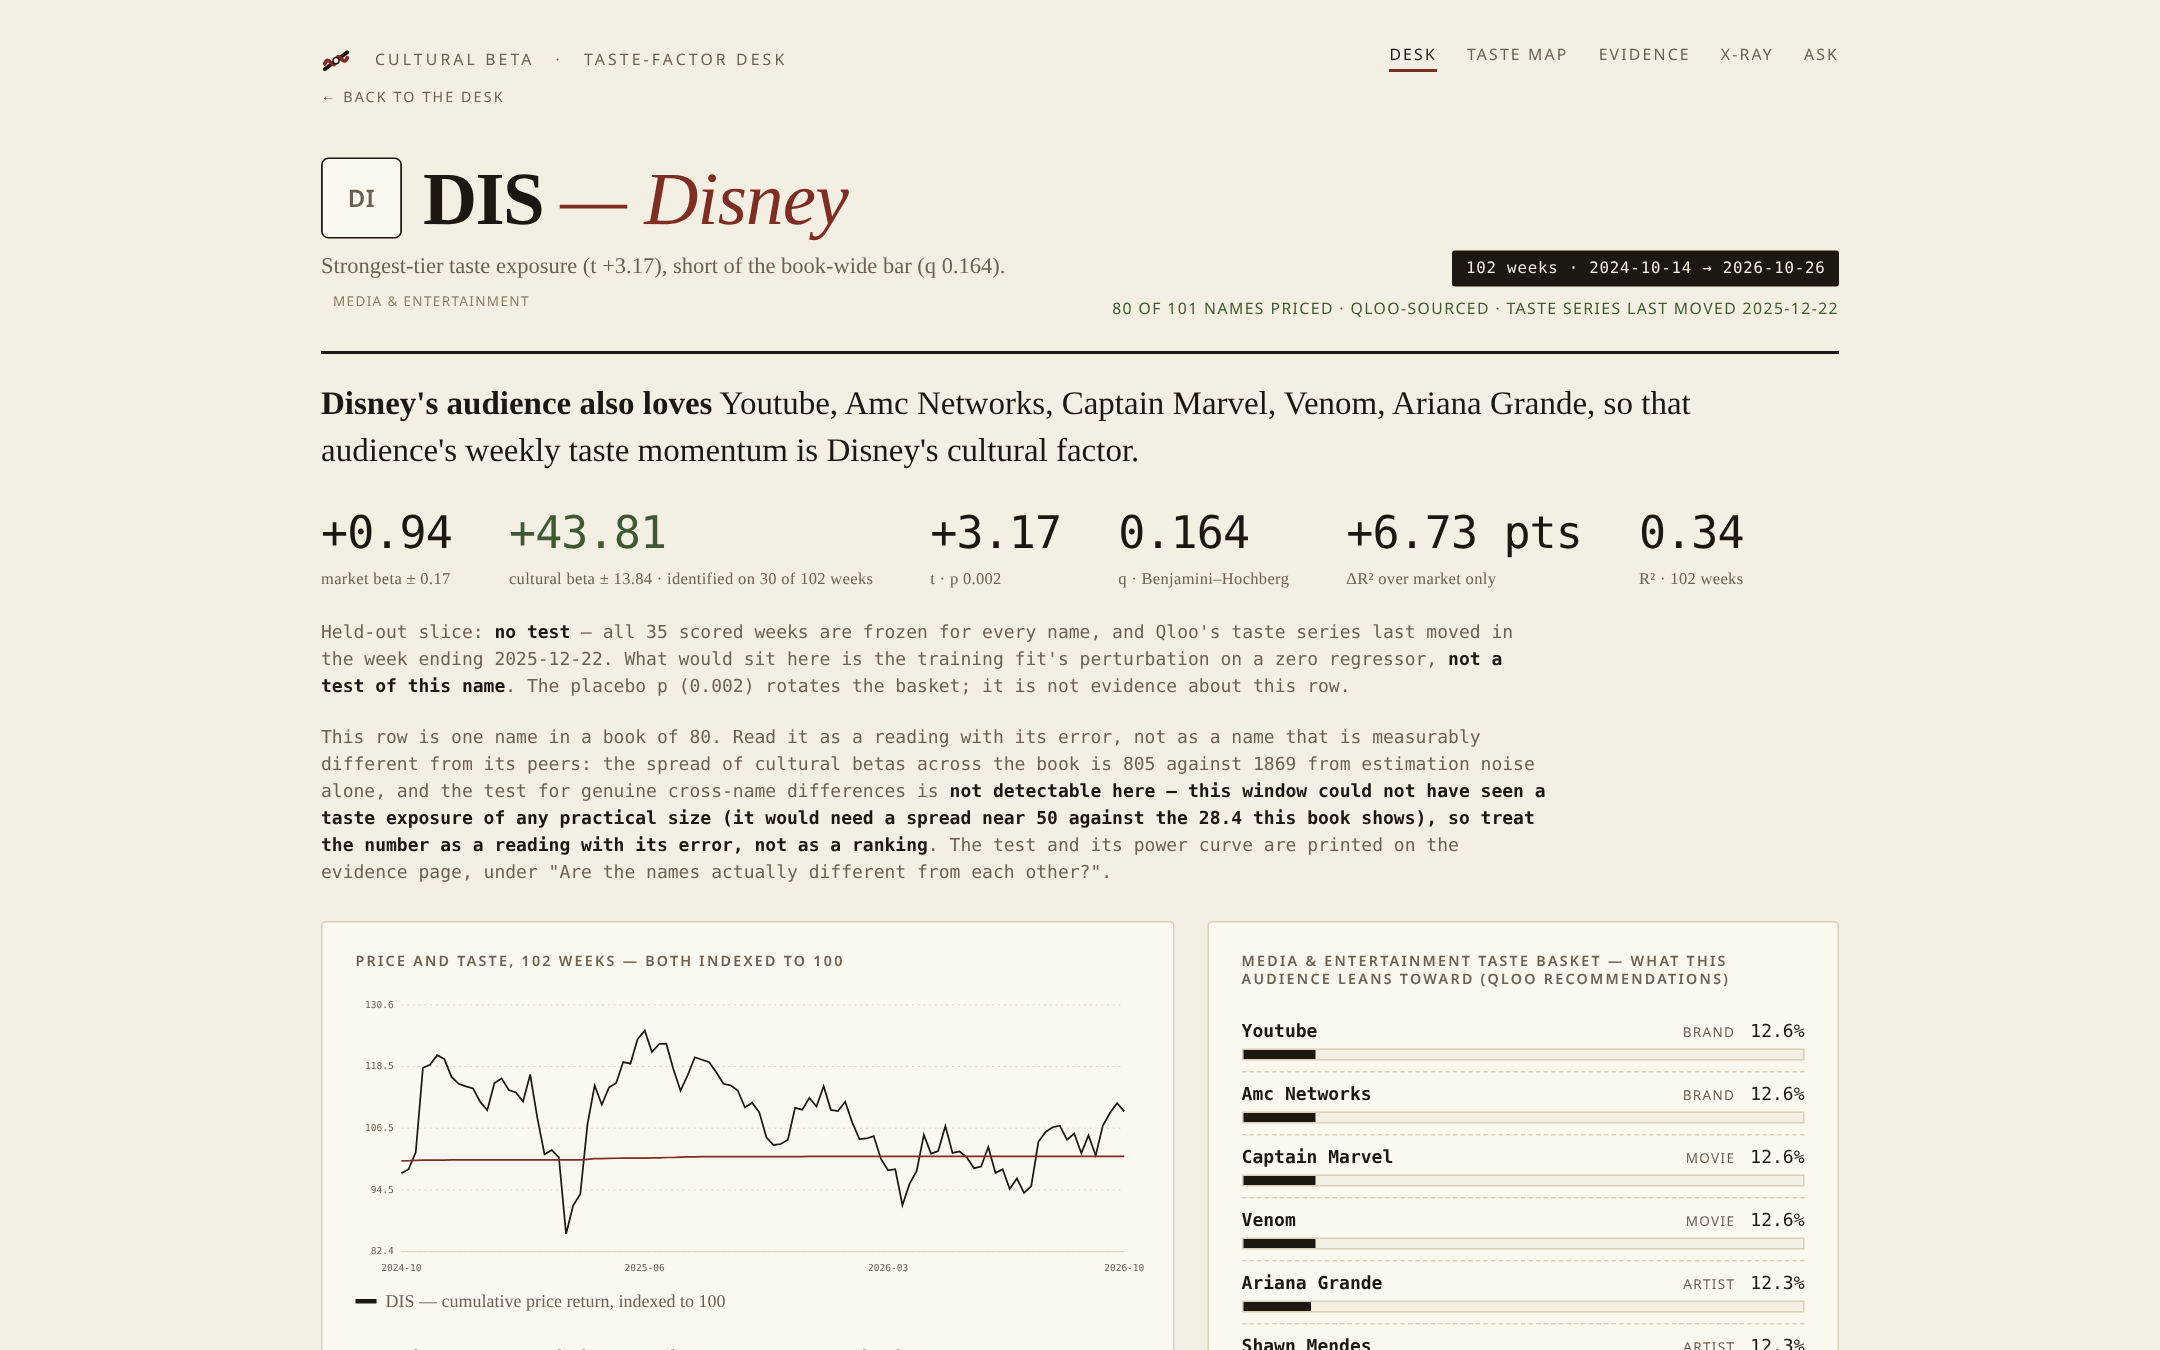
Every consumer equity model already prices one number: how a stock moves with the market. Nobody prices the second one: how much of that movement belongs to the taste of the people who buy from it. Disney's audience also loves YouTube, AMC Networks, Captain Marvel and Venom. That isn't a demographic guess; it's Qloo's affinity graph, and it moves week to week. If taste drives demand, it should leave a fingerprint on the stock. And when the taste data itself is revised, every number built on it is quietly out of date.
So we built a desk that does both: it prices taste, and it notices when the taste data moves under its own numbers.
What it does
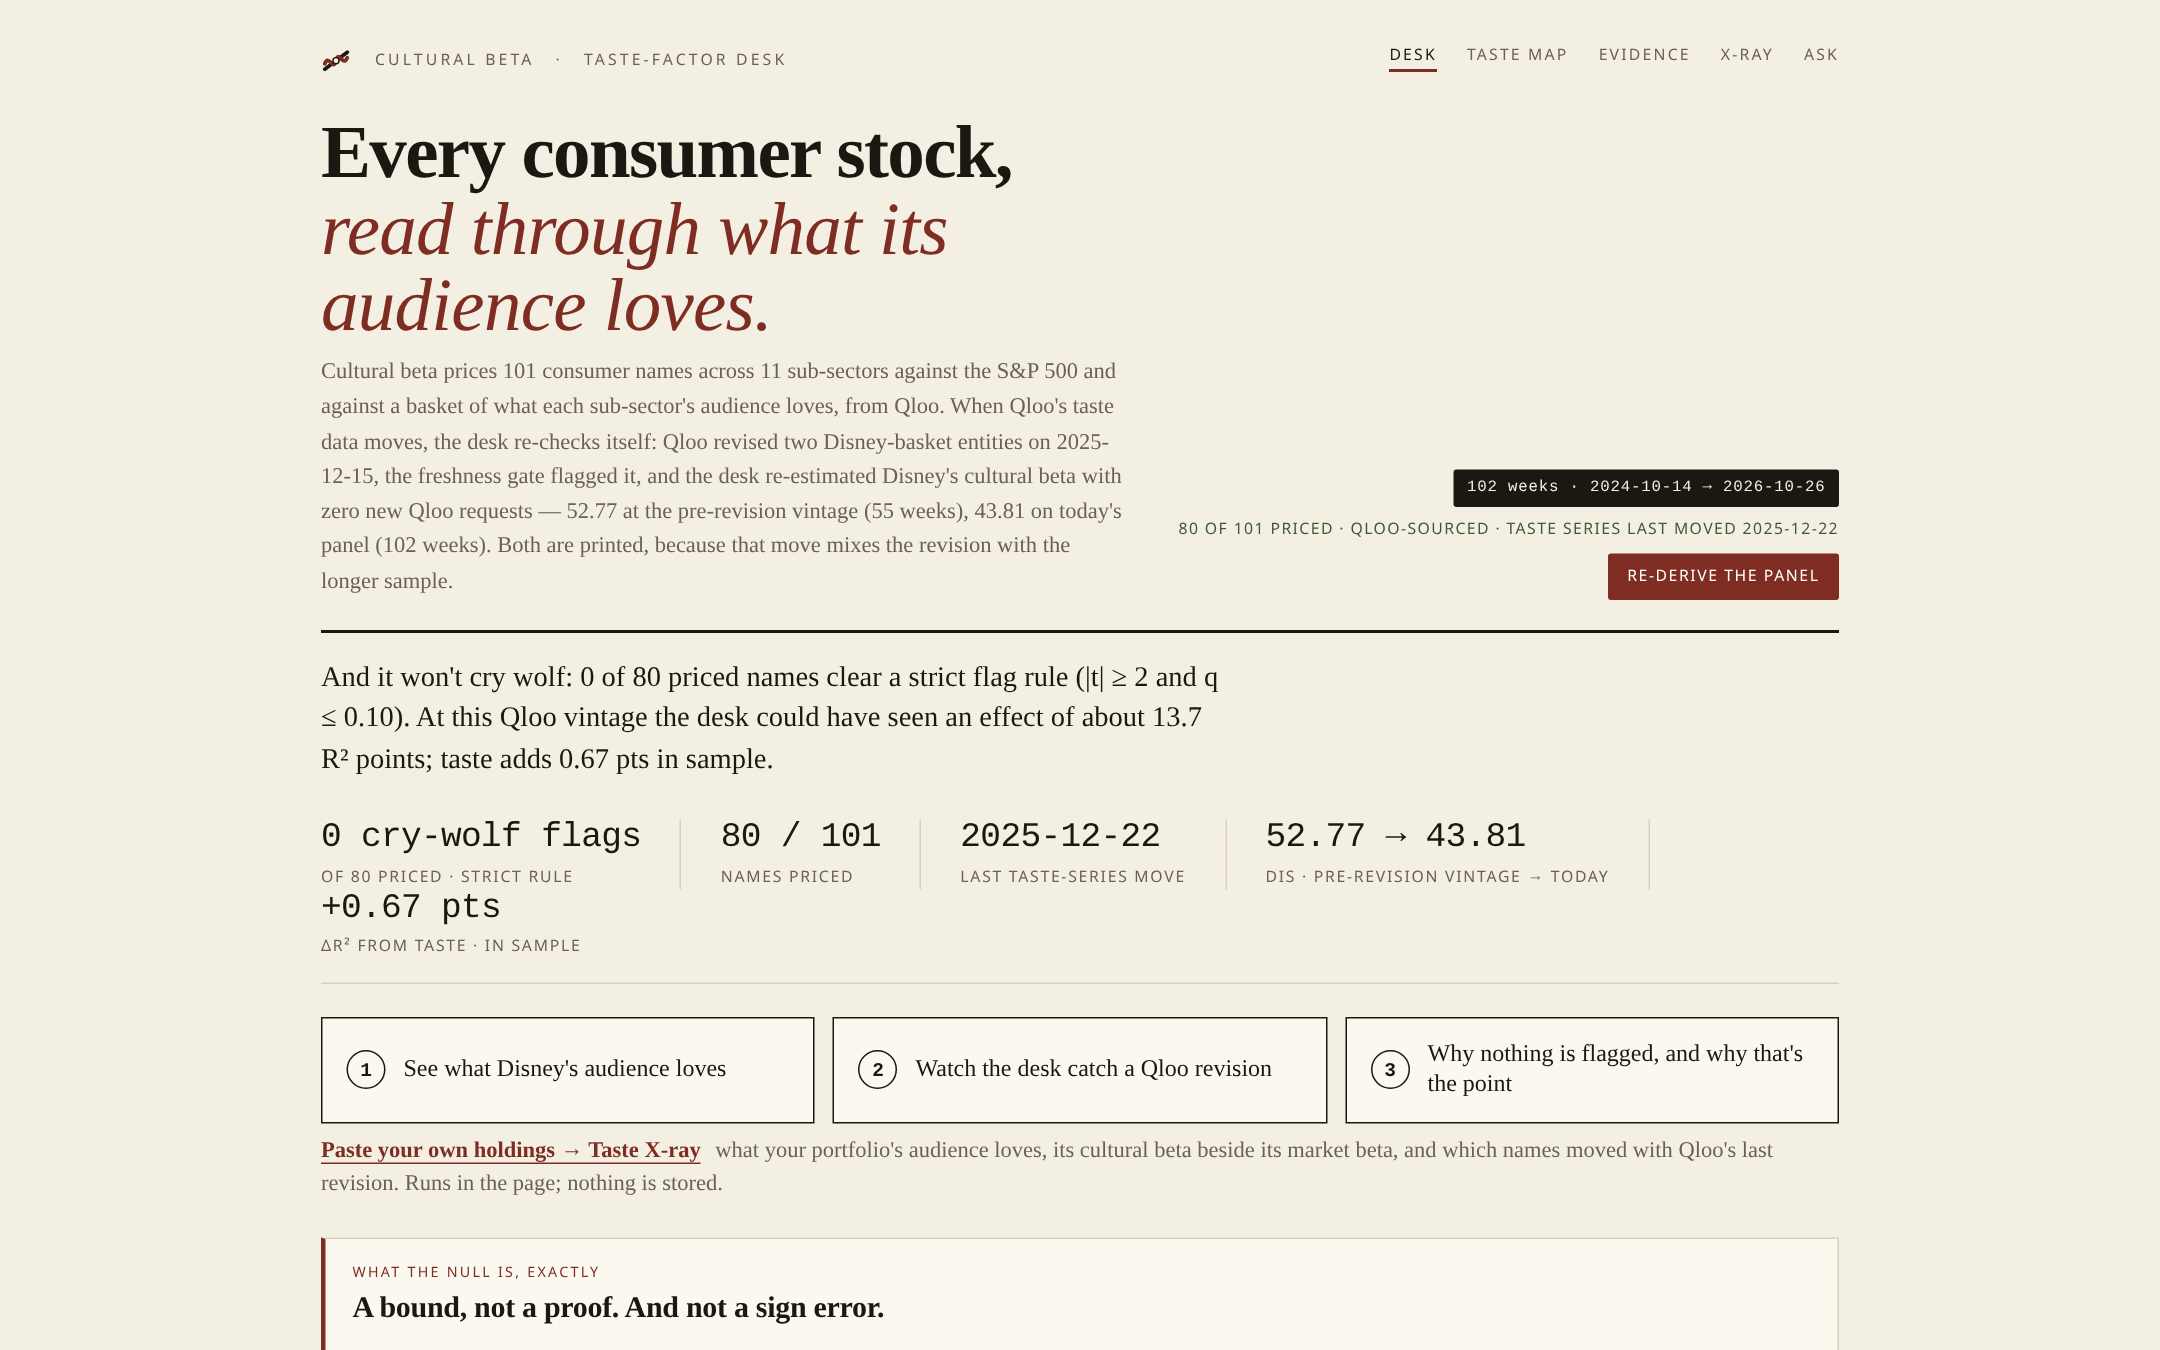
Every consumer stock, read through what its audience loves: Cultural Beta prices 101 US consumer stocks across 11 sub-sectors two ways: a market beta against the S&P 500 (SPY), and a cultural beta against a basket of what that sub-sector's audience loves, built from Qloo (/v2/insights recommendations weighted by affinity, with weekly population_percentile from /v2/trending). Every name in the book is excluded from every basket, so Disney is never priced against Disney.
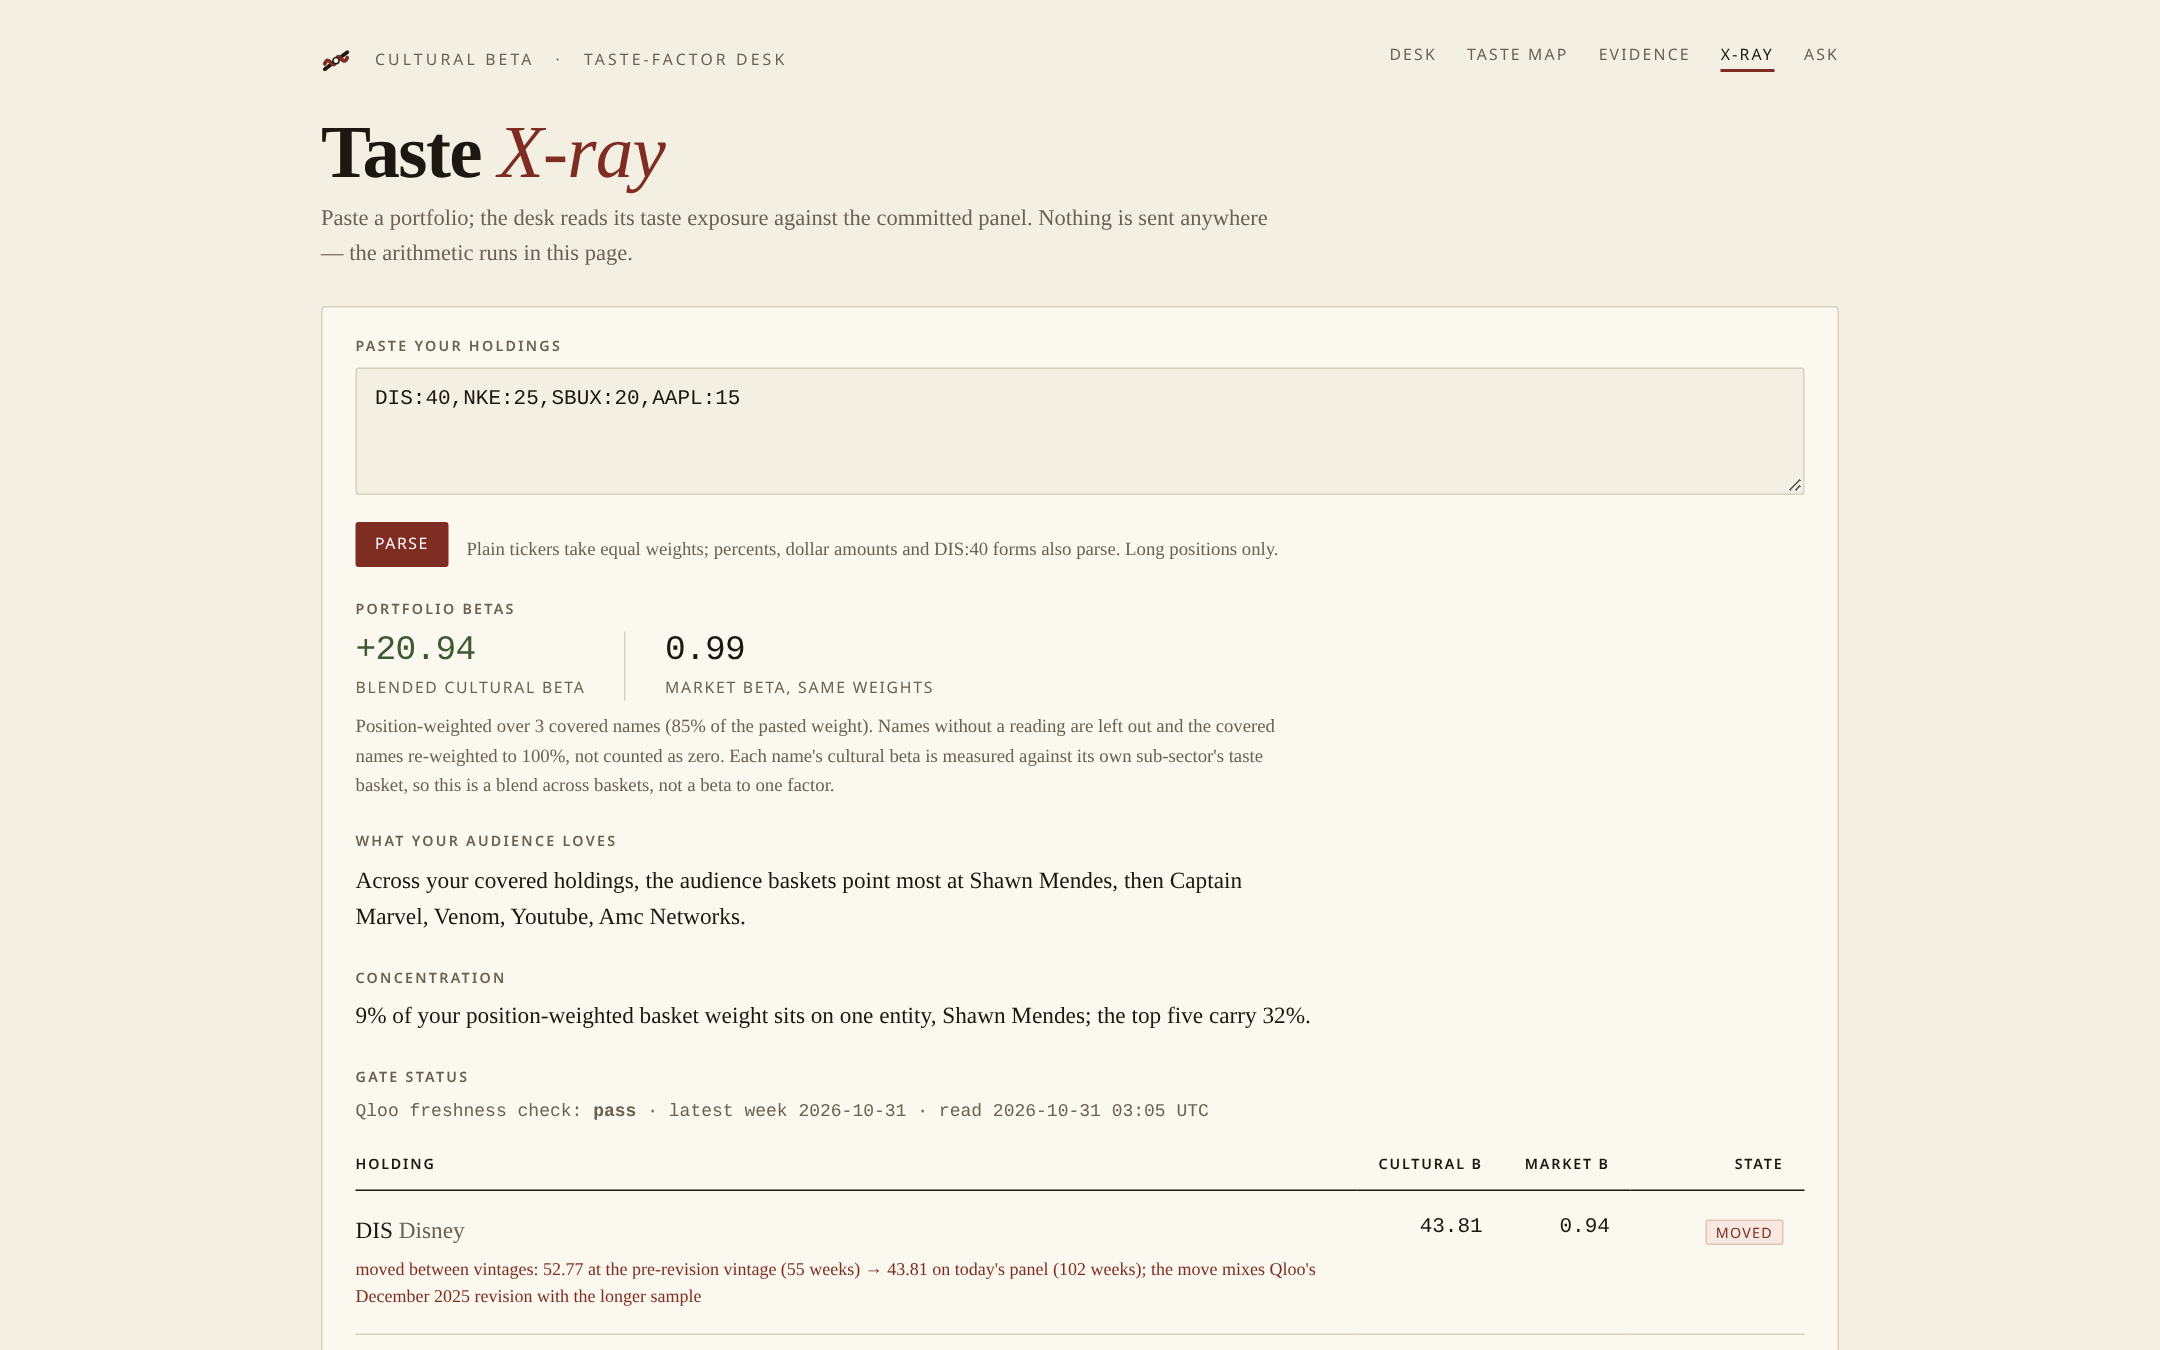
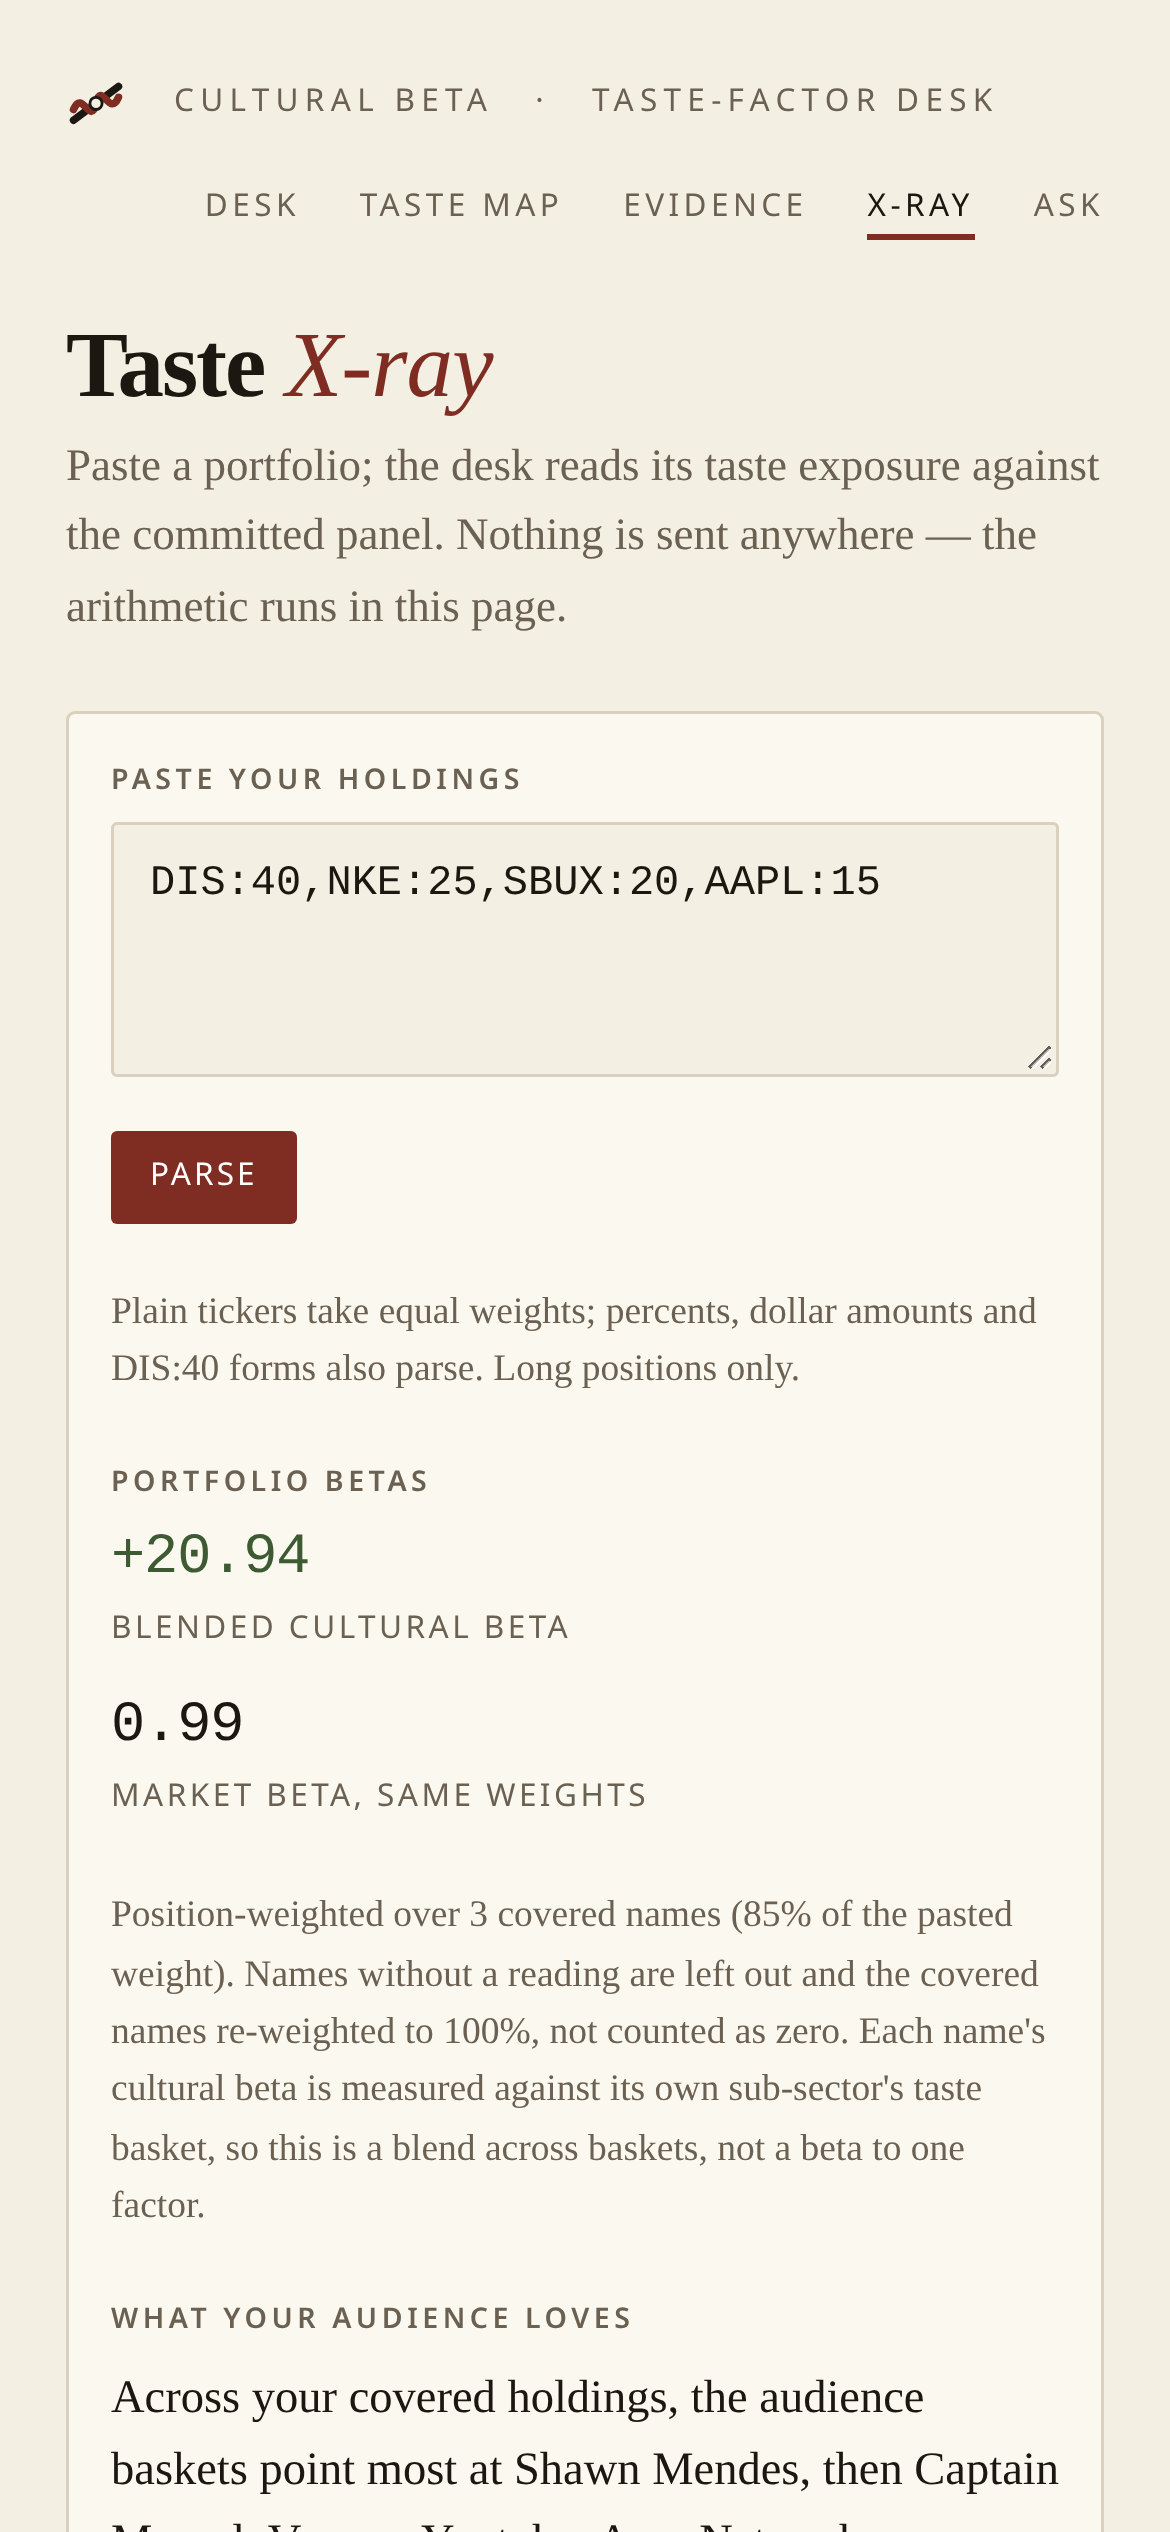
Taste X-ray: your book, through Qloo. Paste your holdings (DIS 40%, NKE 25%, dollar amounts, or plain tickers at equal weight) at #/xray. In one click you get:
- your position-weighted cultural beta next to your market beta on the same weights;
- the audience entities your positions share, weighted by position size;
- a concentration line: how much of your taste exposure sits on a single entity and on the top five;
- per-holding gate status from the live Qloo freshness check, plus the replay line for any name that moved across Qloo's December 2025 revision;
- a share link that encodes the holdings in the URL. Nothing is stored on the server.
Example, DIS:40, NKE:25: cultural beta 27.85 against market beta 0.99; the shared audience leads with Captain Marvel, Venom, YouTube and AMC Networks (about 7.8% each); the top five entities carry 38.7% of the weighted basket; and DIS shows its replay move, 52.77 → 43.81. Tickers outside the covered book are listed as "not covered", never guessed. This is descriptive exposure, not investment advice.
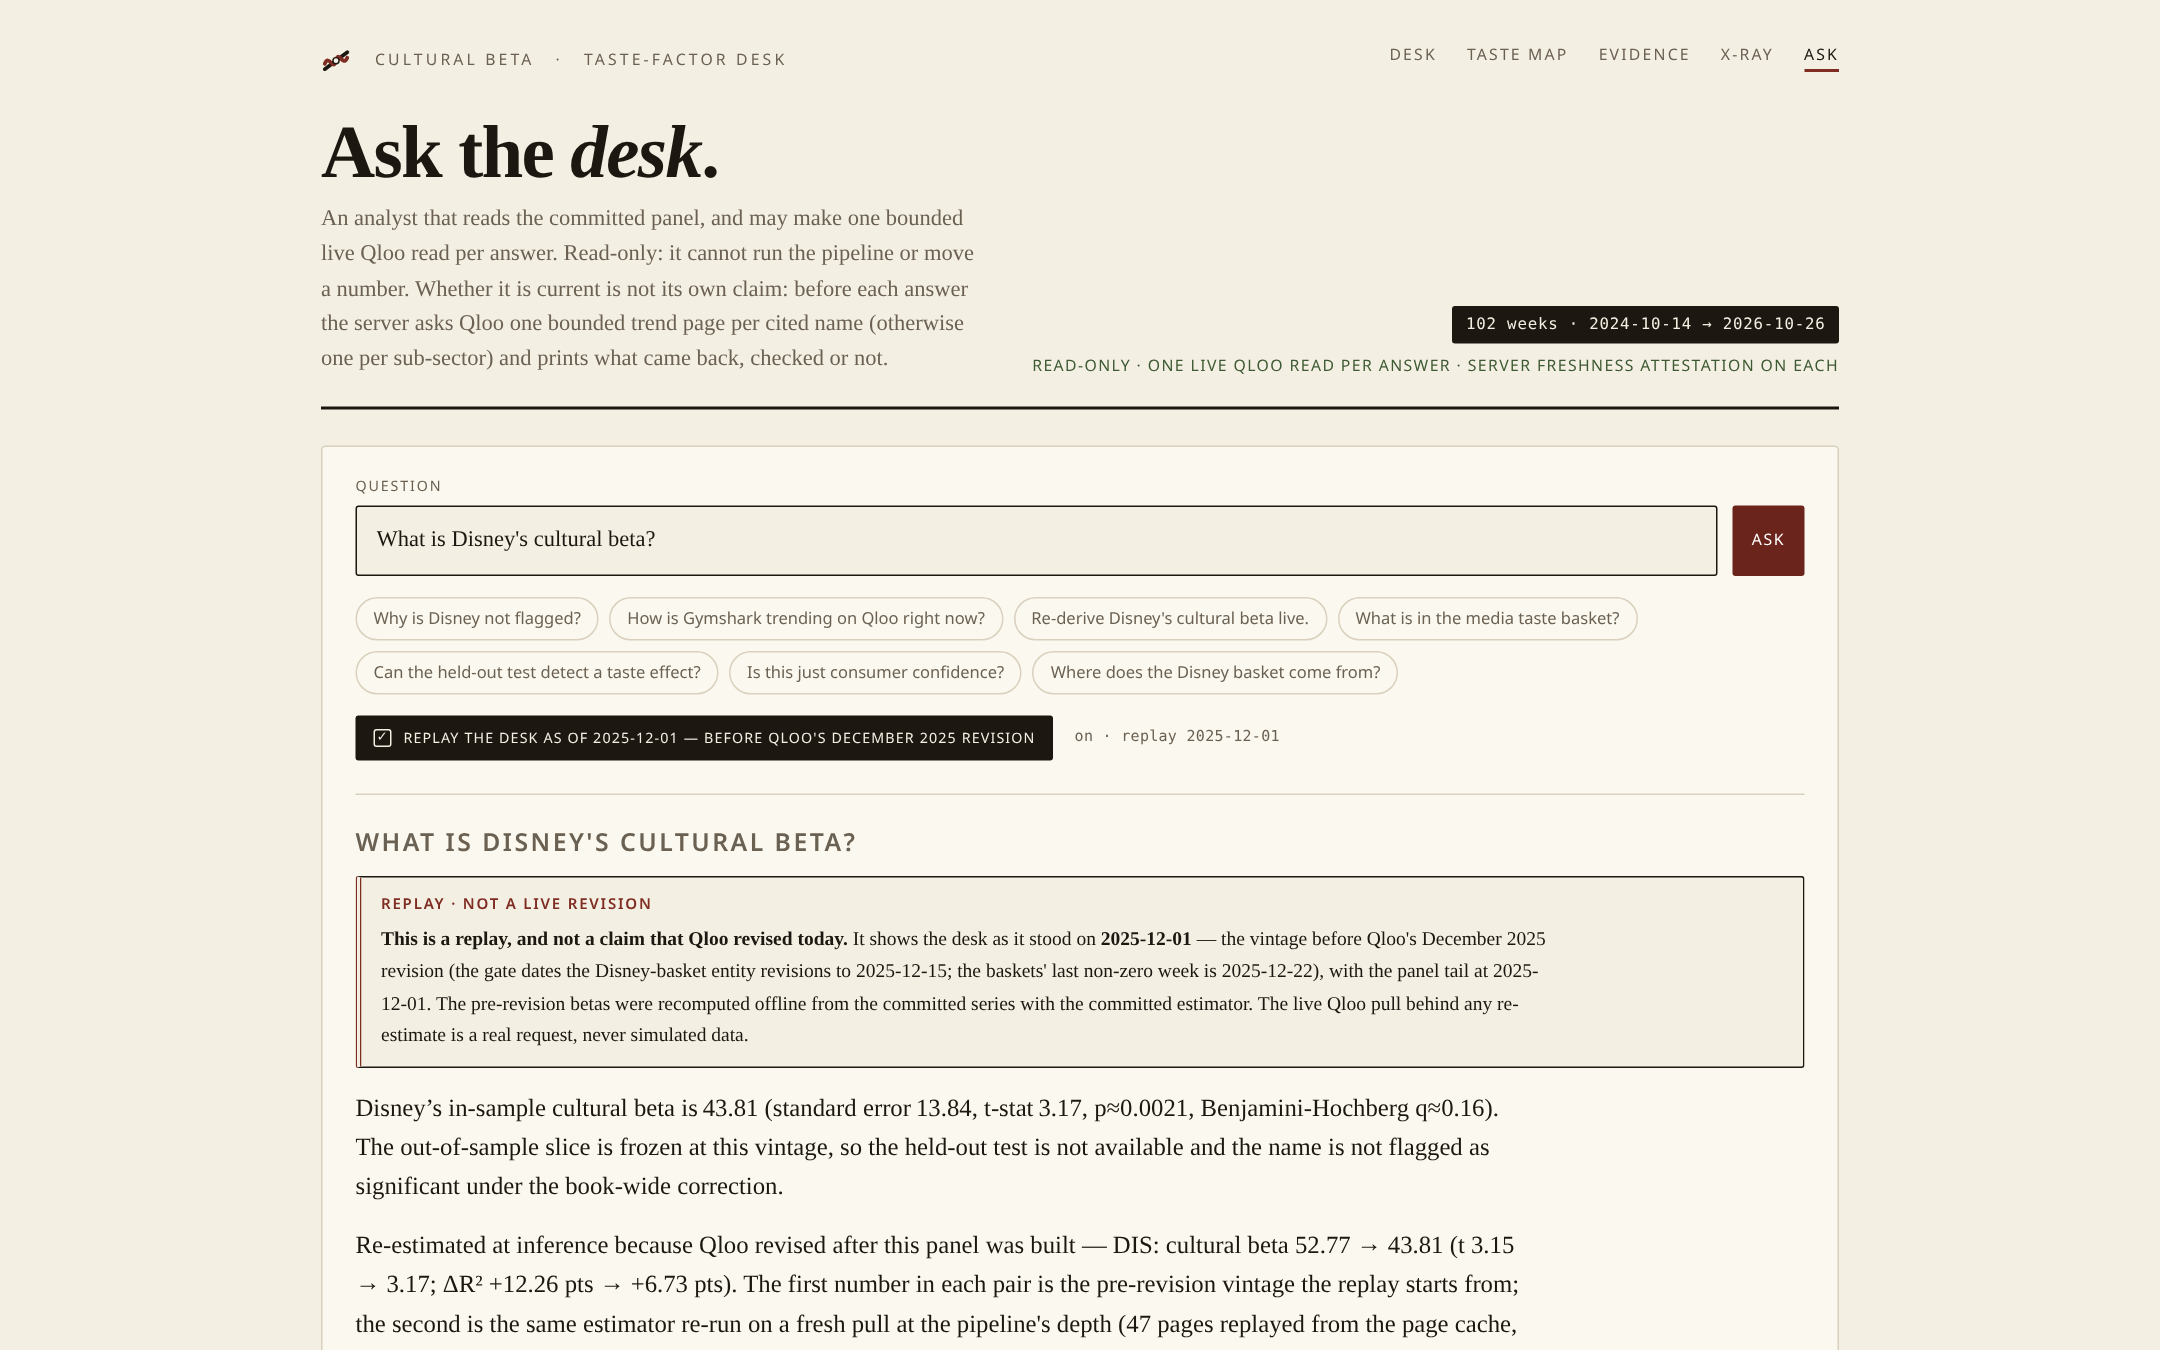
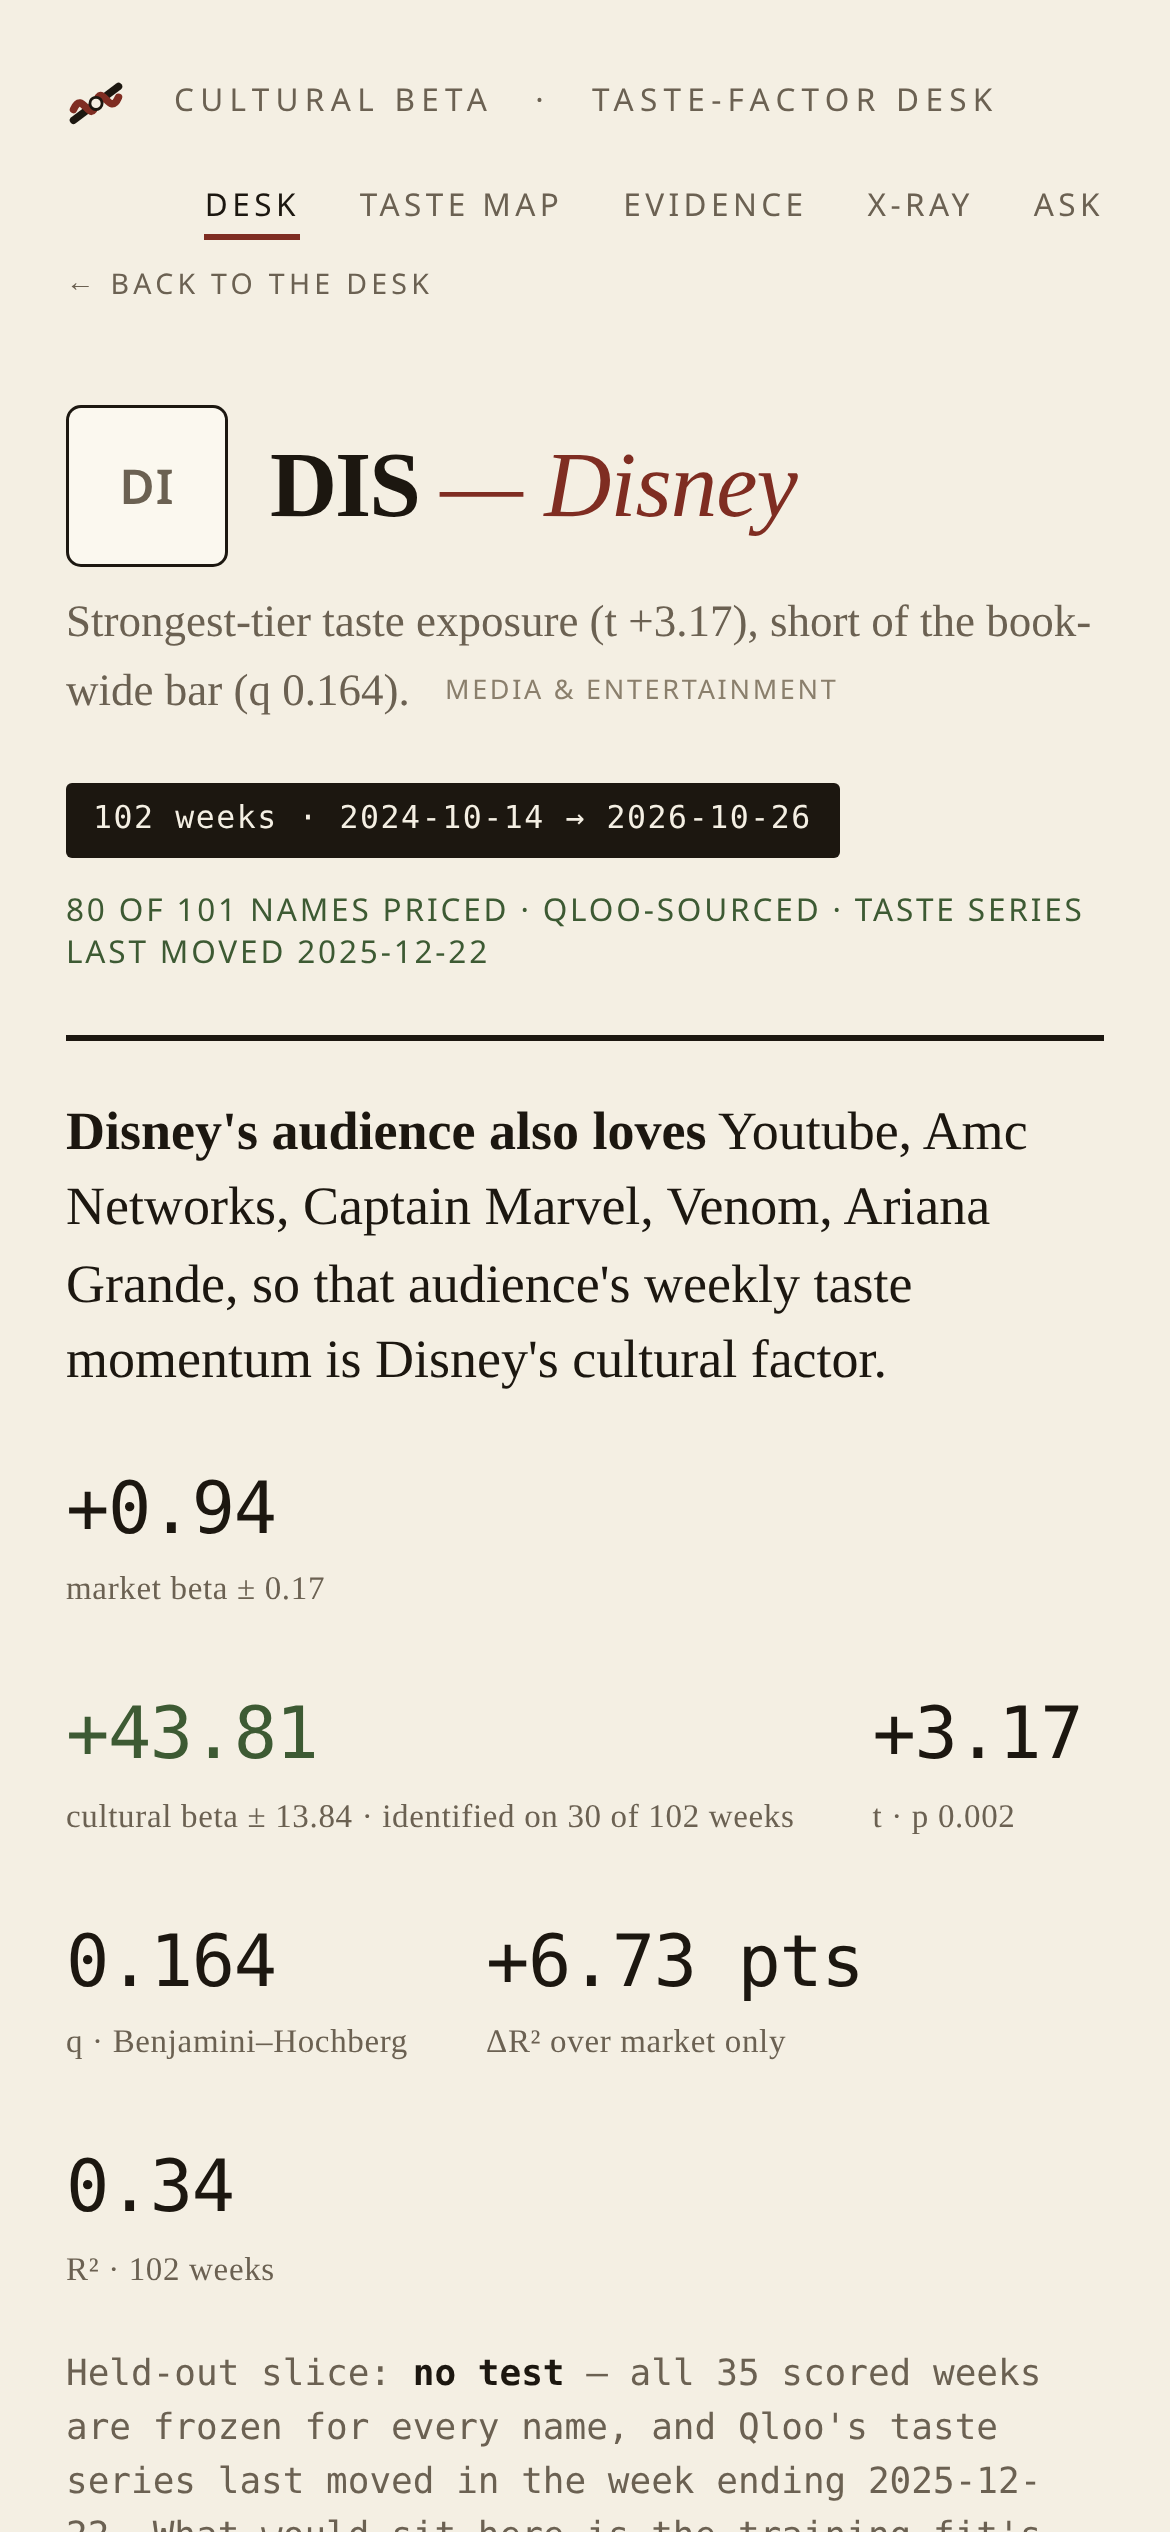
The desk notices when Qloo moves, and re-estimates: Every answer from the desk's analyst carries an att-<12 hex> stamp (SHA-256 over the visible fields) and a grade: pass, moved or unattested. On moved, the server re-runs the estimator for the affected names and prints the committed and re-estimated numbers side by side, one vintage per side. In the revision replay, the gate flags Qloo's revision of two Disney basket entities (Captain Marvel and Venom, 2025-12-15) and re-estimates Disney's cultural beta 52.77 → 43.81 (t 3.15 → 3.17, ΔR² +12.26 → +6.73 pts), stamp att-35c422f70aa7, from 47 real cached Qloo pages with 0 new Qloo requests and no simulated data. We say plainly what the replay can't do: it can't separate the revision from the change in sample length (55 vs 102 weeks), and it changed no flag.
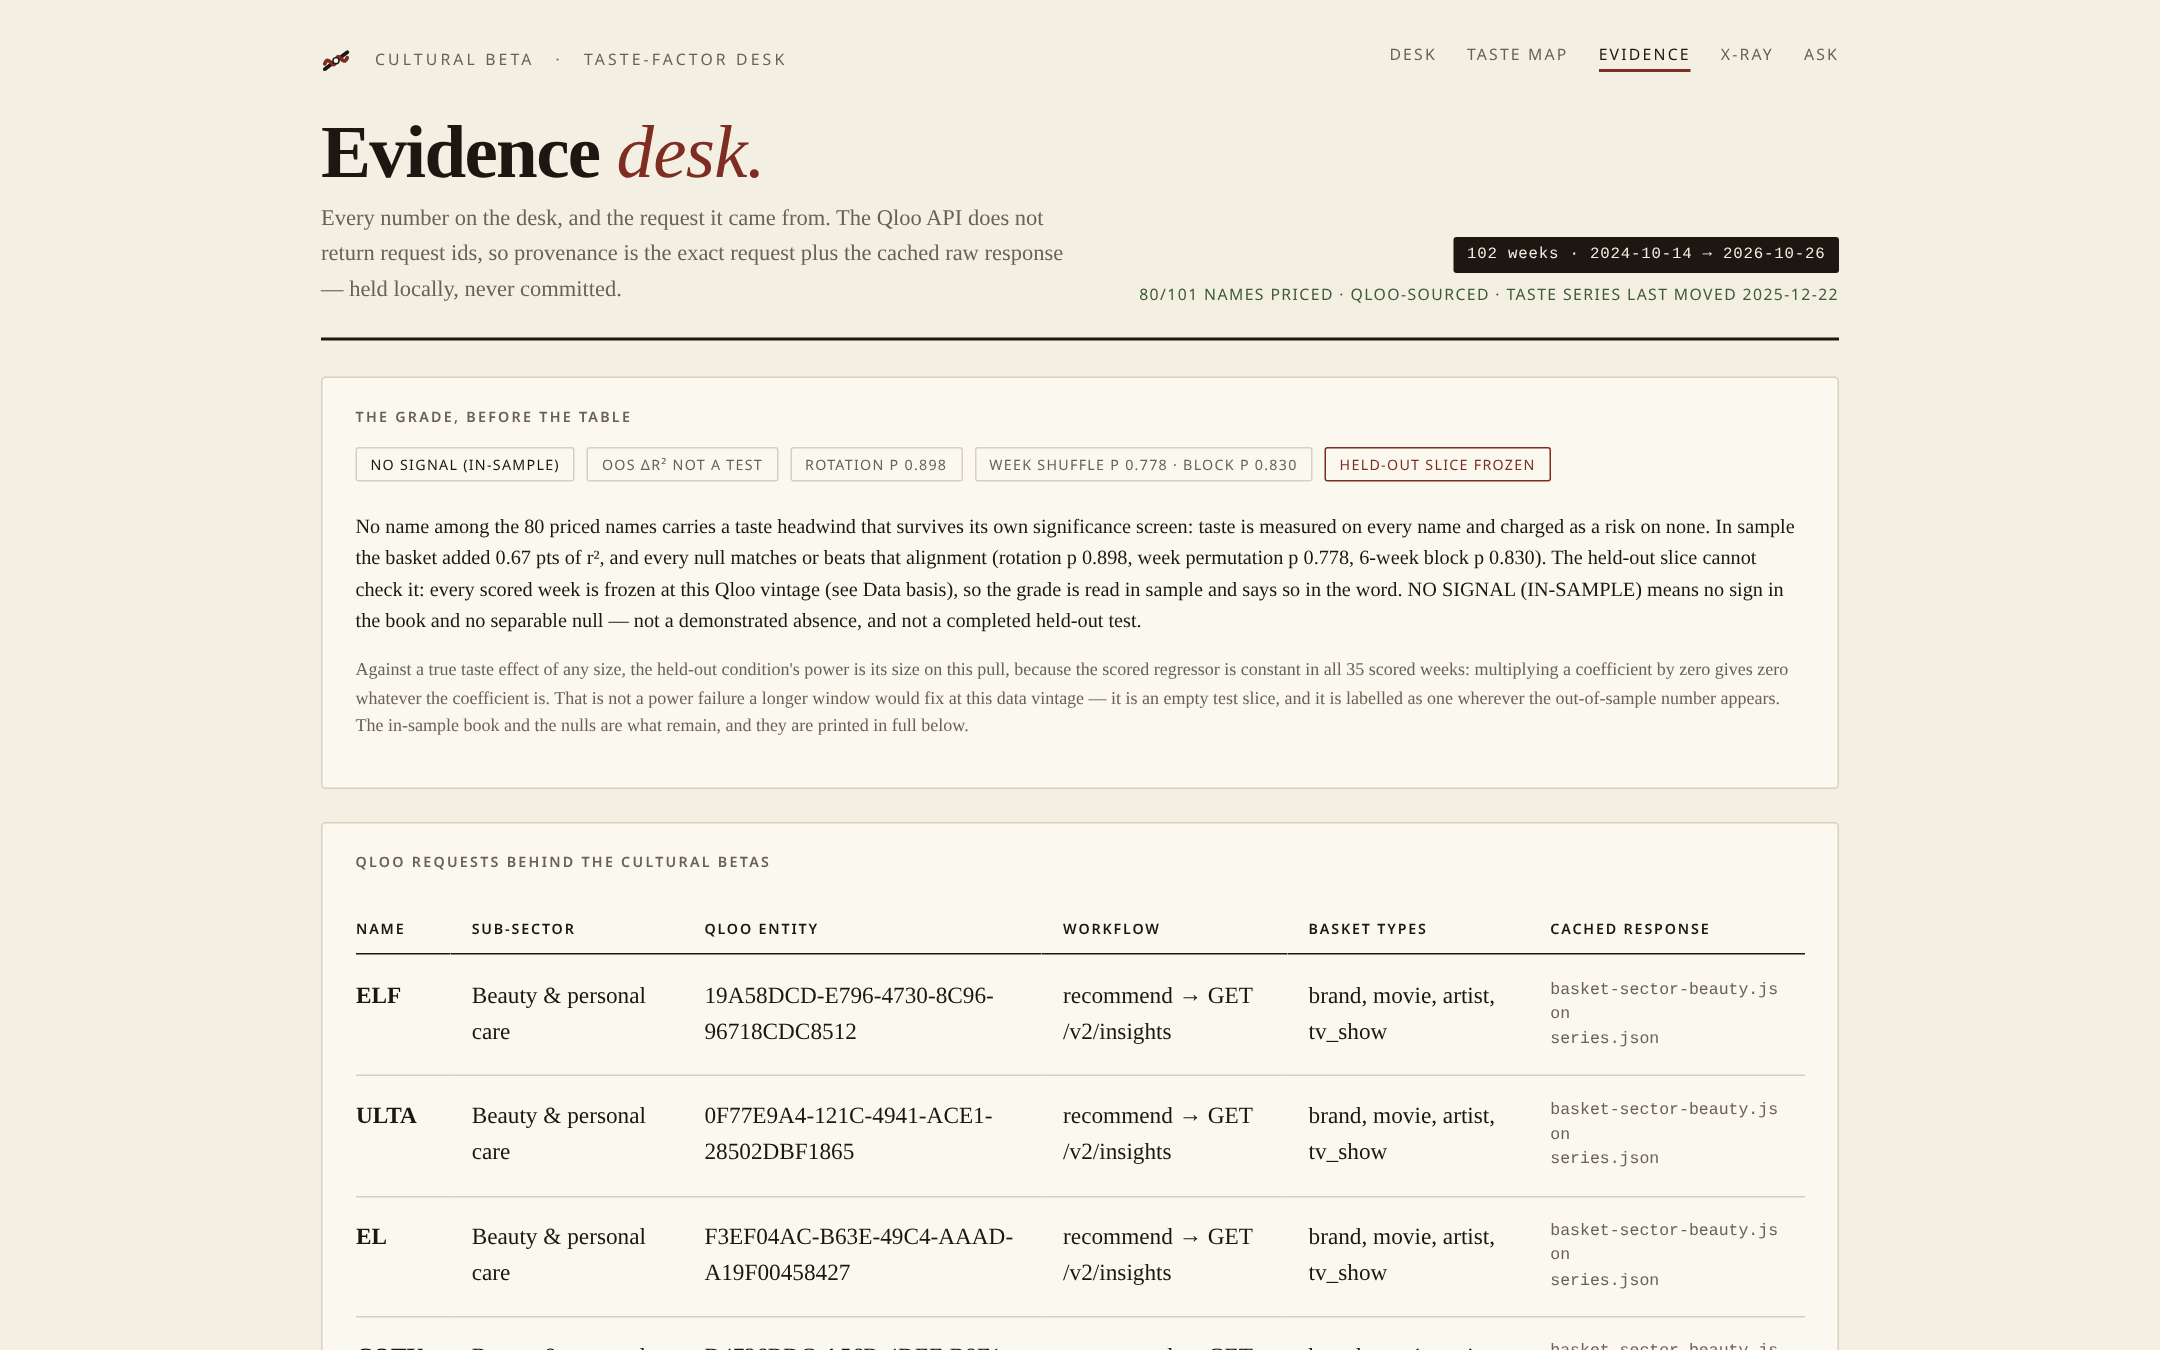
No false alarms: A name is flagged only if its taste exposure is negative, |t| ≥ 2, and it survives Benjamini–Hochberg at q ≤ 0.10 across the book. Of the 80 names with both prices and a Qloo entity, 0 clear that bar, and we publish what that means: at this vintage the design could detect about 13.66 R² points (median minimum detectable effect, IQR 12.15–14.54); the observed mean gain is 0.67 points. So "0 of 80" rules out large taste effects. It doesn't claim taste is irrelevant. Three nulls agree: rotation placebo p 0.898, week permutation p 0.778, 6-week block permutation p 0.830. Disney is the strongest reading (t 3.17, q 0.164): the strongest tier of taste exposure on the desk, shown with its error and short of the book-wide bar.
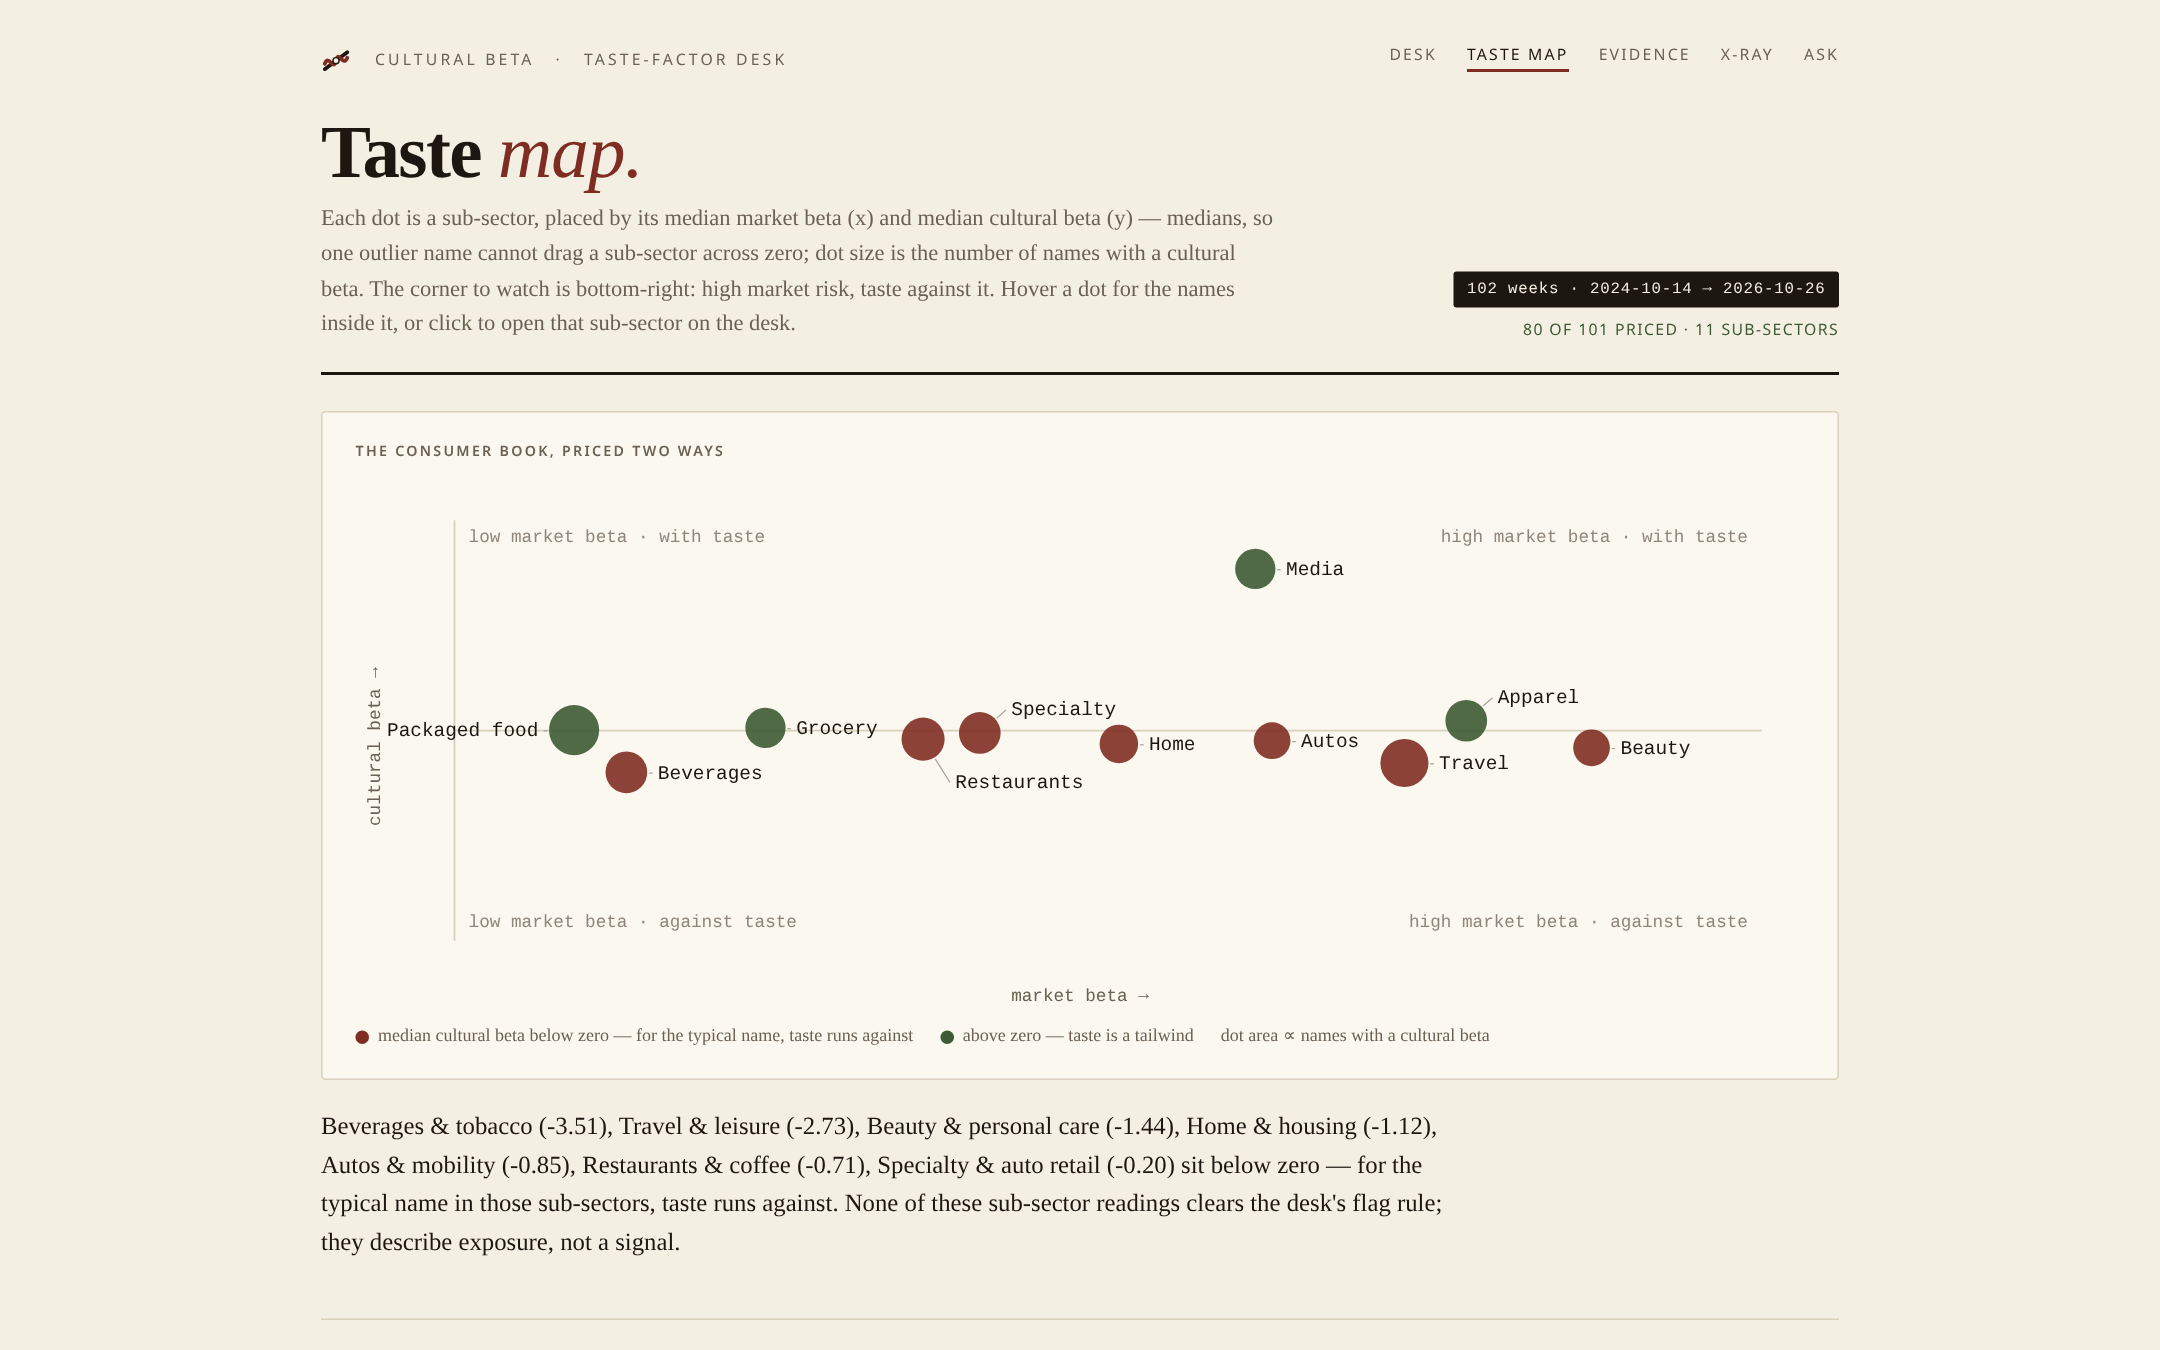
Surfaces: A "Start here" strip on the landing page walks a first-time reader through three steps. Desk (the sortable book) · Holding (opens with what the audience loves, then both betas, errors and q) · Taste map (sub-sectors by median cultural beta; media sits at +13.63, so one outlier can't drag the sector) · Evidence (every number and the Qloo request behind it) · X-ray (your holdings) · Ask (an analyst that reads the panel, makes one bounded live Qloo read per answer, and shows its receipts). A versioned public API (/api/v1/panel, /api/v1/holding/ELF, /api/v1/alerts, /export/panel.csv) makes curl a legitimate way to judge it.
Who it's for
Consumer-sector portfolio managers and research analysts, and retail investors who want to see their book's hidden taste concentration. Paste your holdings into the Taste X-ray and in ten seconds you see your position-weighted cultural beta beside your market beta, the audience entities your positions share (DIS 40 / NKE 25 leans on Captain Marvel, Venom, YouTube and AMC Networks; the top five entities carry 38.7% of the weighted basket), and which holdings Qloo's data has moved under. Two holdings in different sectors can share one audience; this is the first view of that overlap, and it only exists because Qloo's affinity graph exists. Descriptive exposure, not investment advice.
How we built it
- Qloo, properly. Every Qloo call goes through
@qloo/qloo-harnessin one transport module. Search resolves each company to a Qloo entity,/v2/insightsbuilds each sub-sector's audience basket (brands, movies, artists, TV shows), and/v2/trendingsupplies the weekly taste series. Calls are cached per page hash, capped, and behind a journaled daily budget. - Estimator. Per-name OLS of 102 aligned weekly returns (2024-10-14 → 2026-10-26) on SPY plus the sub-sector taste basket; Benjamini–Hochberg across the book; placebo, permutation and block-permutation nulls; a peer-basket ablation; basket sensitivity; and a power analysis published beside the result.
- The freshness gate. Before each answer, the server reads one bounded Qloo trend page per cited name, hashes it into an
att-stamp, caches it, and grades the answer. Onmovedit re-runs the estimator for the affected names. The server writes those numbers, never the model. - Revision replay. The whole desk re-run at the 2025-12-01 vintage (55 weeks) against the committed 102-week panel, from real cached responses, with integrity checks that the post-revision side equals the published desk exactly.
- Taste X-ray. Client-side, from the same committed rows the desk shows: position weights renormalised over covered names, basket entity weights accumulated by position, the gate read from the live freshness endpoint. Zero billable Qloo calls, and nothing stored.
- The agent. Read-only tools (desk summary, one holding, a sub-sector basket, the weekly taste series, the nulls, Qloo provenance) plus two bounded live tools. It can't change a committed number.
- Checked like a product. Unit tests with no network or key, plus a Chrome DevTools Protocol browser audit across routes and three viewports, with every check committed under
review/. Node behind nginx and systemd.
Challenges we ran into
- Qloo's series stops moving, and the code had to notice. In this pull the taste series last moved on 2025-12-22, and the later weeks carry forward. Our held-out window landed inside that frozen tail, so we removed the per-name out-of-sample numbers and print "no test" instead. That discovery is why the freshness gate exists.
- Entity resolution. 18 of 101 companies didn't resolve to a Qloo entity. They carry no beta rather than a guessed one, and their searches are printed.
- Provenance without a request id. Qloo returns none, so we show the exact request, the cached response and correlation ids on every answer.
- Honest is harder than flattering. Every surface was rewritten so a bound reads as a measurement, not a bug.
Accomplishments that we're proud of
- Qloo is load-bearing at inference, not just in a batch job. Without Qloo there's no basket, no cultural beta, no X-ray, no stamp and no re-estimate.
- A real person gets a real answer about their own book in ten seconds, with every number traceable to the desk.
- The gate re-estimates on real data: a real Qloo revision to real Disney basket entities, a stamped server-authored re-estimate, 0 new requests.
- A null result a reviewer can use: 13.66 pts detectable vs 0.67 observed, about 2,201 weeks for 80% power on the observed effect, and a dated re-test commitment.
What we learned
Taste data is a living dataset. Revisions are normal, and a model built on it is only as current as its last check. The most valuable thing an analyst can say about taste data is "this moved since I last read it"; the second is "this can't tell you that yet." And Qloo's audience baskets are remarkably legible: you can read a sub-sector's culture off eight names.
What's next for Cultural Beta
- X-ray from a brokerage export: drop a CSV and get the same read, still stored nowhere.
- Live entertainment: Live Nation, Madison Square Garden and Spotify, where taste moves fastest.
- Scheduled re-test: within 10 business days of the first Qloo vintage after 2026-10-31 that moves percentiles; if none does, we publish "still frozen" on 2027-01-31.
- Alerts on
moved: a weekly note of which holdings' taste baskets Qloo revised, with before and after.
Cultural Beta is a research and measurement tool. It does not give investment advice.
Built With
- benjamini-hochberg
- chrome-devtools-protocol
- css3
- csv
- html5
- javascript
- llm-agents
- nginx
- node.js
- ols-regression
- permutation-tests
- qloo-api
- qloo-harness
- rest-api
- sha-256
- statistics
- systemd
- tool-calling
