-
-
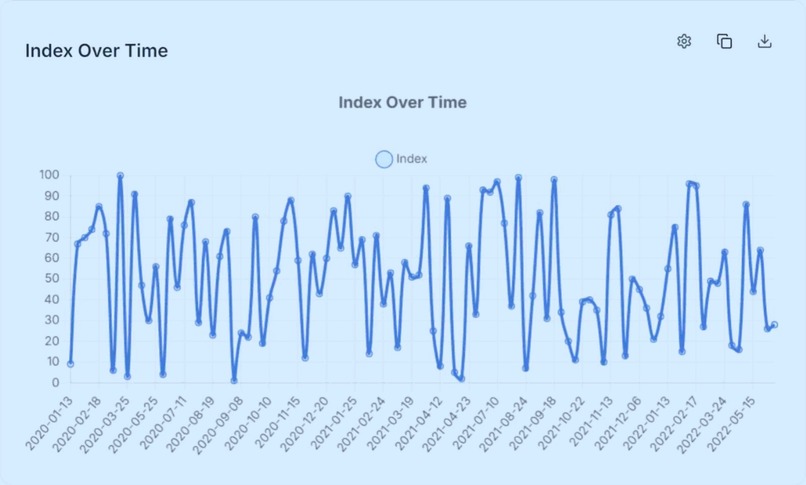
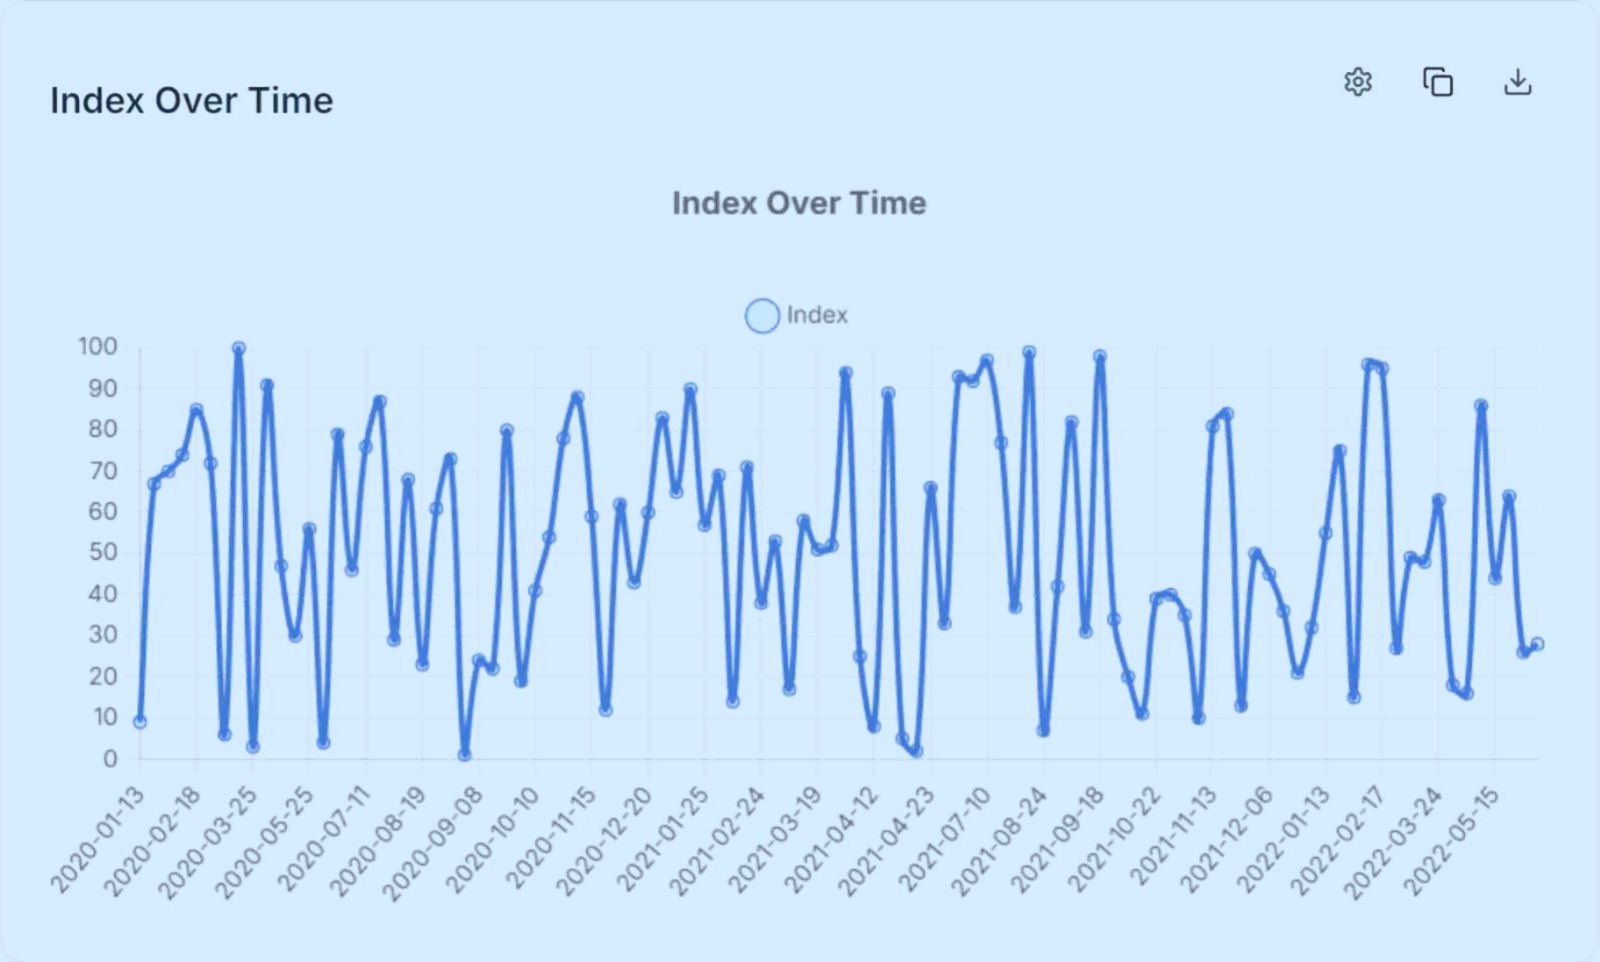
Exported data visualization image
Inspiration
I wanted a simple way to understand CSV data without diving into spreadsheets or writing code—just upload and get insights.
What it does
Takes the data and visualizes it in multiple ways - bar chart, line chart, scatter plot, pie chart, doughnut chart. Users can also export the visualizations to images or directly copy it to clipboard.
How we built it
Using single prompt 'make a csv analyser using AI which visualizes data and allows user to export the visualizations'
Challenges we ran into
Had to make multiple instances of projects to make it run in one prompt but it worked the 3rd time
Accomplishments that we're proud of
It works with perfect UI and was made with only one prompt
What we learned
CSV parsing edge cases are endless and painful. Even simple tools can deliver real value if focused on clarity.
What's next for CSV Data Analyser
By integrating OpenAI, Smart CSV Analyser will evolve from simply displaying data to actually explaining it. Users will get instant, plain-English insights—like having a lightweight data analyst built in. This unlocks real value for non-technical users and paves the way for premium features and B2B integrations. Next, I plan to implement full AI-driven analysis, store processed data for deeper historical insights, and add inline commenting with collaborative annotations to make data review a shared experience.
Built With
- react
- tailwind
- typescript


Log in or sign up for Devpost to join the conversation.