Crystal Growth Predictor
Inspiration
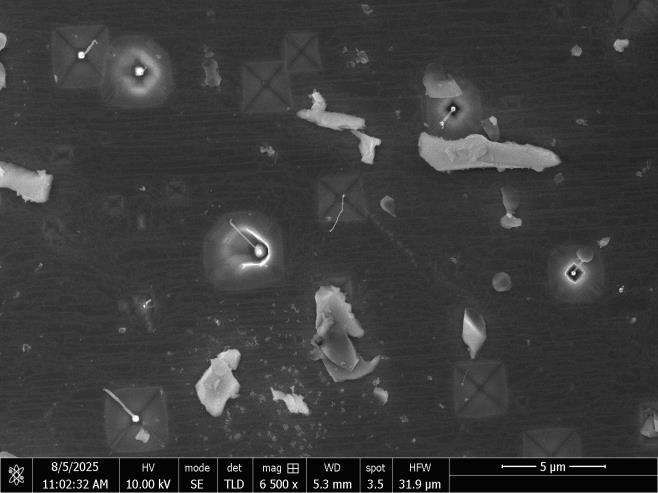
Last summer I was in a materials lab growing rutile nanowires — basically the skinniest things that can still carry electricity. My job was to grow them and check if they actually grew using SEM. But the real question my group cared about was: which crystal direction did each wire grow in?
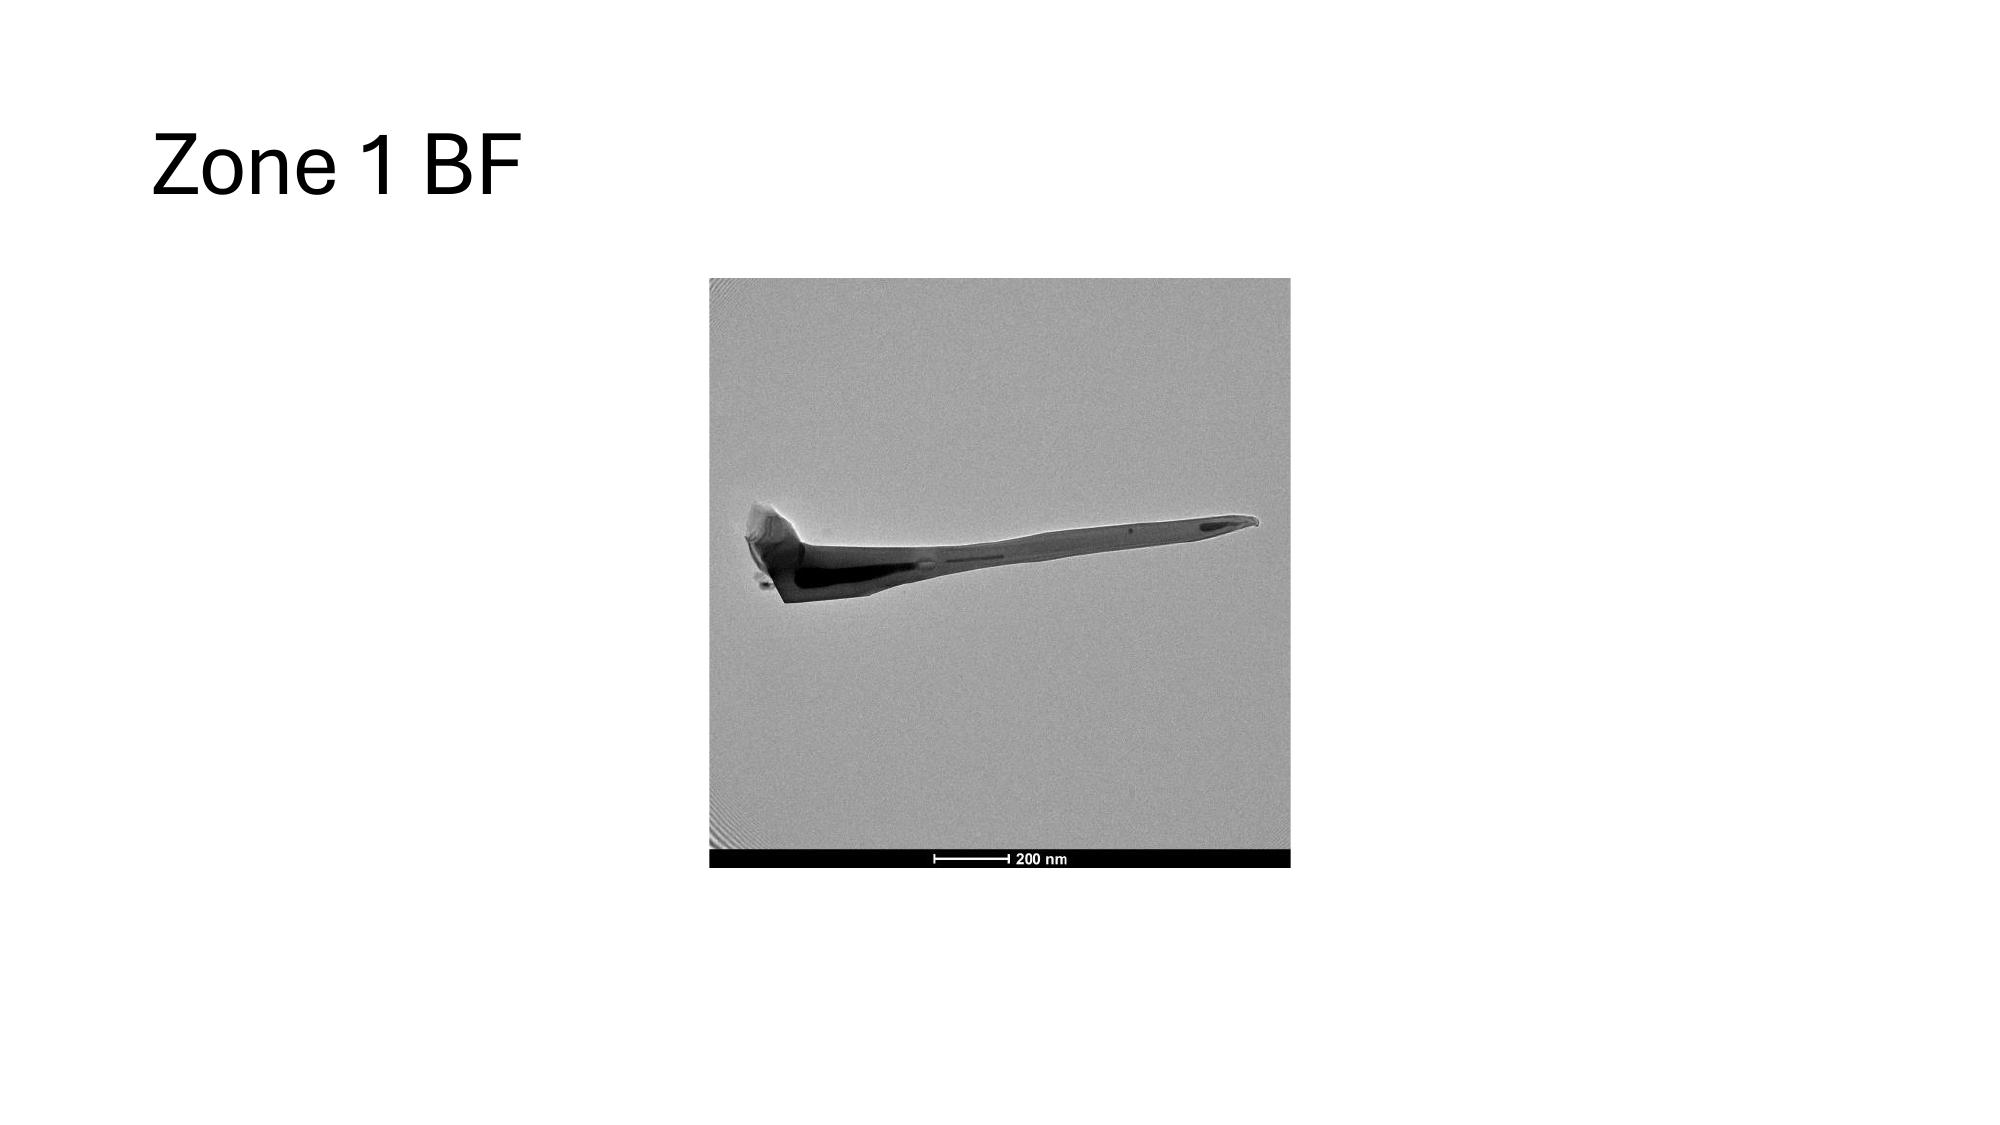
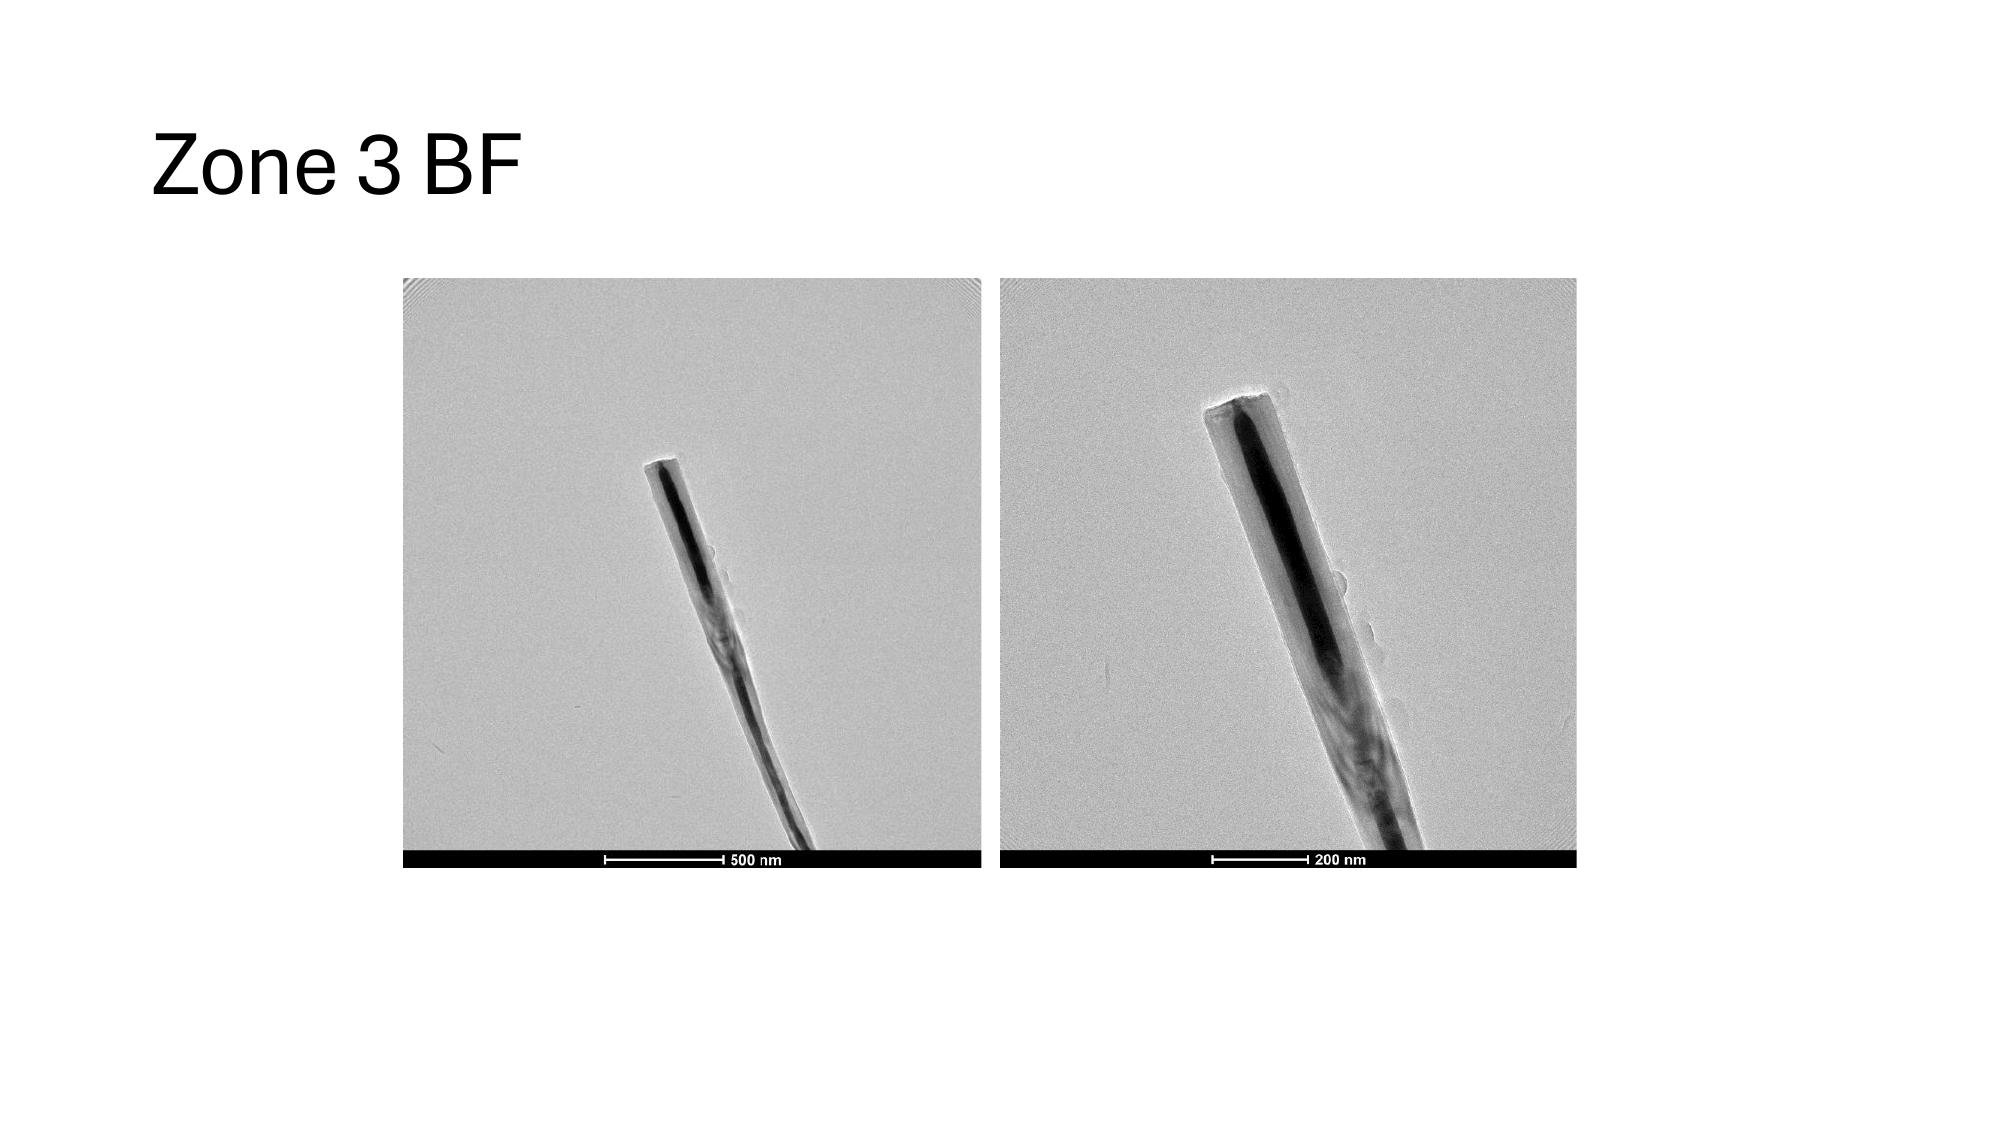
The only way to answer that was TEM. The problem was TEM was always the last step, and by the time we got around to it, most samples were gone — contaminated or lost on the stub. So we'd have to regrow everything. That burned weeks we didn't have.
I had just finished my first coding class and started thinking: we already had all these SEM images. Could I just pull the direction from those and skip the wait?
What it does
The script takes measurements from SEM cross-sections — xy, xz, and yz planes — stitches them together into a 3D vector, and converts that into a Miller index. That's the standard way to describe crystal directions.
Instead of waiting on TEM to find out which wires are worth analyzing, the lab can now prioritize samples early using the script's predictions. It doesn't replace TEM, but it tells you where to focus your time.
How I built it
I walked up to my supervisor and said: "What if I write something that matches the flat and cross-sectional images and just estimates the direction?" He said it was worth trying.
The pipeline ended up being:
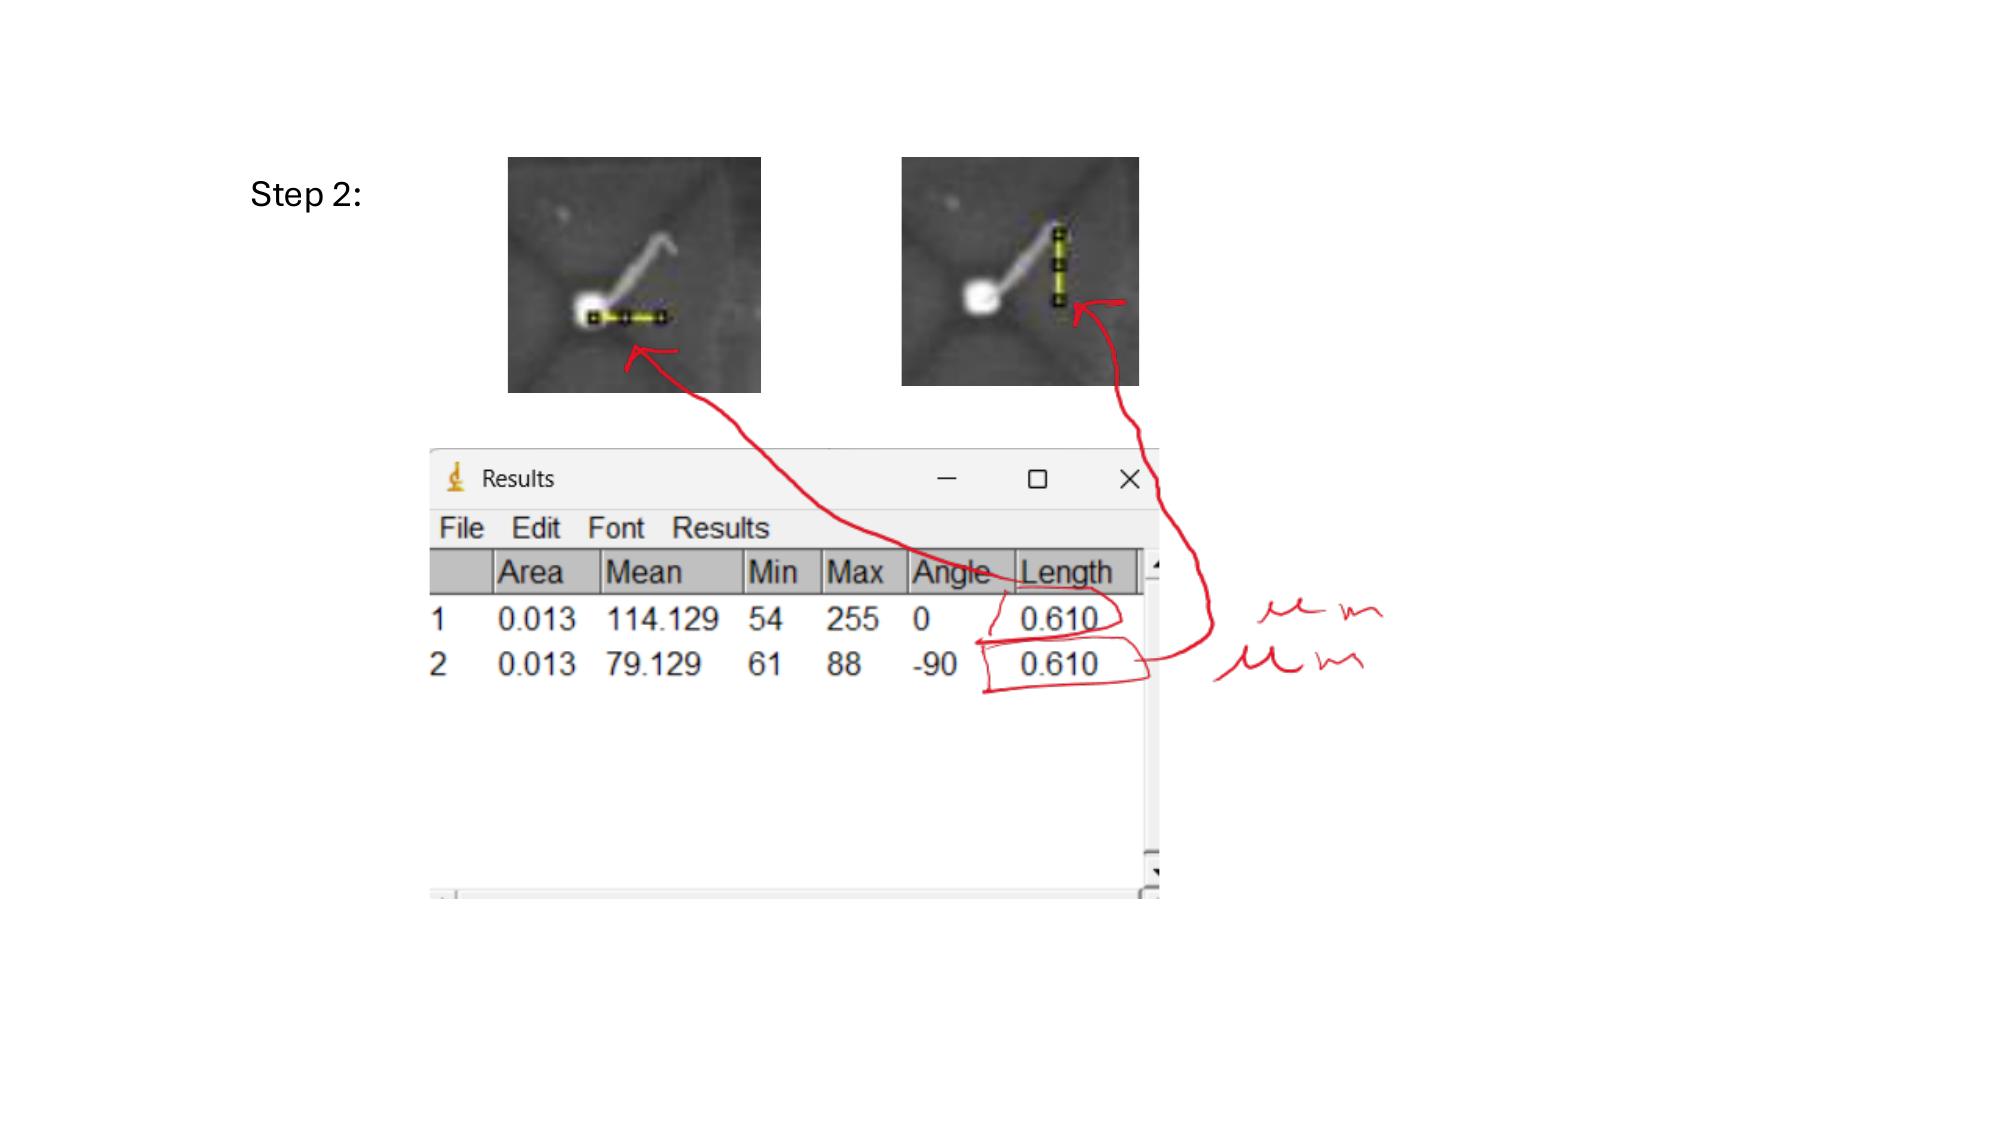
- Pull x,y from flat SEM images using ImageJ
- Pull x,z from cross-sections, correcting for 21.8° of microscope tilt
- Match them by x-coordinate to get [x,y,z] triples
- Scale and reduce using GCD to get Miller indices
- Count which direction shows up most often
The code itself wasn't the hard part. The hard part was defending the math to my supervisor and a couple of PhD students. I spent a lot of time poking holes in my own logic to make sure I wasn't fooling myself.
Challenges I ran into
- Convincing myself (and everyone else) that matching xy and xz measurements by x-coordinate was actually valid, not just convenient
- Getting the tilt correction right — the microscope stage is tilted 21.8° and if you ignore that your z values are wrong
- Dealing with the fact that sometimes an [x,y] measurement could have been recorded as [y,x] depending on how the wire was sitting in the image
- Waiting the whole term for a TEM slot to finally validate the thing
Accomplishments I'm proud of
Near the end of the term I ran the last sample through TEM. My script's prediction held.
That changed how my lab works. Instead of saving direction analysis as a final, risky step, the team now uses the script early to figure out which wires are worth spending time on.
I'm proud of this because it wasn't an assignment. I just saw a problem, couldn't stop thinking about it, and built something that actually helped.
What I learned
- Turning a physical measurement procedure into working code takes more iterations than you expect
- Defending your assumptions to people who know more than you is a different skill than writing code that runs
- A small automation can save a surprising amount of time when it's aimed at the actual bottleneck, not just the most interesting technical problem
What's next
- Fixing the x/y ordering ambiguity — maybe using wire width or brightness as a secondary match key
- Better sample tracking so cross-section data doesn't get mixed up between samples
- Running the pipeline on a full sample set automatically instead of validating one wire at a time
Built With
- Python
- SEM / TEM microscopy
- Linear algebra
- ImageJ for measurement extraction
Built With
- mathematics
- microscopy
- python
- statistics


Log in or sign up for Devpost to join the conversation.