-
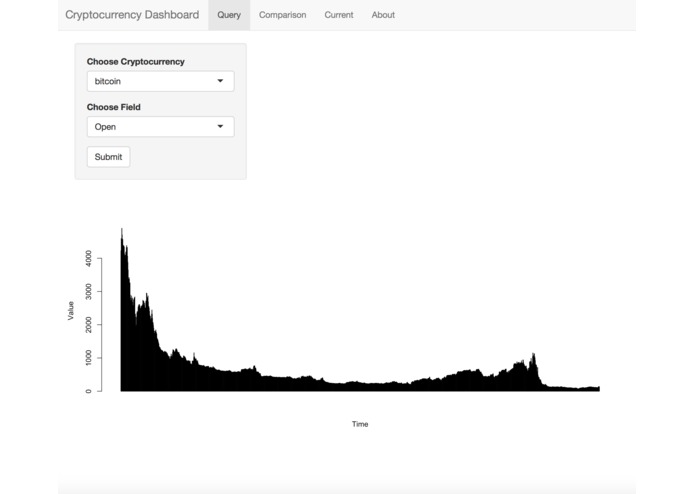
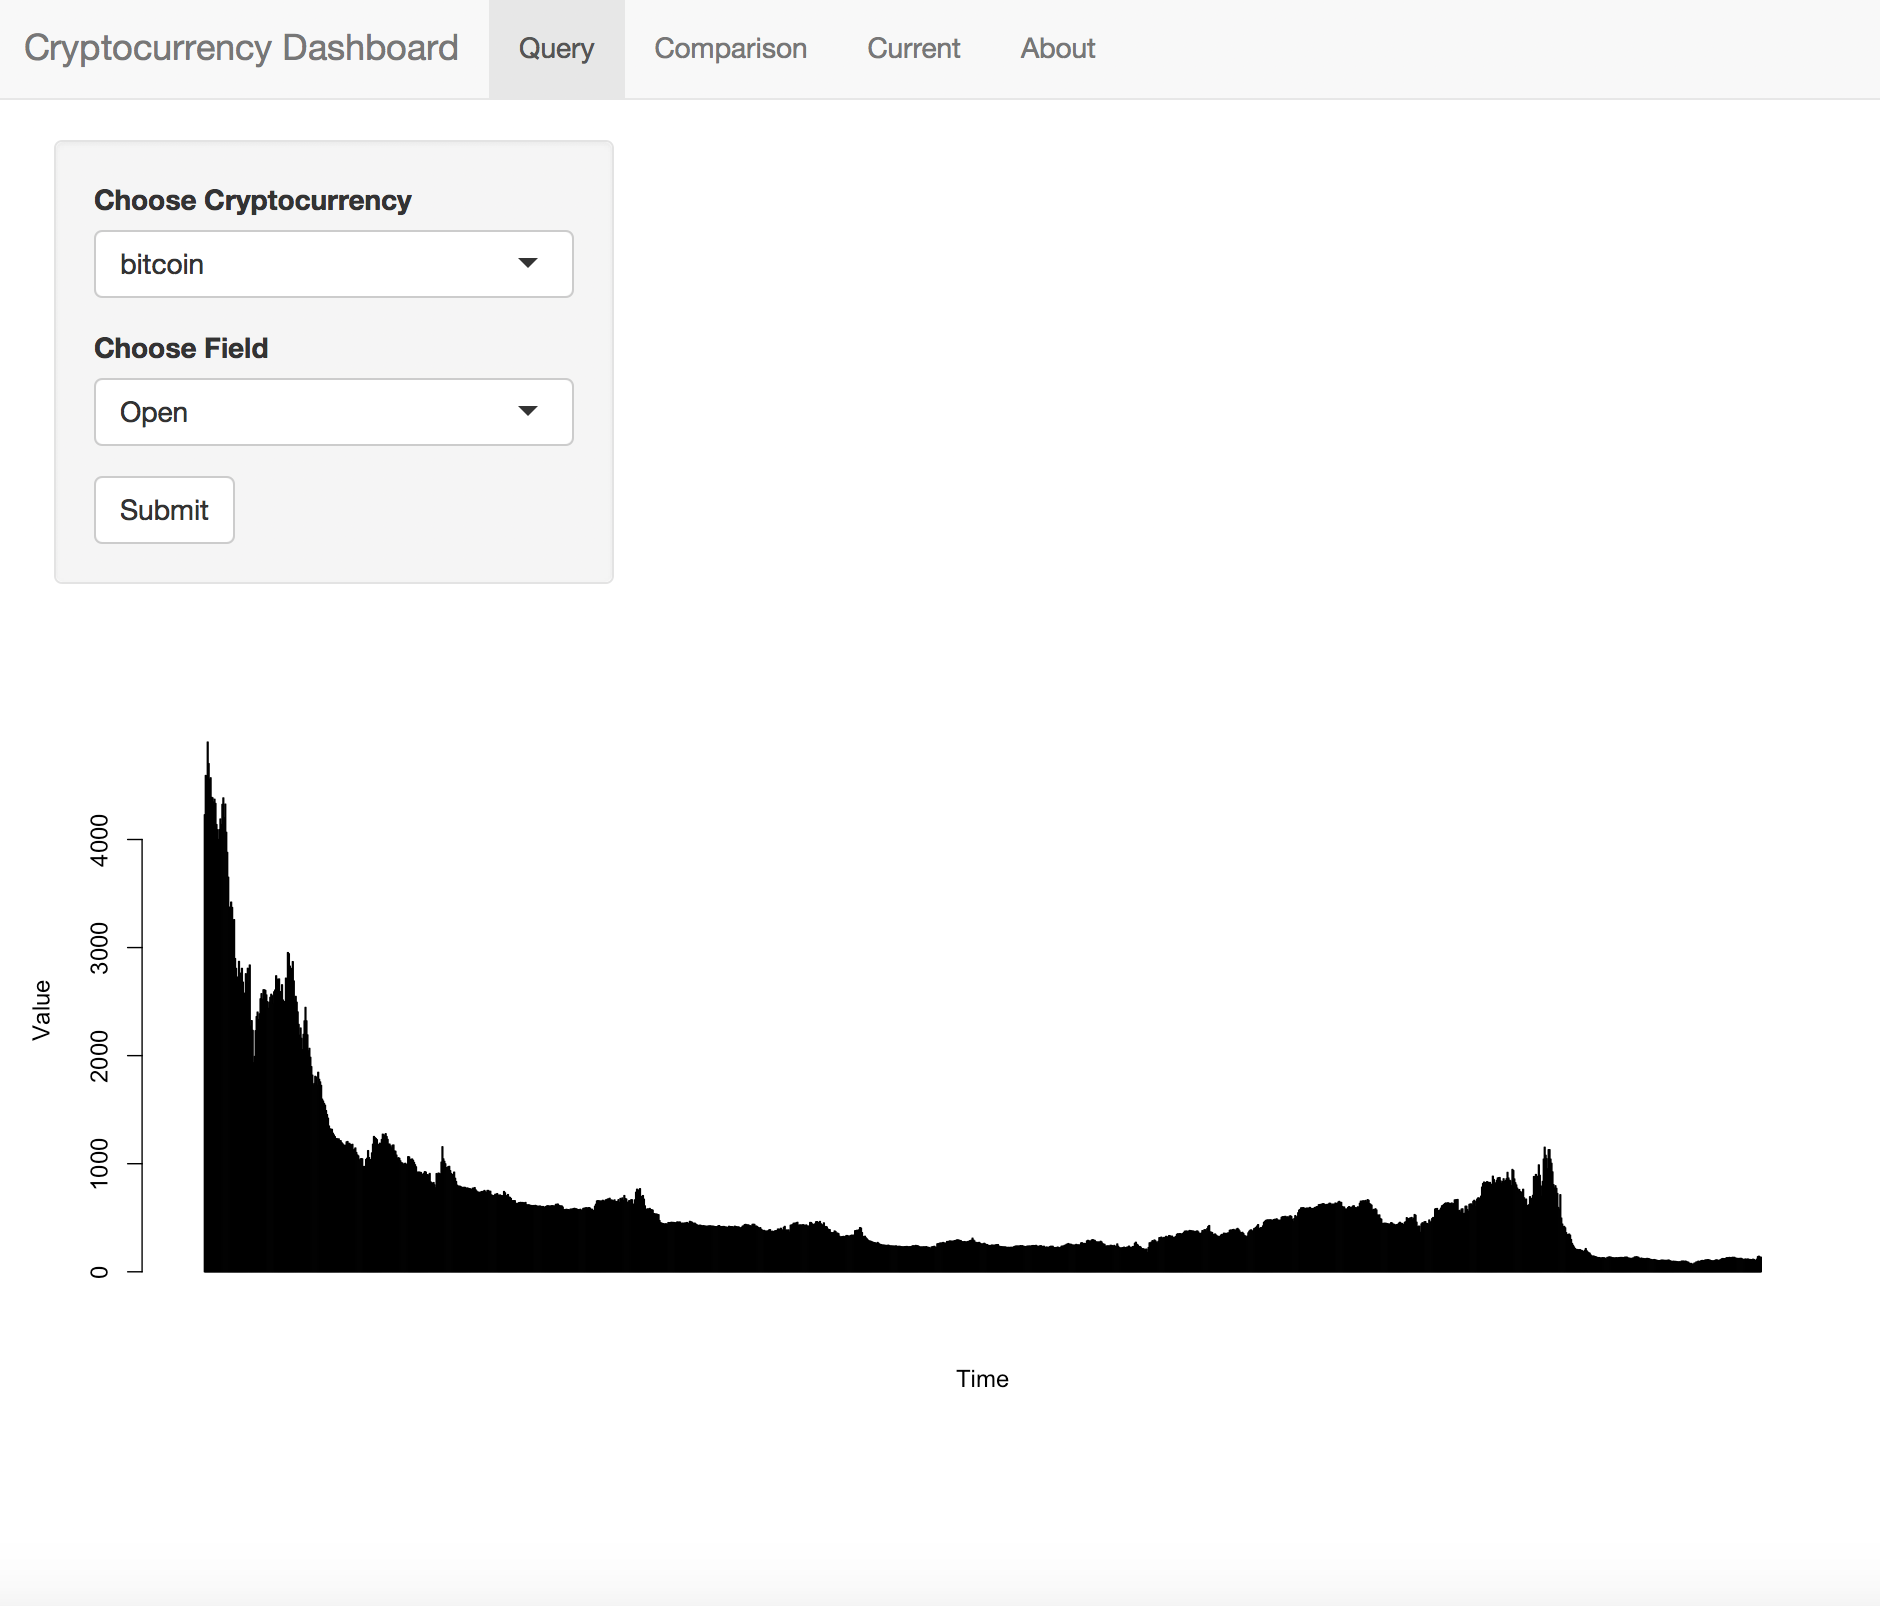
Query Page
-
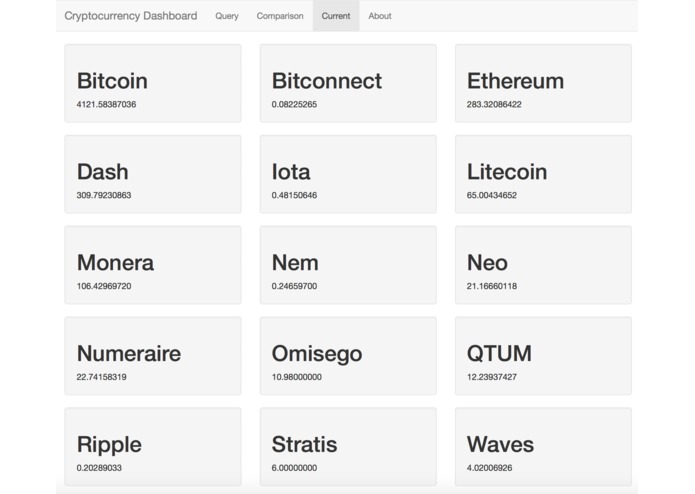
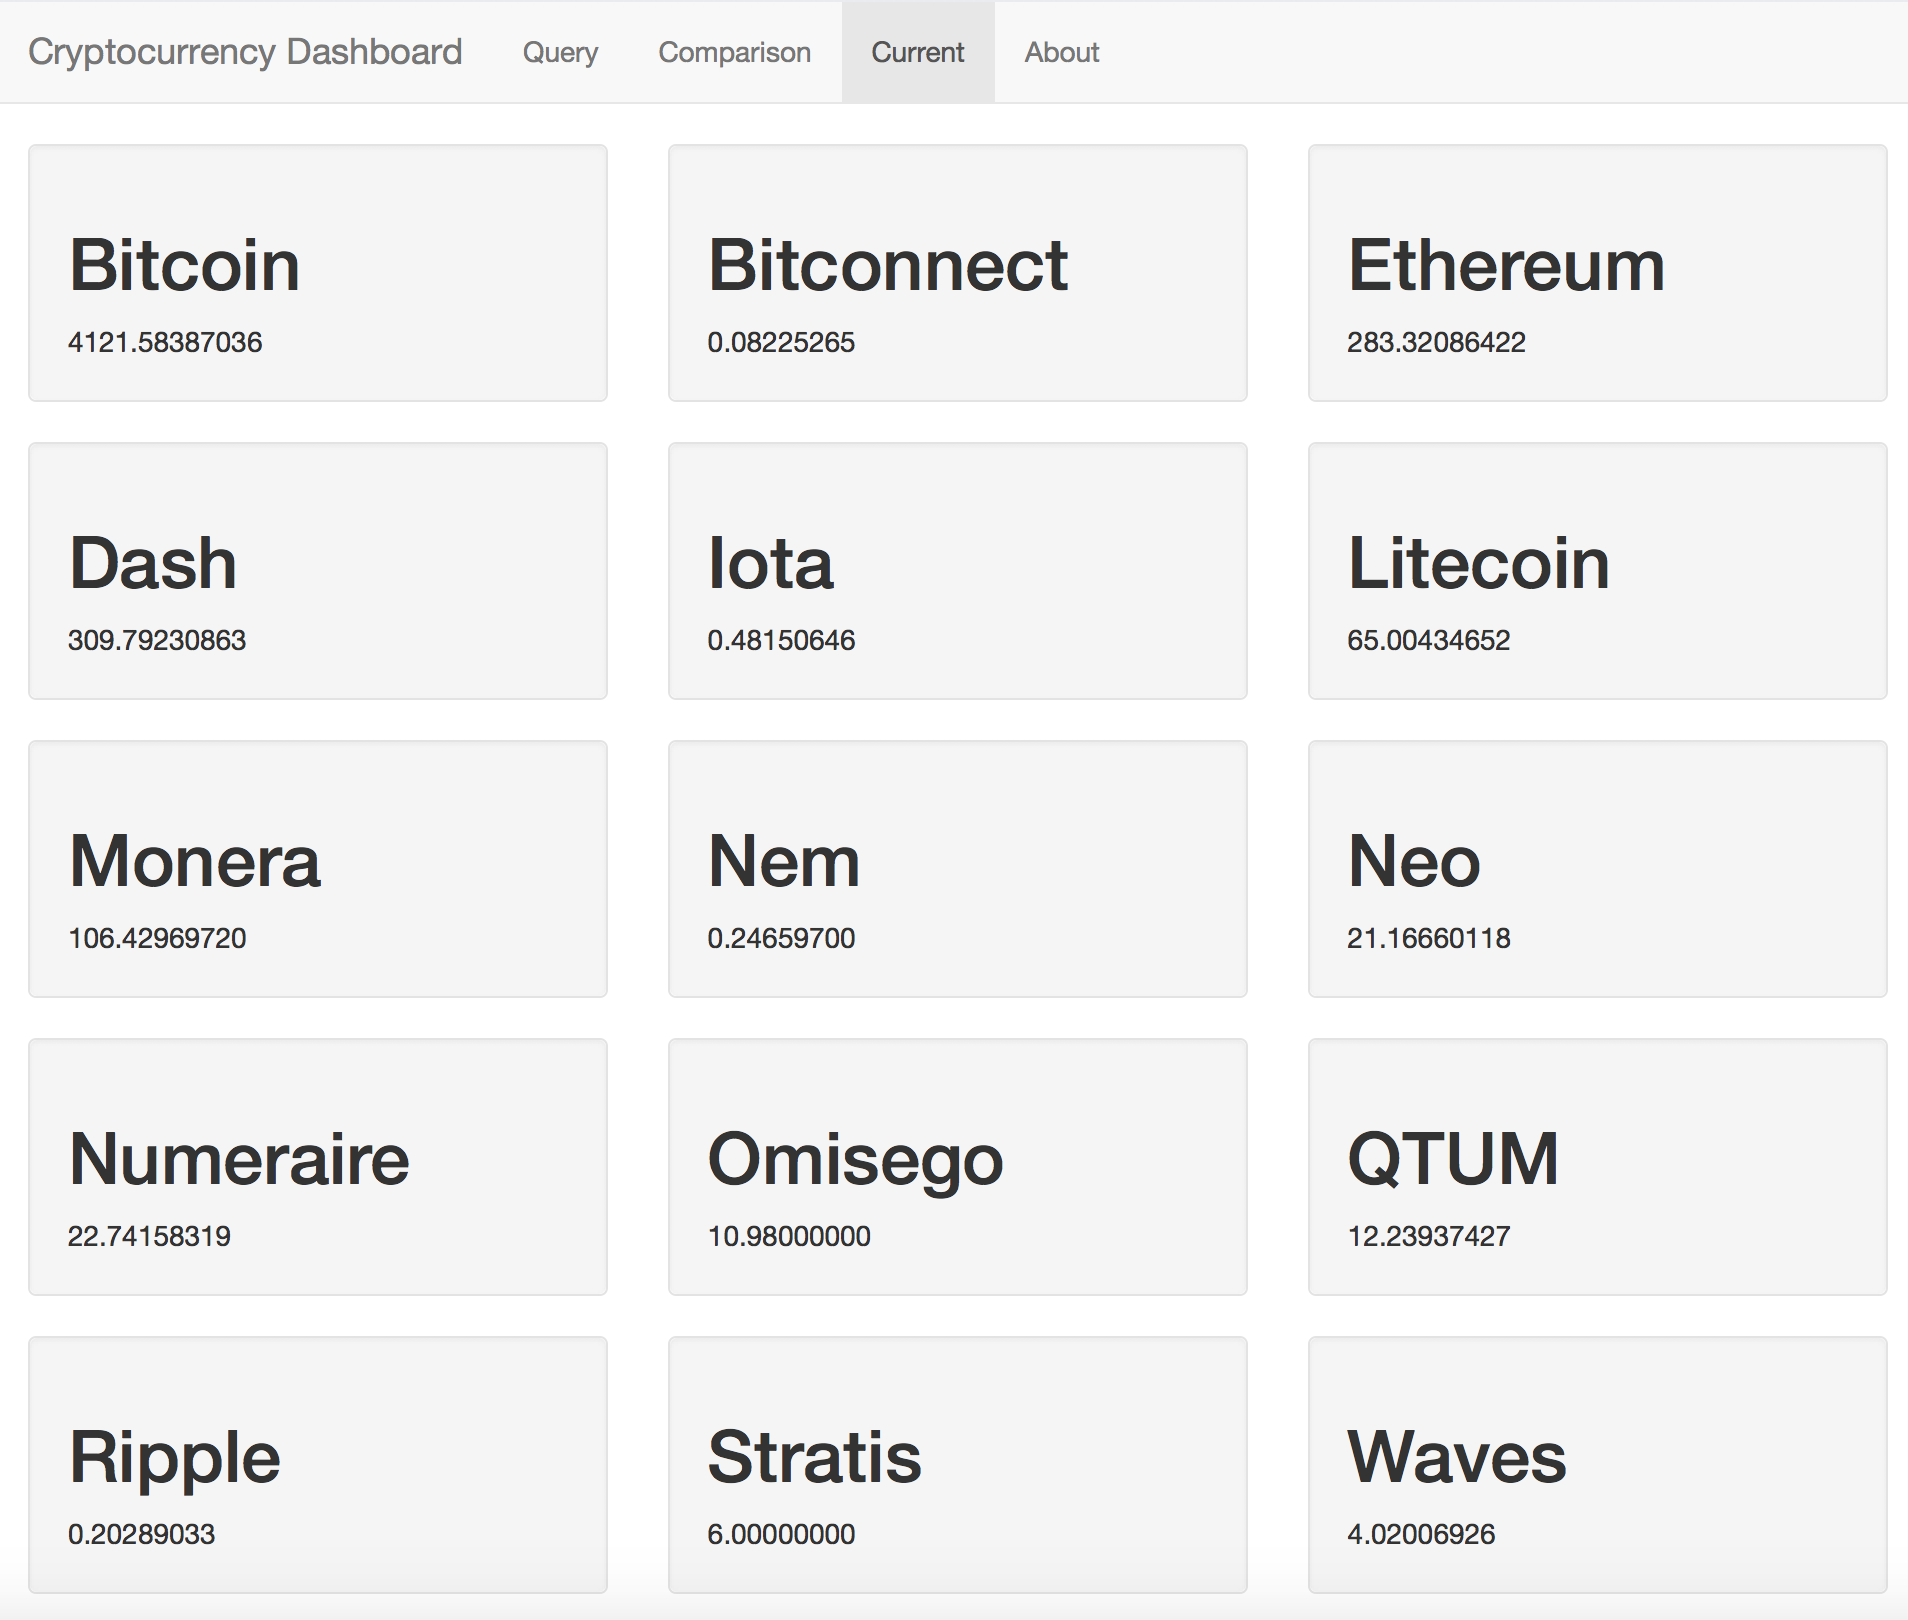
Current (Prices) Page
-
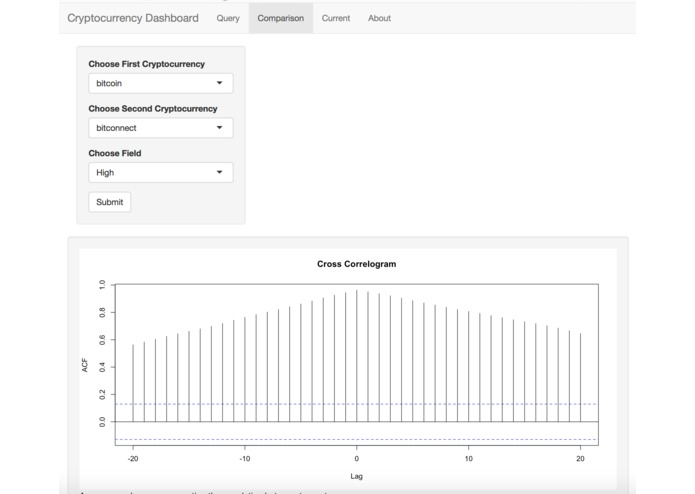
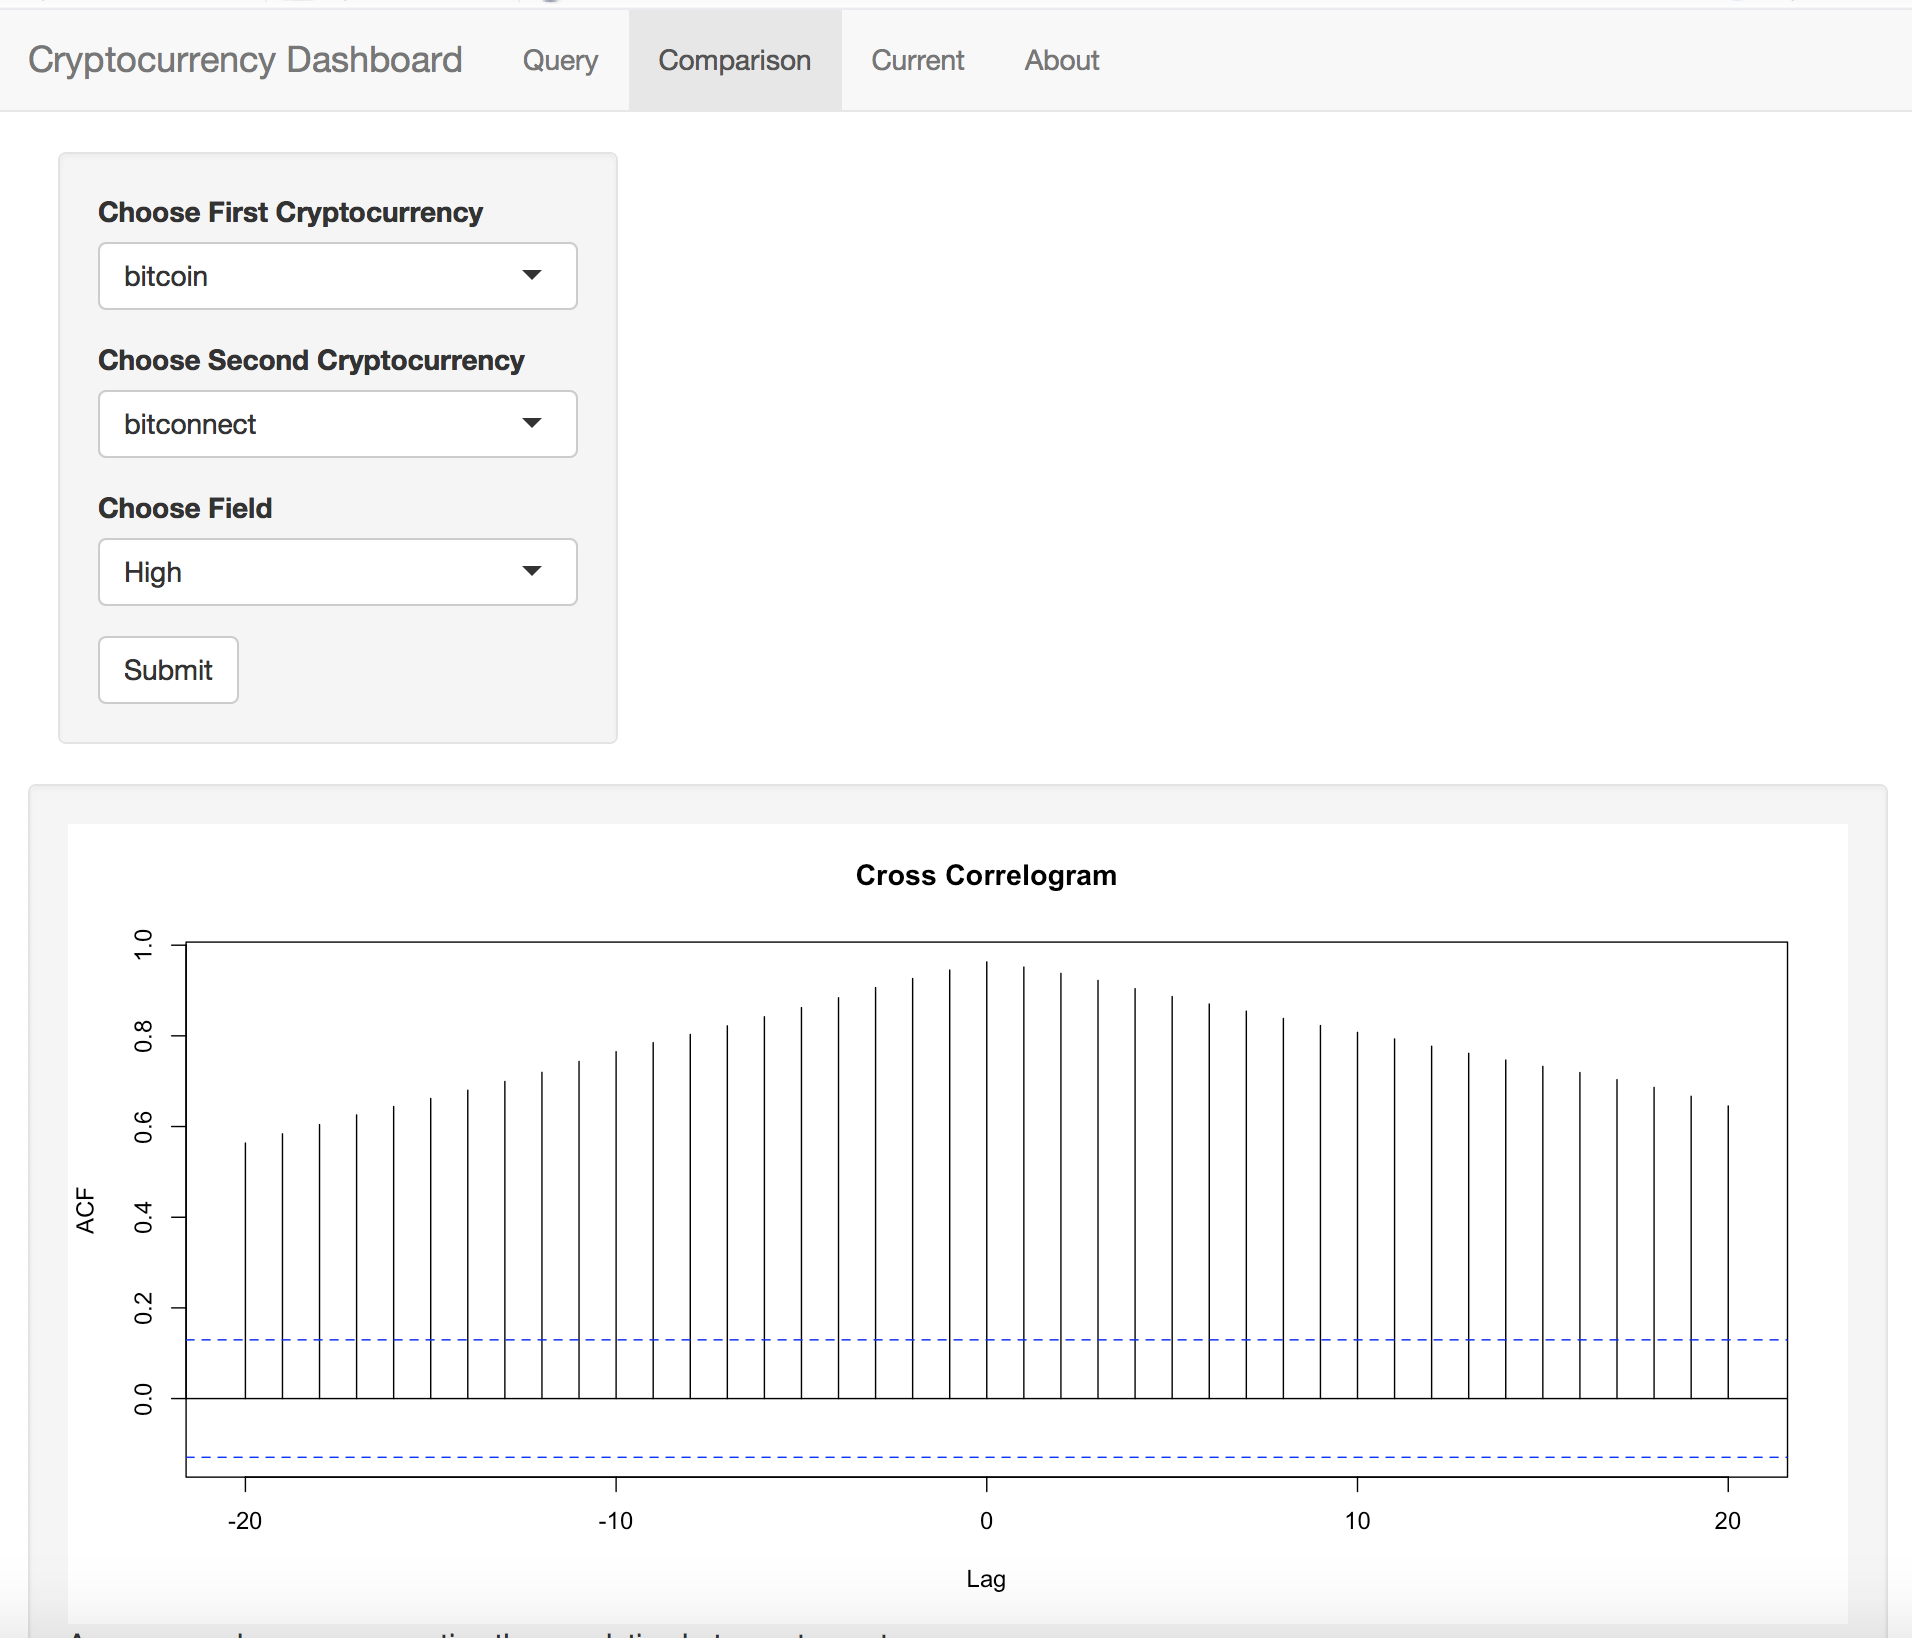
Comparison Page
Inspiration
An interest in data science.
What it does
Queries a dataset and makes graphs, also scrapes the internet for the current prices of cryptocurrencies.
How I built it
Used R's Shiny Web API with some basic plotting functions from R and httr, an HTTP library for R.
Challenges I ran into
Dealing with the Reactivity functions of Shiny (interacting with an input changes the output on the page) and syntax.
Accomplishments that I'm proud of
The application utilized a new API, which I've never used before.
What I learned
I learned how to use R's Shiny Web API and also learned what a Cross Correlogram is used to signify.
What's next for Cryptocurrency Dashboard
Dynamic access to incoming information, greater variety of graphs, and more in-depth features.
Built With
- r
- shiny

Log in or sign up for Devpost to join the conversation.