-
-
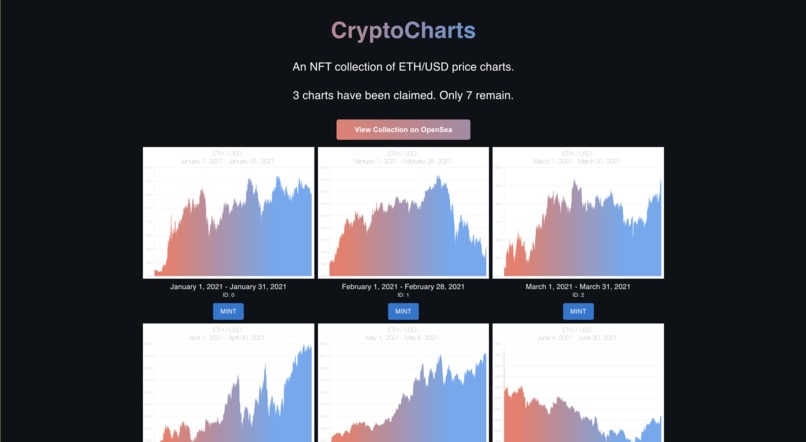
Home Page
-
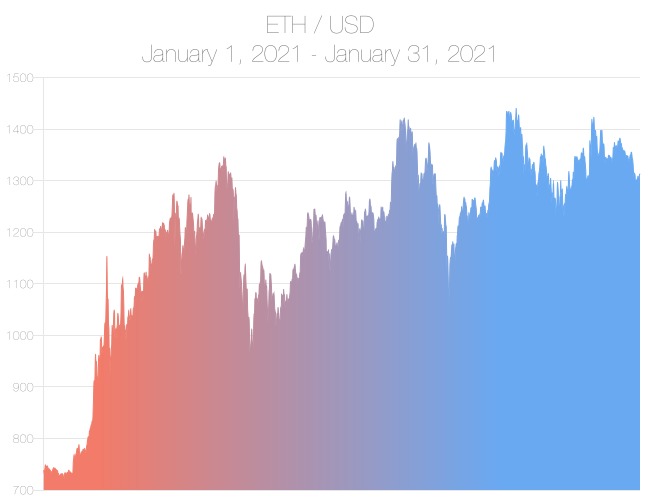
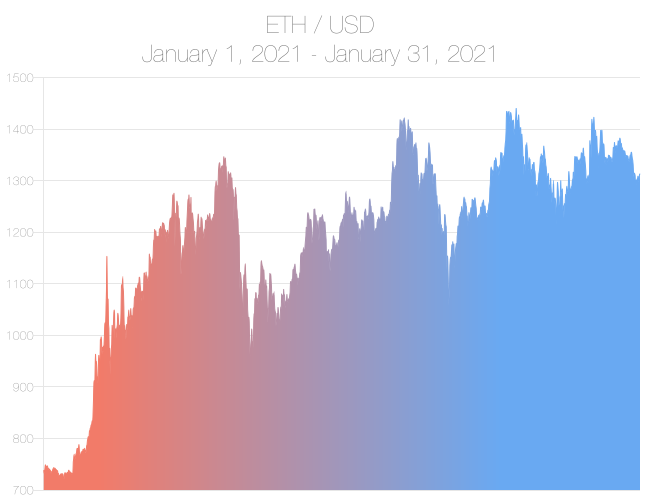
ETH/USD Price Chart (January 2021)
-
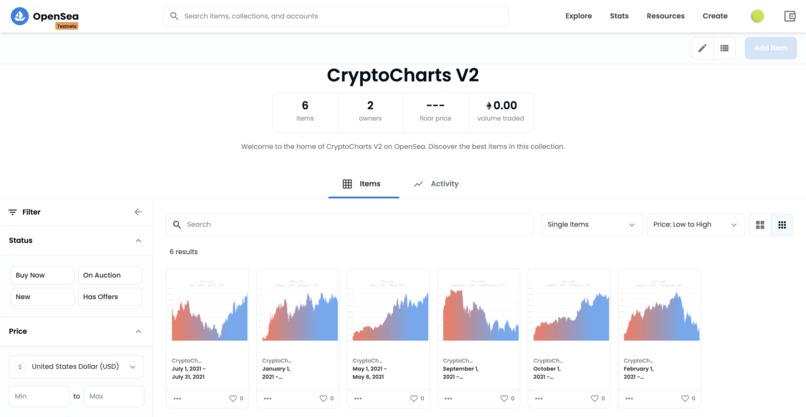
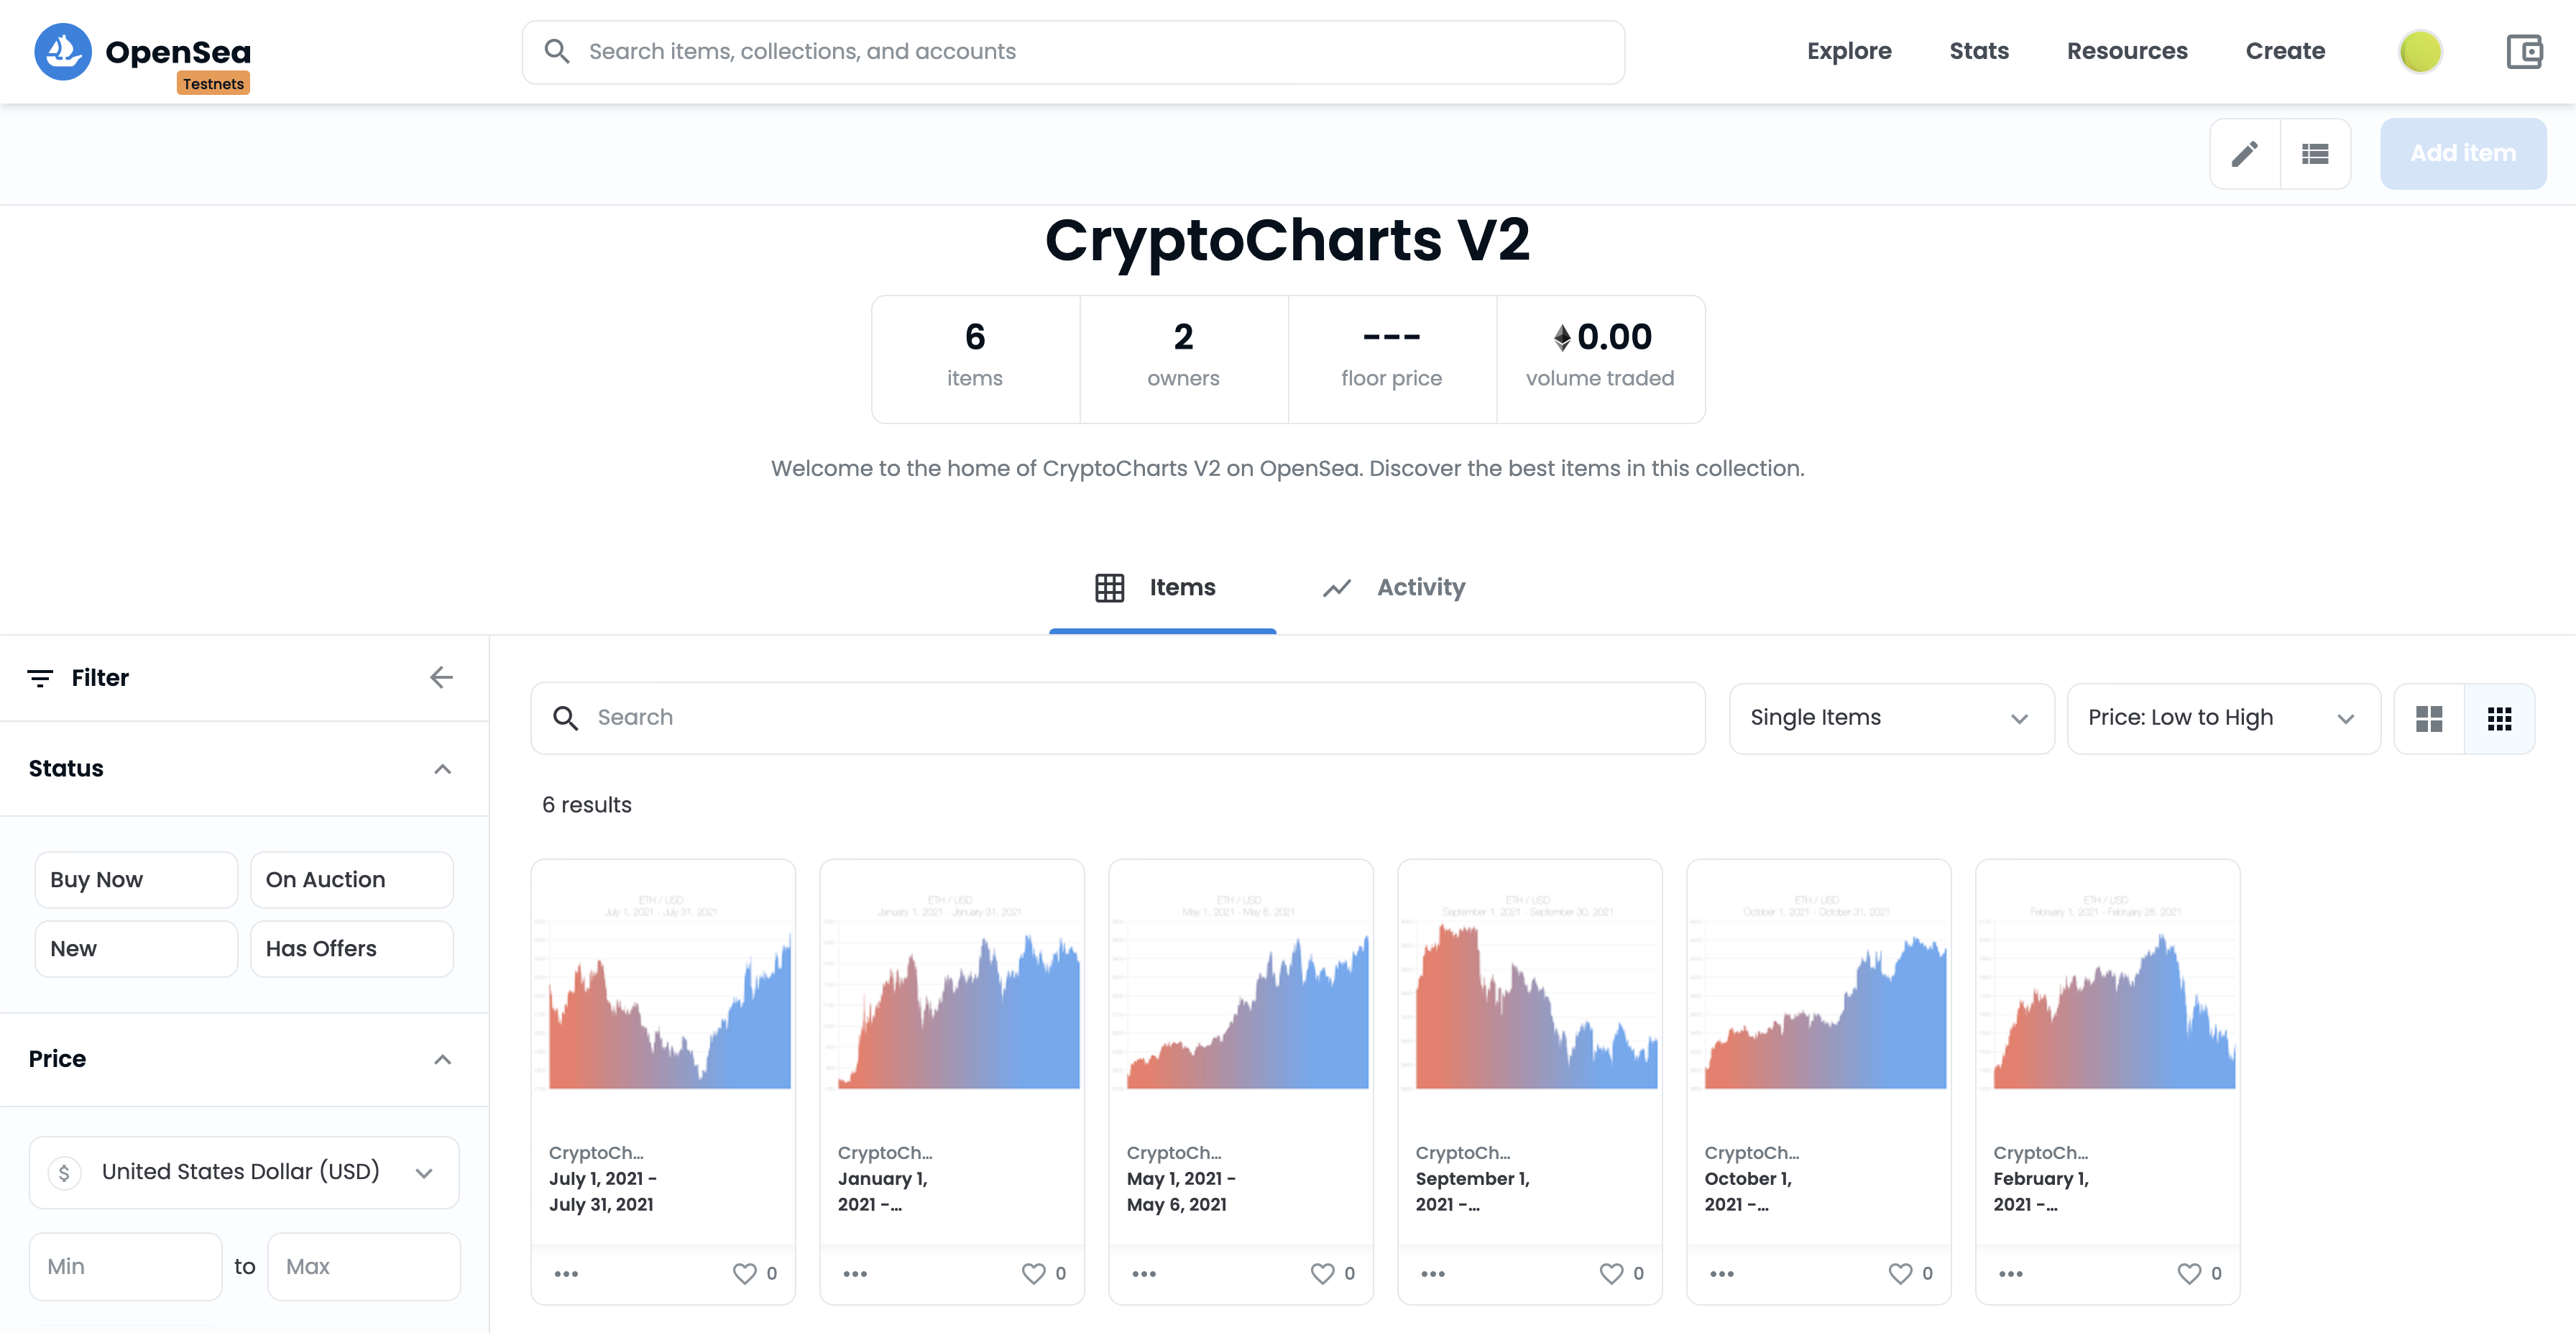
OpenSea Collection

Inspiration
We are a team of young software engineers with no prior experience in blockchain. The Chainlink Hackathon provided an awesome opportunity for us to get hands-on with blockchain technologies and create our own NFT collection.
What it does
CryptoCharts is a collection of price chart NFTs depicting monthly ETH/USD prices. Visit our site to mint your own NFT on the Rinkeby network, or view the collection on OpenSea.
Demo: https://4ge5p.csb.app/ (requires MetaMask set to Rinkeby)
Demo (alt): https://crypto-charts-frontend.marvinyan.repl.co/
OpenSea: https://testnets.opensea.io/collection/cryptocharts-v4
How we built it
React Front-End - Displays the unminted and minted charts. Users are presented with an option to mint any available chart for free.
Node Server - This server mines Chainlink's ETH/USD data feed for historical data, generates chart images, and uploads the images to IPFS, and pushes metadata to the NFT contract.
Price Consumer Smart Contract - Interfaces with Chainlink's ETH/USD Data Feed to provide price data to the node server.
CryptoCharts Smart Contract - Mints the NFT tokens.
Challenges we ran into
Allowing users to connect with their MetaMask wallet
Interfacing with the smart contract from both the front and back-end.
Accomplishments that we're proud of
It works!
What we learned
We learned more about the blockchain ecosystem and were able to create our own NFT collection.
What's next for CryptoCharts
Implement continuous monitoring of the Chainlink data feed for new round data.
Automatically generate the chart image on the first of each month.
Experiment with user role-based access control.
Links to our repositories
https://github.com/greenstone-development/Crypto-Charts-frontend
https://github.com/greenstone-development/Crypto-Chart-Contracts
https://github.com/greenstone-development/Crypto-Charts-server
Built With
- alchemyapi
- chainlink
- ethers
- filecoin
- hardhat
- ipfs
- javascript
- metamask
- mongodb
- nft
- nft.storage
- node.js

Log in or sign up for Devpost to join the conversation.