Cryos : AI-Driven Vaccine Delivery Intelligence on Elasticsearch
Inspiration
Every year, millions of vaccine doses are lost not because of manufacturing defects or distribution shortfalls, but because the cold-chain broke somewhere between the warehouse and the patient. A refrigerated truck's compressor fails at 2 AM on a highway outside Chicago. The driver doesn't know until the cargo is already compromised. By the time a supervisor notices a missed check-in, it's too late.
We wanted to build a system that could know before the driver does. One that watches every telemetry tick, reasons about SOP compliance in real time, and dispatches a backup truck before the temperature breaches the threshold autonomously.
What We Built
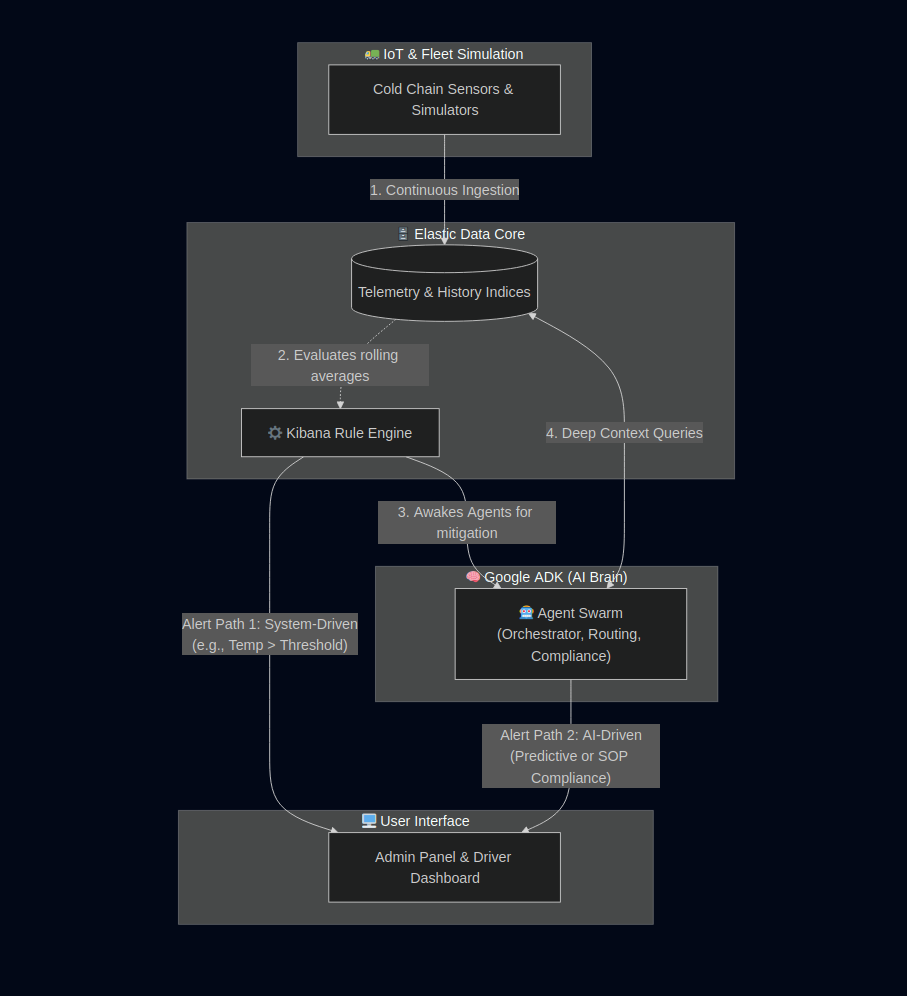
Cold-Chain Command is a real-time vaccine cold-chain delivery management system. It tracks refrigerated trucks from warehouse to destination, ingests live IoT telemetry into Elasticsearch, and uses two cooperating AI agent systems to monitor, reason, alert, and respond — autonomously.
Three services work together:
- FastAPI backend — the operational hub: telemetry ingestion, alert management, an MCP server, and API bridges between agent systems
- React + Vite frontend — dual-role UI: an admin operations panel and a driver-facing alert/chat interface
- Google ADK multi-agent system — deployed to Vertex AI Agent Engine; the autonomous reasoning and response layer
How We Built It
The Data Layer: Elasticsearch
Everything flows through Elasticsearch. We designed seven purpose-built indices, each with explicit mappings chosen to support the query patterns we needed:
| Index | Purpose | Key Mapping Decisions |
|---|---|---|
shipment-telemetry |
Per-tick IoT data | geo_point for GPS, float for temp/voltage |
telemetry-stream |
Legacy single-truck stream | Rolling time-series |
deliveries |
Delivery docs + SOP PDFs | attachment pipeline for PDF text extraction |
warehouses |
Cold-storage locations | geo_point for nearest-warehouse geo queries |
backup-trucks |
Available backup vehicles | geo_point + keyword status |
alerts |
All generated alerts | requires_approval + approval_status for human-in-the-loop |
incidents |
Incident records + reports | Nested telemetry_snapshot, sop_compliance |
The geo_point mapping was non-negotiable — it unlocked _geo_distance sorting for
nearest-warehouse lookups. We actually hit a silent failure mid-hackathon where dynamically
mapped indices had location stored as two floats instead of a geo_point, causing every
geo query to return a 400. We wrote an auto-healing repair_geo_mapping() function that
detects the wrong mapping on startup and recreates the index before seeding.
The IoT simulator (datasimulator/) pushes telemetry on a tick loop — GPS coordinates,
cargo temperature, compressor voltage, ambient temp, humidity — directly into
shipment-telemetry via index_doc(). The multi-shipment simulator runs independent
async tasks per shipment. Telemetry also hydrates an in-memory state store (state.py)
so the API can answer sub-millisecond queries without round-tripping ES for every request.
On restart, rehydrate.py replays ES history to restore the in-memory state.
Part 1: The Elastic Agent Builder — ES|QL Intelligence and Alerting
The Kibana Agent Builder Agent
We configured a cold-chain-monitor agent inside Kibana's Agent Builder. This agent has
direct, native access to all Elasticsearch indices and can run ES|QL queries, perform
cross-index aggregations, and respond to natural language questions about the operational
data.
The admin's chat interface in the frontend sends every question through
POST /api/agent/chat, which grounds the prompt in the selected shipment's live state
(current temperature, route progress, recent telemetry readings) before forwarding to the
Kibana Agent Builder converse API at:
POST /kibana/s/default/api/agent_builder/converse
This grounding is important — the agent's answers are contextualised to the specific shipment rather than answering in the abstract.
ES|QL Tools Available to the Agent
The Kibana Agent Builder can run ES|QL queries like:
FROM shipment-telemetry
| WHERE shipment_id == "SHP-ABC123"
| STATS avg_temp = AVG(cargo_temp_c),
        max_temp = MAX(cargo_temp_c),
        readings = COUNT(*)
  BY date_trunc(5 minutes, @timestamp)
| SORT @timestamp DESC
This enables the admin to ask plain-English questions like:
- "What was the temperature trend for SHP-ABC123 in the last 30 minutes?"
- "Which shipments exceeded 8°C today?"
- "Show me the compressor voltage history for truck TRUCK-403."
The agent synthesises ES|QL results into natural language answers and surfaces them in the admin's chat panel — no query language expertise required.
Two Alert Pathways
We built two distinct alert creation flows, each covering a different origin:
Alert Pathway 1 — Kibana Rule (ES-Driven, Proactive)
Kibana Alerting rules watch the shipment-telemetry index using rolling-average ES|QL
queries.
FROM shipment-telemetry
| WHERE @timestamp >= NOW() - 1 MINUTE
| STATS avg_temp = AVG(cargo_temp_c) BY shipment_id
| WHERE avg_temp > 8 OR avg_temp < 2
When a rule fires (e.g., 5-minute rolling average temperature > 8°C), Kibana calls our webhook:
POST /api/agent/webhook
The webhook handler (agent_webhook.py) parses three distinct Kibana payload shapes:
- Direct format — manually posted or simple rule output
- Kibana ES|QL rule — hits arrive under
context.hits[*]._source - Legacy ES Watcher — aggregation buckets under
payload.aggregations.by_shipment
For each shipment found in the payload, the webhook:
- Creates an
AlertPydantic model with a generated ID - Calls
add_alert()to update the in-memory state - Publishes the alert via
event_bus.publish()— which fans it out over SSE - Indexes the alert document to the
alertsES index viaindex_doc()
The alert appears simultaneously in the admin panel, the driver's real-time feed, and in Elasticsearch — available for future ES|QL queries or audit trails.
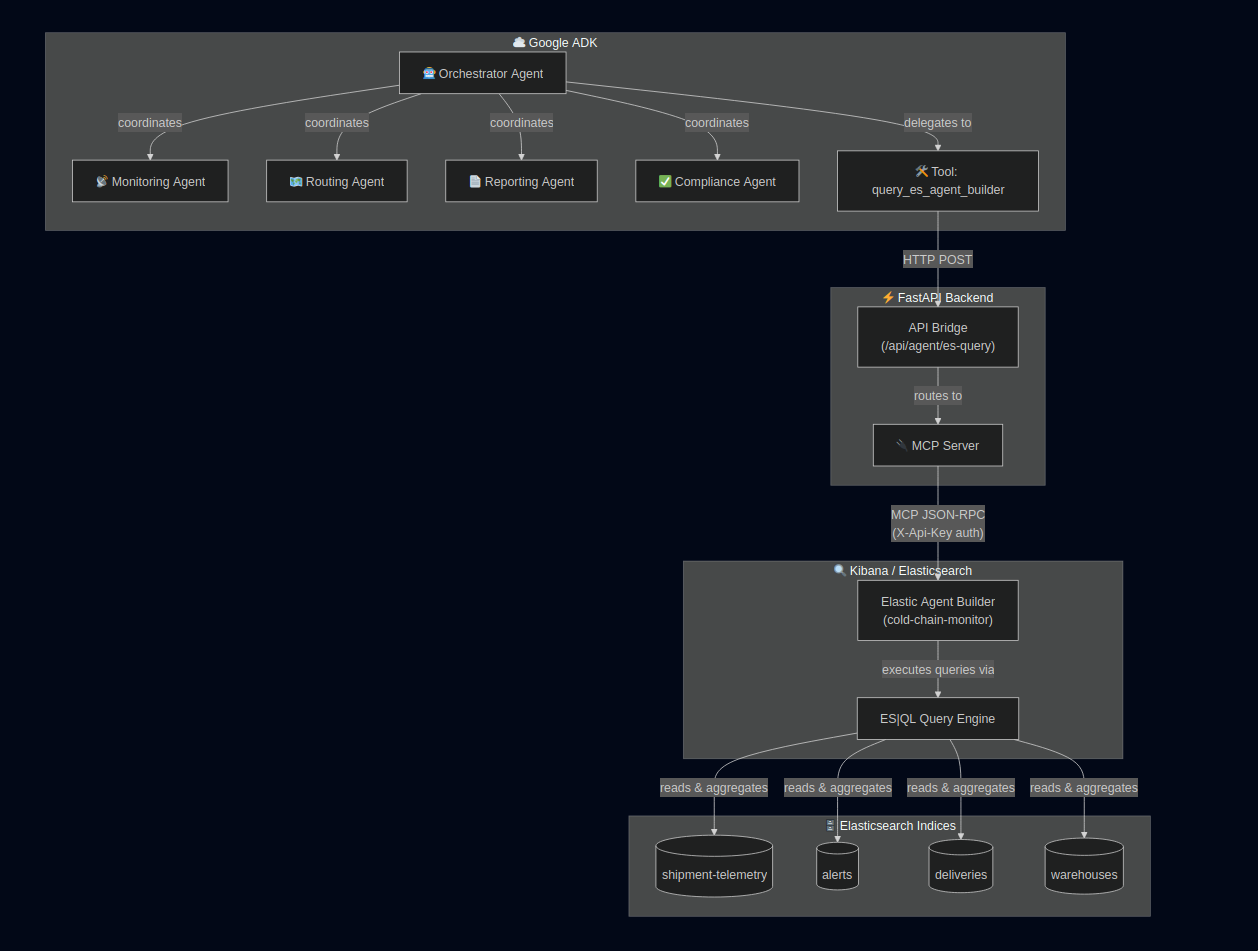
Part 2: Google ADK Multi-Agent System — Autonomous Cold-Chain Response
Architecture: Orchestrator + Four Specialists
The ADK system is a hierarchical multi-agent graph deployed to Vertex AI Agent Engine.
All agents run on gemini-3-flash-preview via google.adk.models.Gemini.
orchestrator_agent (cold_chain_orchestrator)
├── monitoring_agent    — telemetry analysis, trend detection, SOP checks
├── routing_agent       — geo queries, directions, backup truck dispatch
├── reporting_agent     — incident history, telemetry export, report generation
└── compliance_agent    — SOP rule enforcement and audit
The orchestrator receives either a user message (from the admin chat) or an inbound trigger, determines which specialist to delegate to, and assembles a coordinated response.
Orchestrator Tools
The orchestrator has five direct tools, all implemented as lightweight HTTP calls to the FastAPI backend:
| Tool | Endpoint | Purpose |
|---|---|---|
get_shipment_state |
GET /api/shipments/{id} |
Full shipment state: location, temp, status, SOP rules |
list_active_shipments |
GET /api/shipments?active_only=true |
All live shipments |
create_alert |
POST /api/alerts |
Create alert + publish to SSE + index to ES |
request_human_approval |
POST /api/alerts (approval type) |
Block and poll for human decision |
query_es_agent_builder |
POST /api/agent/es-query |
Natural language → Elastic Agent Builder |
The query_es_agent_builder tool is the bridge between the two agent systems — the ADK
orchestrator uses it to ask the Elastic Agent Builder questions that require ES|QL
aggregations or cross-index search, combining ADK's reasoning with Elastic's data access.
Monitoring Agent
The monitoring agent runs four tools against the live data:
get_current_telemetry— fetches the last 5 telemetry readings fromGET /api/shipments/{id}/telemetryget_shipment_sop_rules— reads SOP rules extracted from uploaded delivery PDFs (temperature bounds, humidity limits, transit time limits)assess_temperature_trend— computes the trend direction (rising/falling/stable), rate of change per tick, and estimated seconds until threshold breach; triggers escalation if breach is imminentget_telemetry_history— pulls up to 50 historical readings for longer-horizon trend analysis
When the monitoring agent determines the temperature is rising at a dangerous rate, it hands off to the orchestrator with a structured summary, which then decides whether to create an alert, request a human approval, or delegate to the routing agent.
Routing Agent
The routing agent handles the physical response to a detected anomaly:
find_nearest_warehouses— callsPOST /api/warehouses/nearest, which runs a_geo_distancesort query against thewarehousesES index to find the closest cold-storage facility to the truck's currentgeo_pointget_available_backup_trucks— geo query againstbackup-trucksindex filtered bystatus: availabledispatch_backup_truck_tool— triggers a backup truck dispatch, creating an alert of typebackup_dispatchget_directions_tool— Google Maps Directions API for reroutingget_traffic_conditions_tool— real-time traffic conditions along the routeget_weather_along_route— weather hazard check for the updated route
A typical routing flow: temperature breach detected → find nearest warehouse (3.2 km away) → check available backup trucks near that warehouse → request human approval → on approval, dispatch backup truck + create reroute instruction alert → push to driver's SSE stream.
Reporting Agent
Handles compliance and audit after incidents:
get_shipment_incidents— queries theincidentsindex for the shipment's historyget_full_telemetry— bulk telemetry export for the full tripgenerate_incident_report— compiles temperature exceedances, SOP violations, route deviations, and actions taken into a structured reportrecord_incident— indexes a new incident document to ES with atelemetry_snapshot
The MCP Server — Elastic Agent Builder as a Tool Consumer
The FastAPI backend also exposes a full MCP (Model Context Protocol) server inlined at
POST /mcp/, protected by X-Api-Key. This makes the backend's operational data
available to the Kibana Agent Builder as callable tools over JSON-RPC 2.0:
tools/list  →  7 tools available
tools/call  →  dispatched to FastAPI handlers
The 7 MCP tools exposed:
| MCP Tool | What It Does |
|---|---|
get_temperature |
Legacy single-device current + target temp |
set_target_temperature |
Adjust target temperature setpoint |
get_shipment_temperature |
Per-shipment current cargo temperature |
get_shipment_status |
Full shipment state dump (location, alerts, SOP rules) |
get_active_alerts |
All unacknowledged alerts for a shipment |
create_alert |
Create alert + SSE publish (Elastic-side triggered) |
get_nearest_warehouse |
Geo search: nearest cold-storage to lat/lon |
This means the Kibana Agent Builder can — on its own, mid-ES|QL reasoning — call
get_nearest_warehouse with the truck's current coordinates from a telemetry query, or
call create_alert to surface a finding directly into the operational alert stream. The
two agent systems share a live, bidirectional data channel.
The Frontend: Two Roles, One Real-Time Feed
The React frontend serves two distinct roles from a single layout:
- Admin Panel (
/scheduling) — shipment list, Google Maps overlay with truck markers and warehouse pins, resizable agent chat panel, alert notification badge - Driver Panel (
/tracking) — map, live alert feed over SSE, failure injection controls (compressor fail, temperature exceed, door open, GPS drift, breakdown, fuel low)
AdminDataProvider owns all shared state: polls shipments every 3 seconds, subscribes to
/api/alerts/stream (EventSource SSE), and maintains the agent chat history. Every alert
created by either agent system appears in the driver's feed within milliseconds via SSE.
Challenges We Faced
1. Geo Mapping Silent Failures
Dynamic ES index creation mapped location as two separate float fields instead of a
geo_point. Every geo-distance query returned a 400 — silently disabling the entire
nearest-warehouse feature. The fix was writing repair_geo_mapping(), an idempotent
startup check that inspects the current mapping type and recreates the index if wrong.
2. Kibana Webhook Payload Polymorphism
Kibana's rule engine sends different payload shapes depending on the rule type —
ES|QL query rules, legacy ES Watcher, and direct webhook calls each have a completely
different JSON structure. We had to build a normalising parser (_parse_kibana_payload)
that handles all three shapes and extracts a consistent
{shipment_id, alert_type, message, severity} tuple regardless of origin.
3. Bridging Two Agent Systems
Getting the ADK orchestrator to consume Elastic Agent Builder's intelligence required
building an explicit HTTP bridge (/api/agent/es-query). The ADK tool makes an HTTP
call to FastAPI, which async-calls the Kibana converse API, parses the response shape
(which also varies between direct text, response.message, and step arrays), and returns
plain text to the ADK tool. The extract_reply() function handles six different Kibana
response shapes.
4. Human-in-the-Loop Without WebSockets
Implementing approval polling without a persistent WebSocket connection required the
request_human_approval ADK tool to create a special alert with requires_approval: true,
then poll the REST alert endpoint every 2 seconds for up to 60 seconds waiting for the
admin to click Approve or Reject in the UI. A 60-second timeout defaults to the safe action.
5. In-Memory State Across Restarts
The simulator and live telemetry update in-memory ShipmentState objects for sub-ms
API response times. But restarts wiped all state. The rehydrate.py service replays
the most recent telemetry and alert documents from ES on startup, reconstructing the
full in-memory picture. Getting the rehydration order right (indices must exist before
seeding; seeding must complete before rehydration) required careful sequencing in the
FastAPI lifespan handler.
What We Learned
- Elasticsearch is a better operational database than we expected. Geo queries, time-series aggregations, full-text PDF search via attachment pipelines, and nested alert documents all in one store — without needing a separate time-series DB or geo-service.
- ES|QL dramatically lowers the barrier to complex aggregations. Writing a rolling 5-minute average temperature check that fires a webhook is ten lines of ES|QL and a Kibana rule toggle — no backend code required.
- Multi-agent systems need explicit handoff contracts. Vague instructions between orchestrator and sub-agents produce inconsistent behaviour. Tight, typed tool signatures and explicit escalation conditions (e.g., "if rate > 0.5°C/min, escalate to routing agent") made the system reliable.
- MCP is the right abstraction for tool-sharing between agent systems. Exposing the FastAPI backend as an MCP server meant both the ADK agents and the Kibana Agent Builder consumed the same operational surface without any duplication.
- Real-time feedback loops change the UX entirely. SSE-pushed alerts that reach the driver panel within 200ms of an ES index write — regardless of whether the alert came from a Kibana rule, an ADK agent, or a manual API call — made the system feel genuinely live rather than polled.
Going Forward
- I Think going forward the best way to improved upon this architecture would be adding edge inference and models through which drivers can be directed and response could be coordinated without Internet connectivity.
Built With
- adk
- agentbuilder
- elasticsearch
- google-cloud

Log in or sign up for Devpost to join the conversation.