-
-
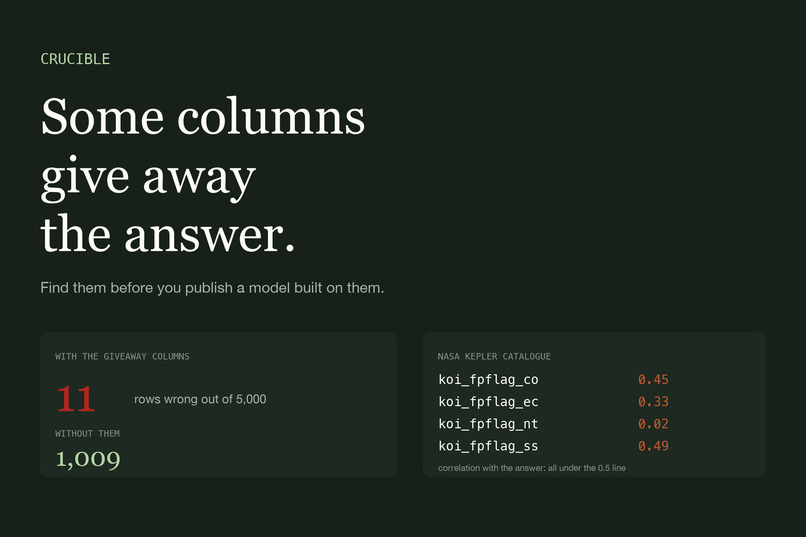
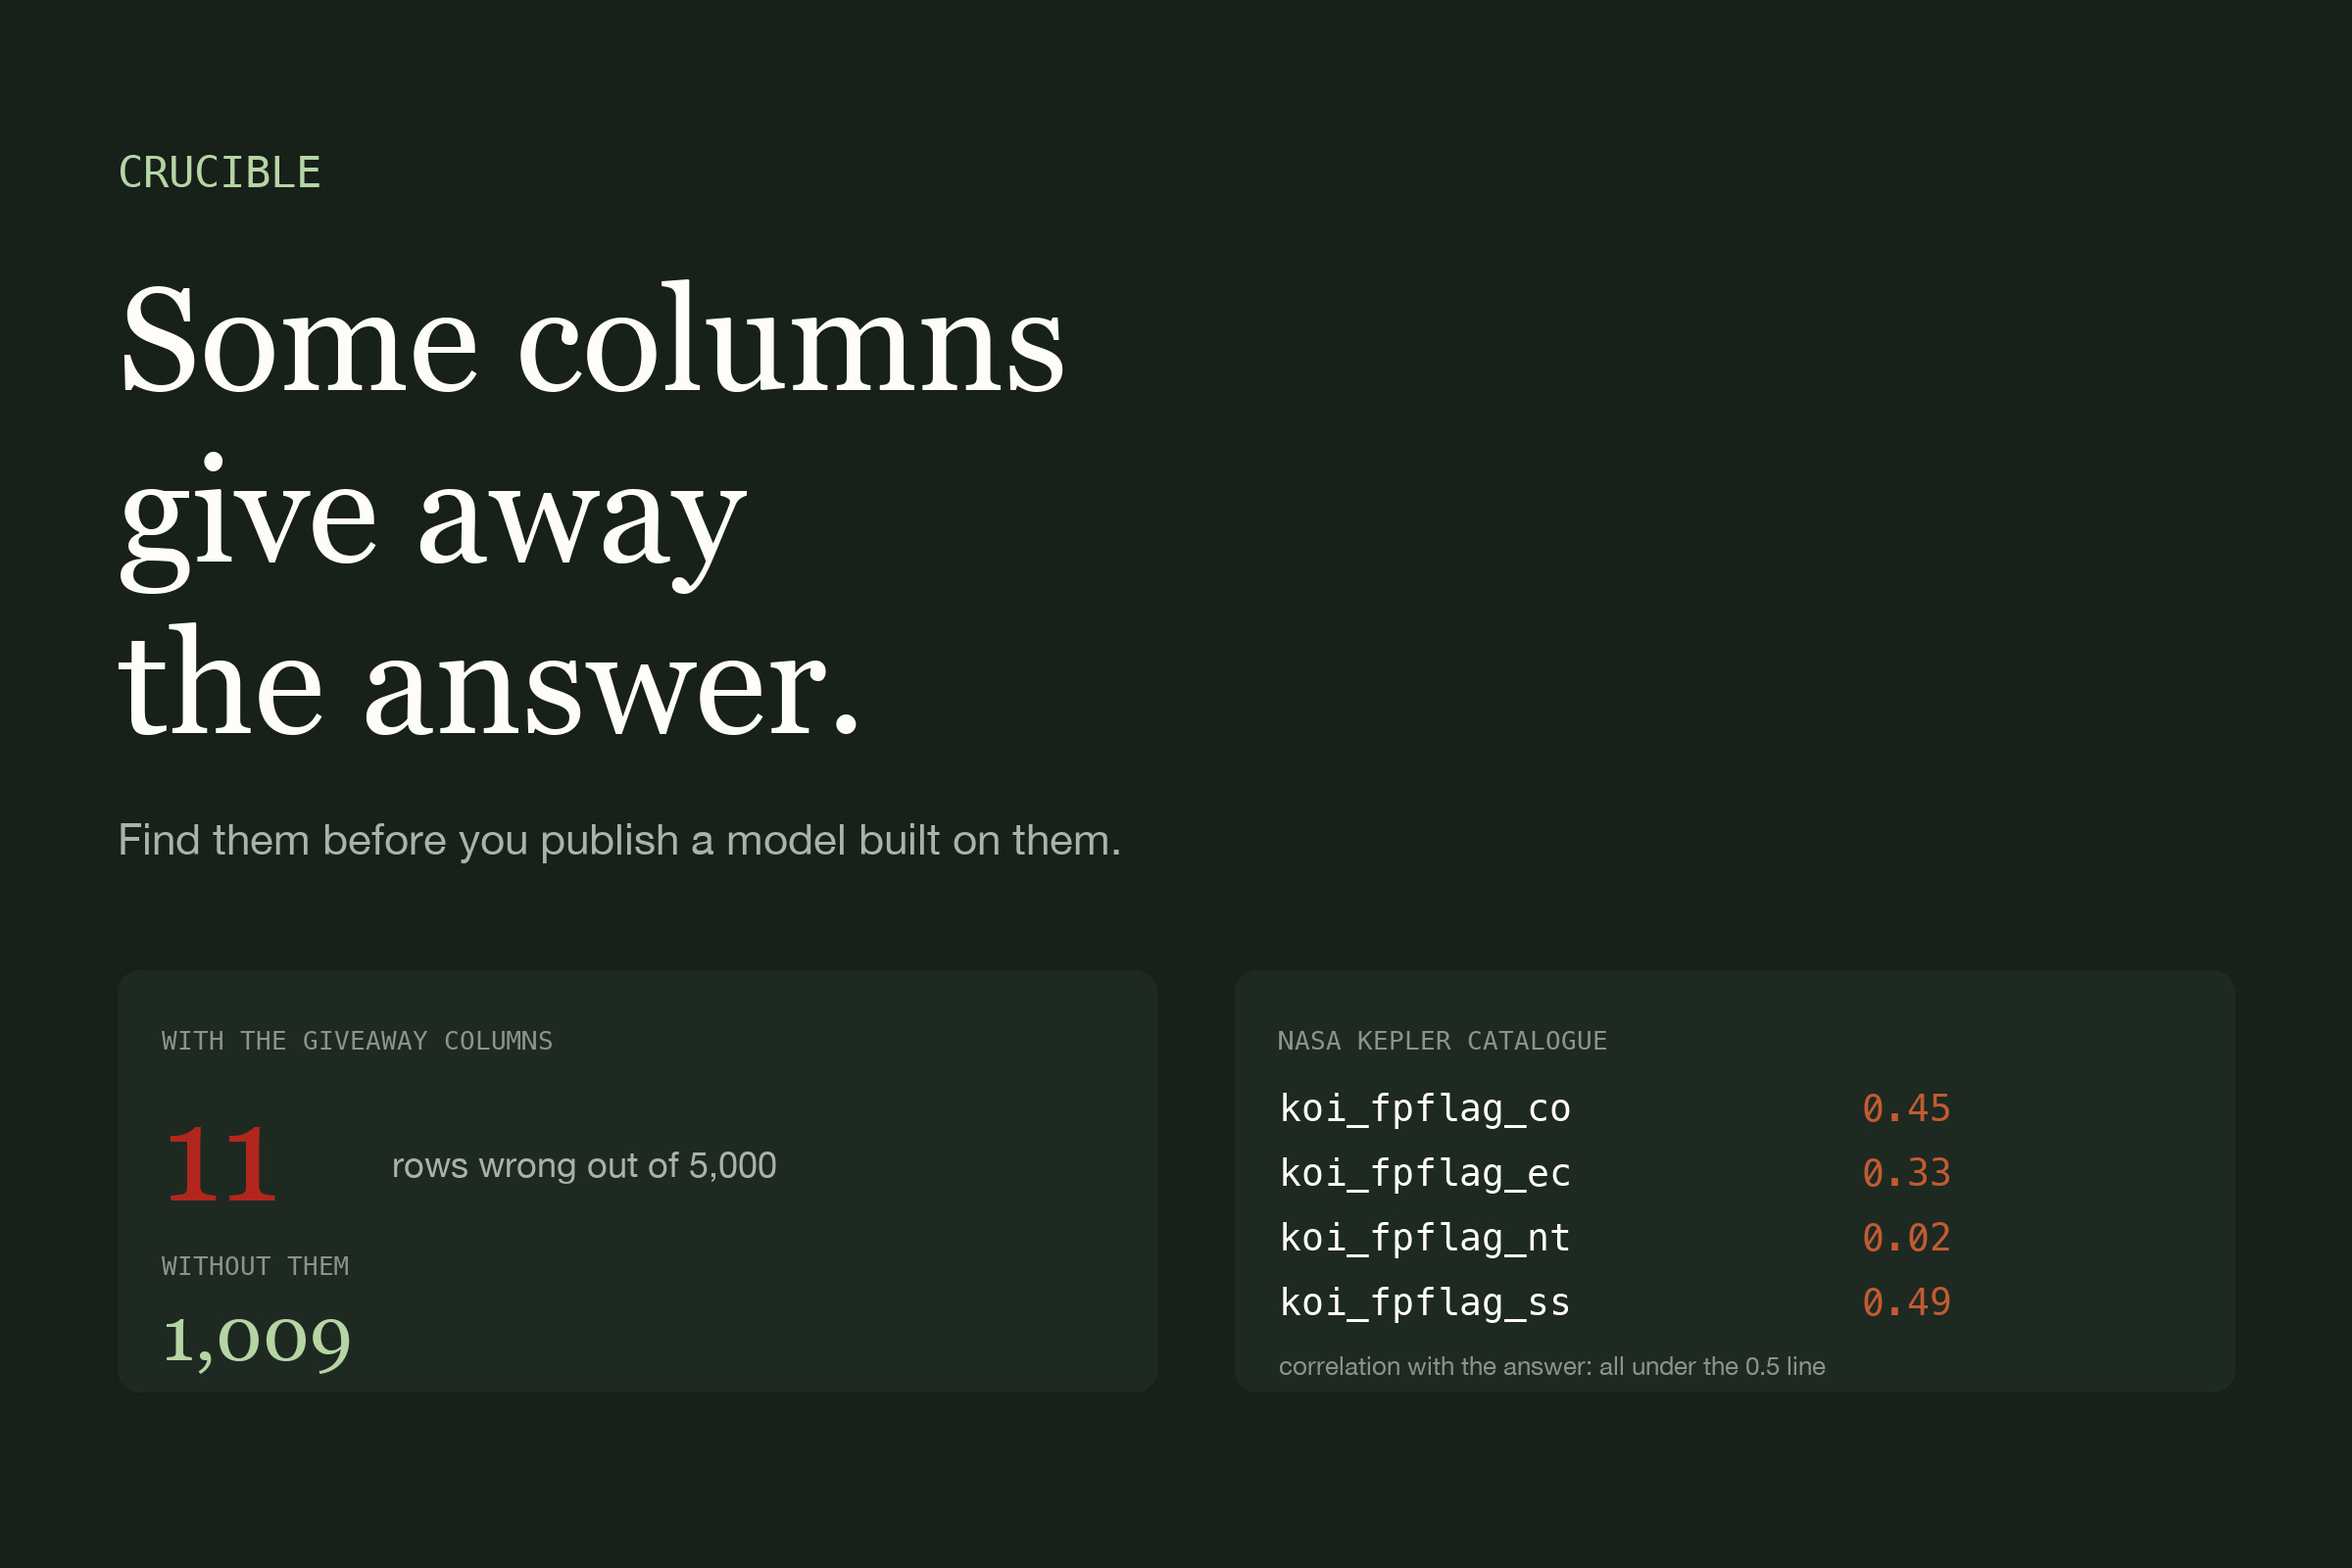
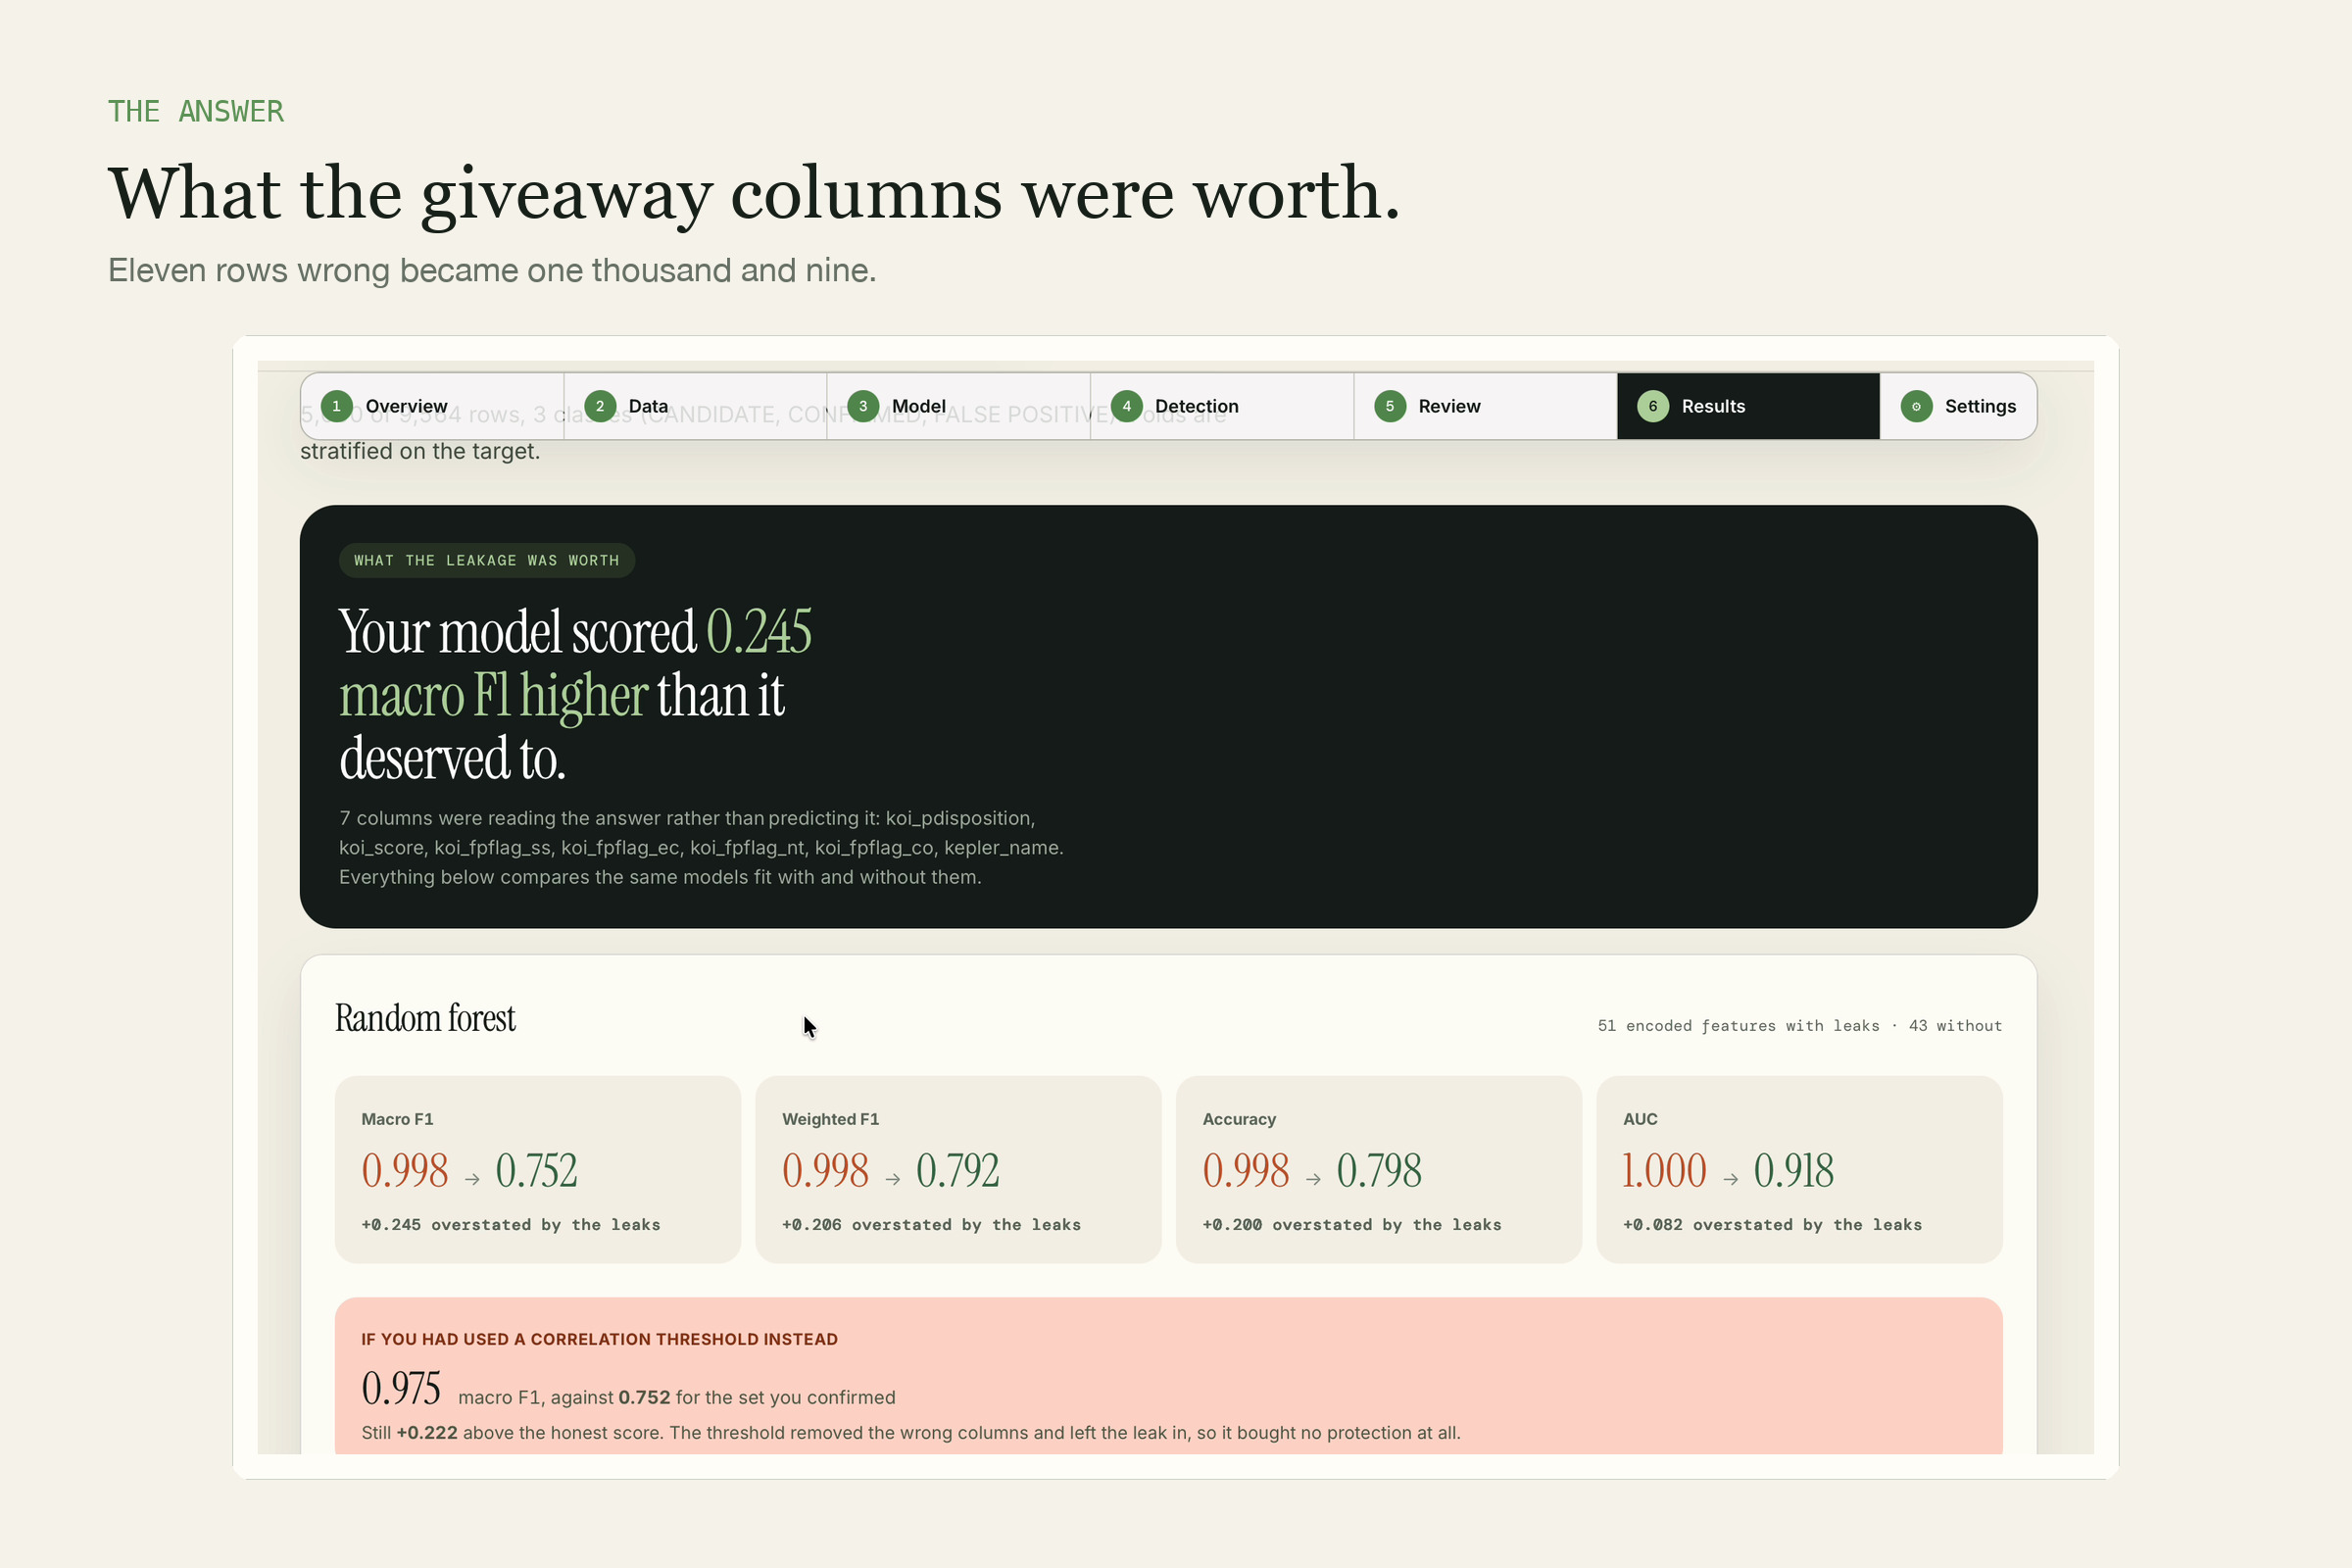
Four vetting flags gave away the answer. 11 rows wrong became 1,009 once they were removed.
-
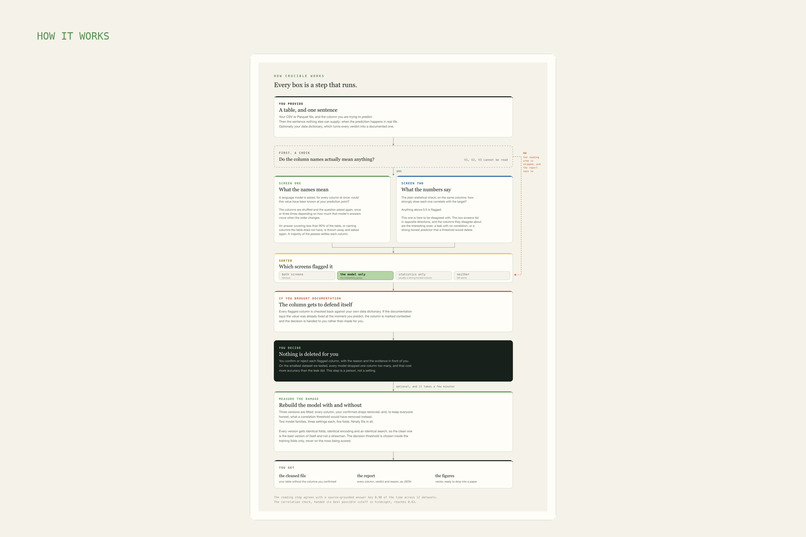
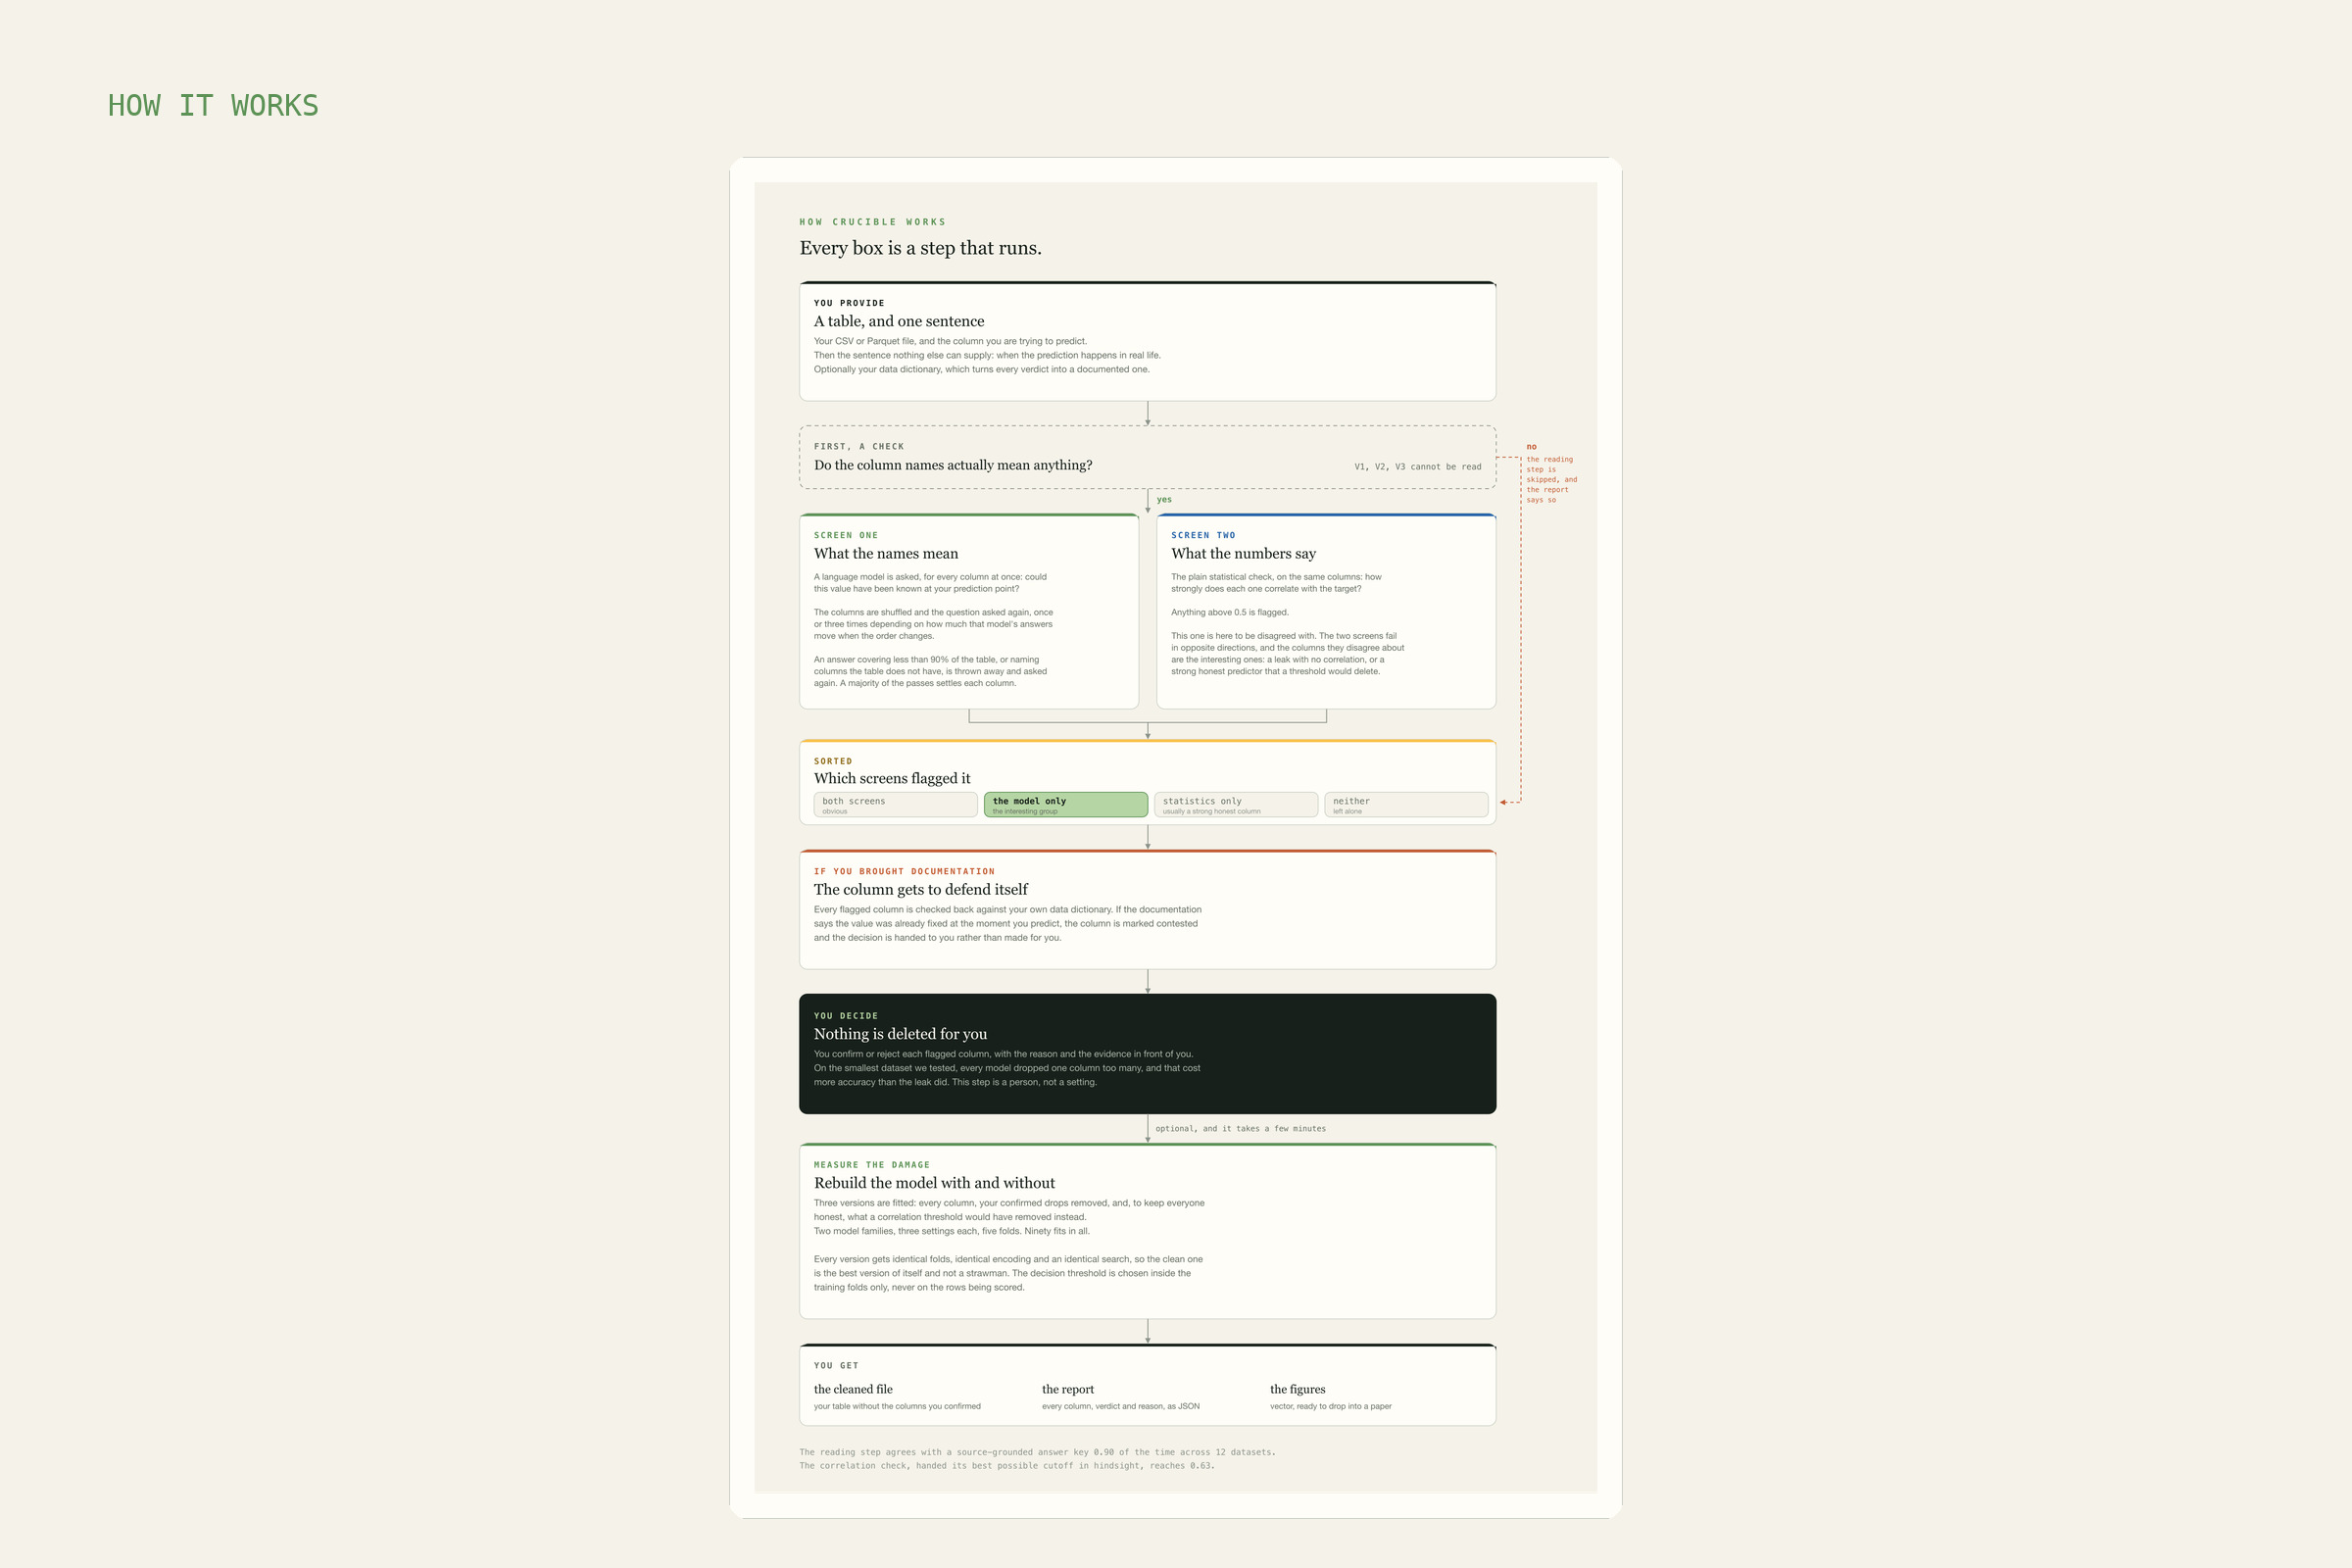
Every step that runs: two screens, a documentation check, your decision, then the measurement.
-
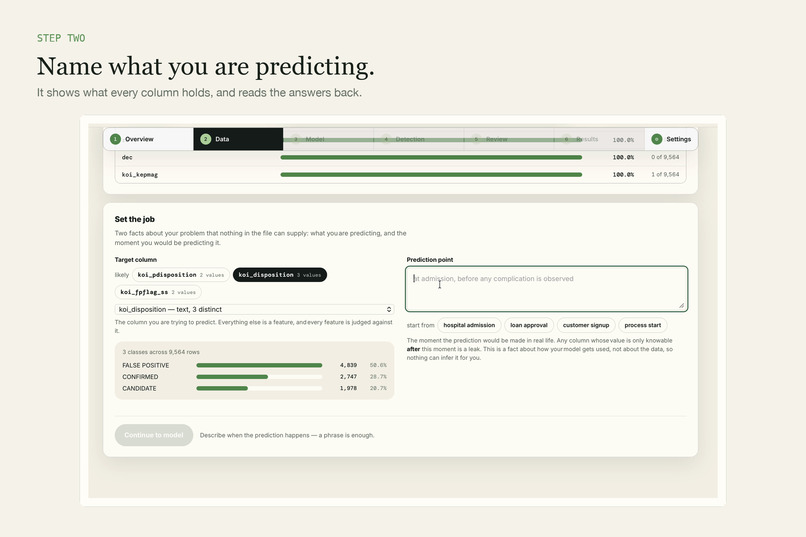
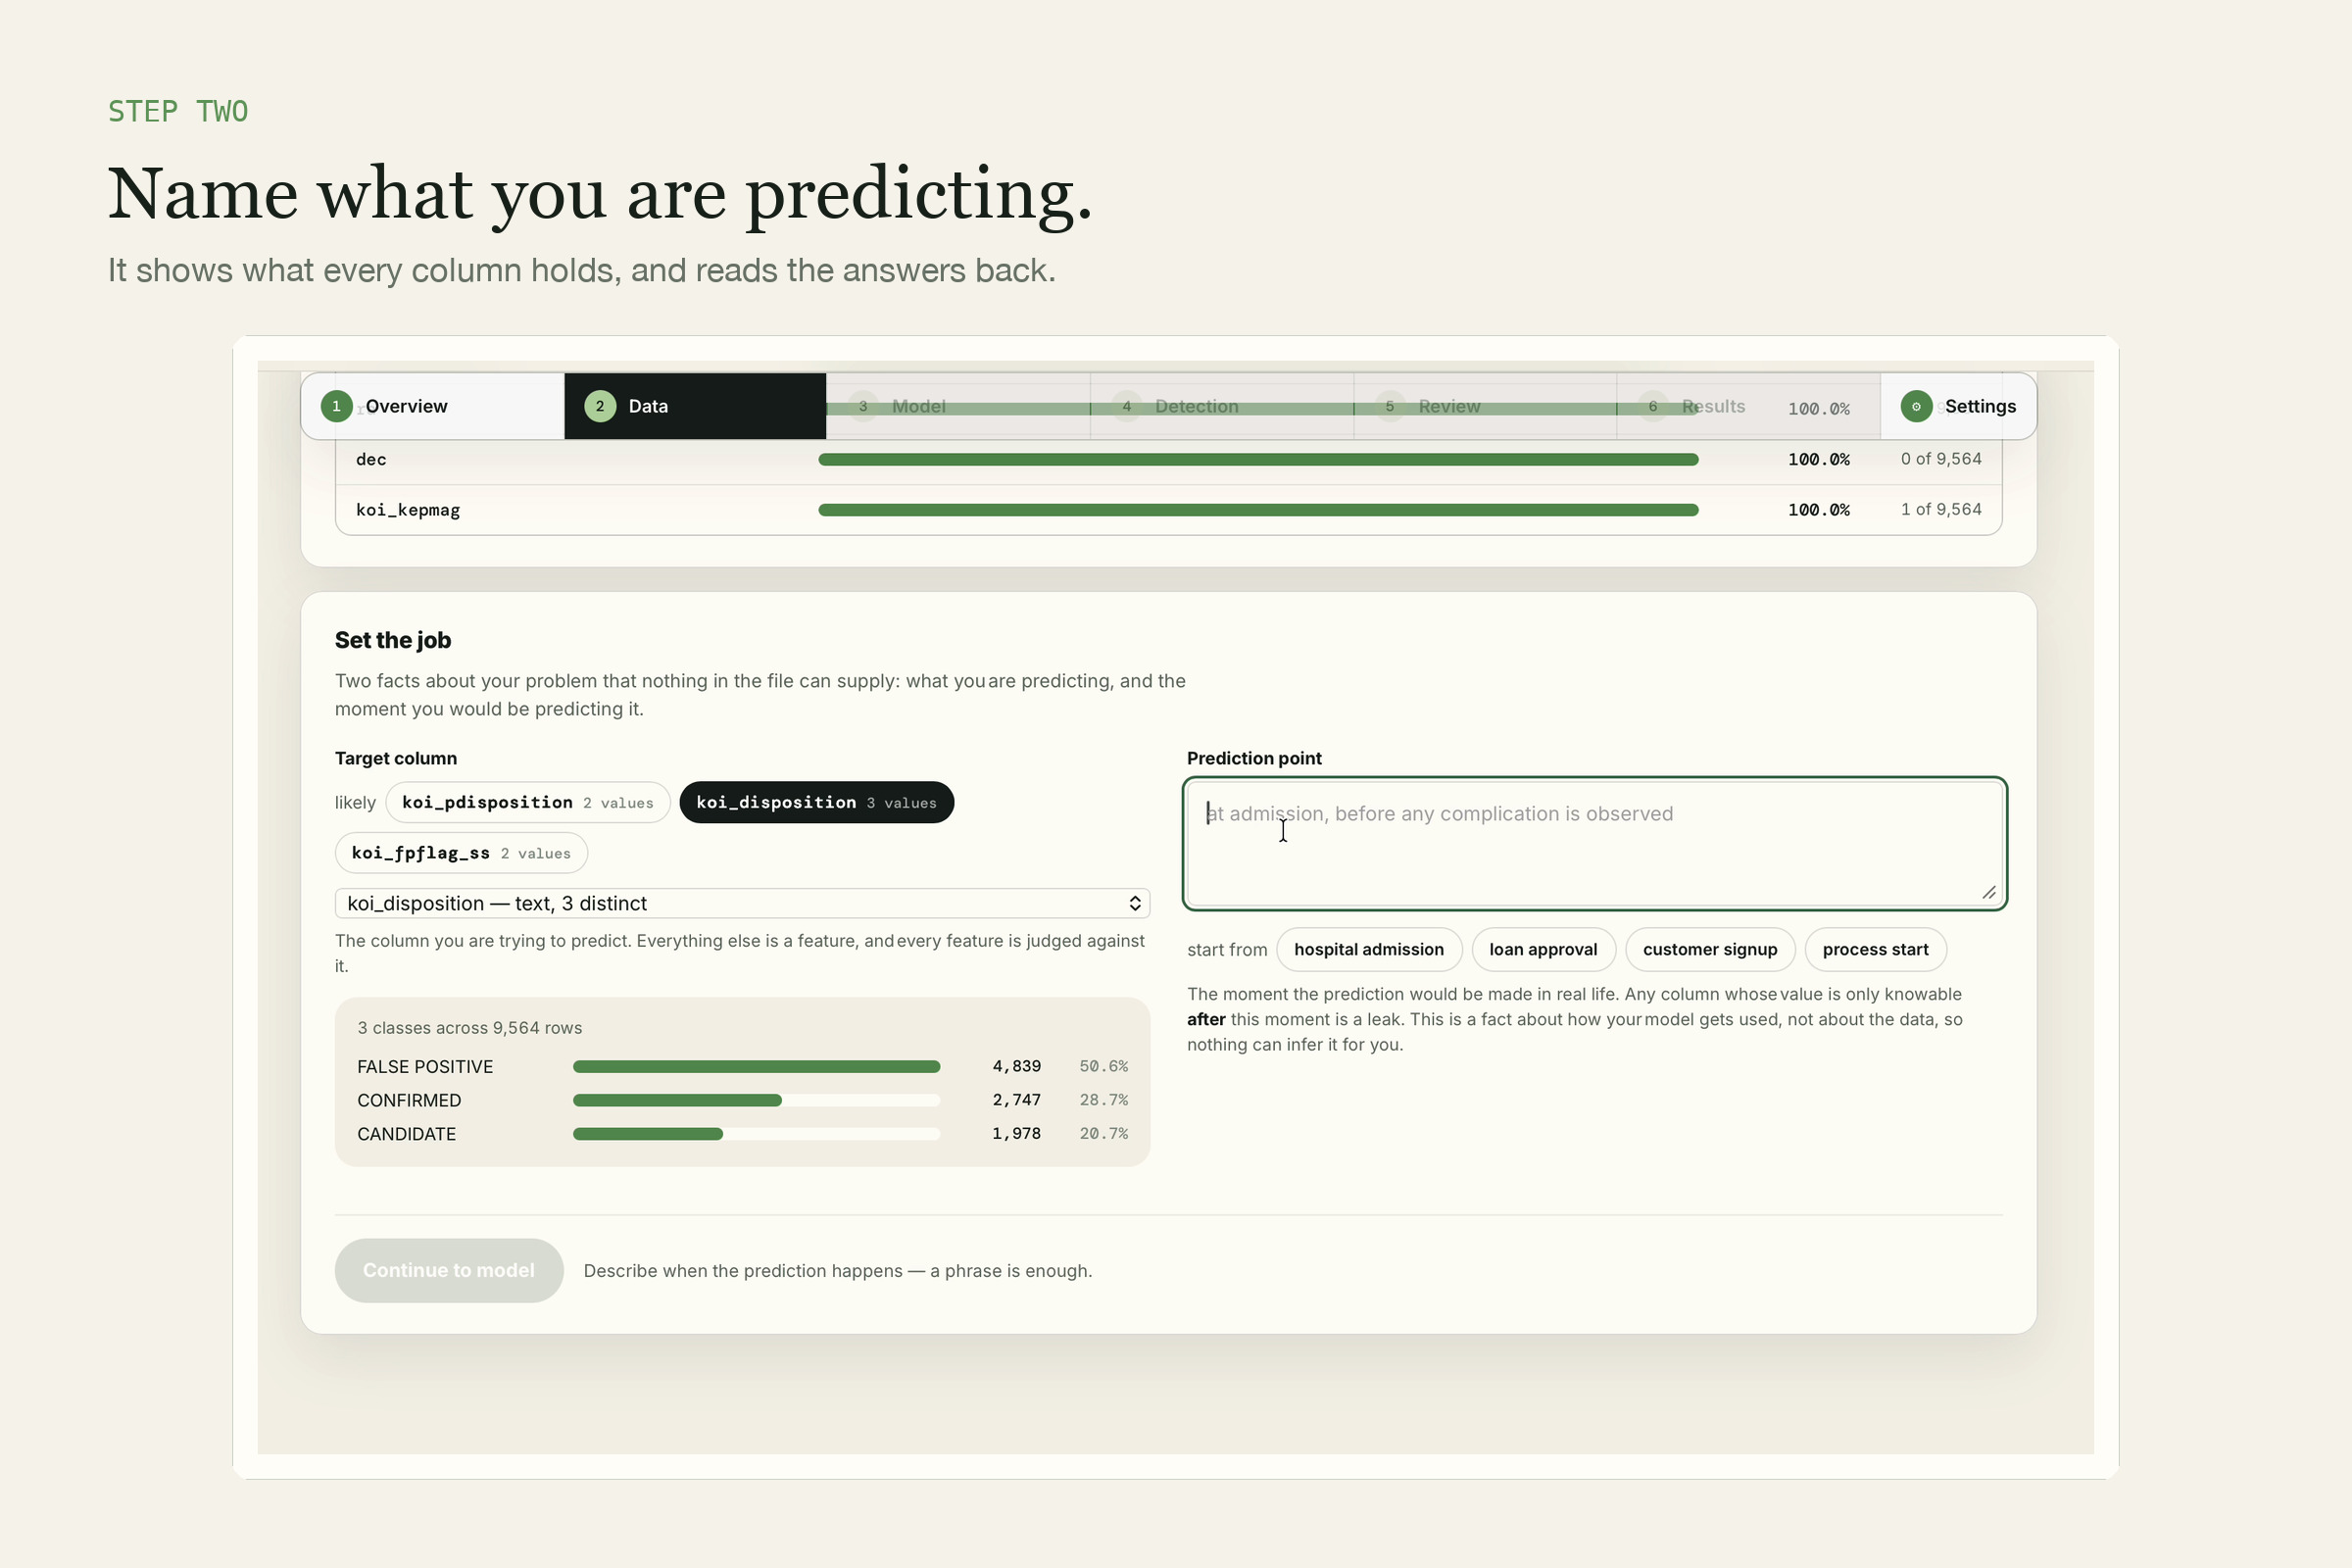
Pick the target. It shows what every column holds and reads the answer classes back to you.
-
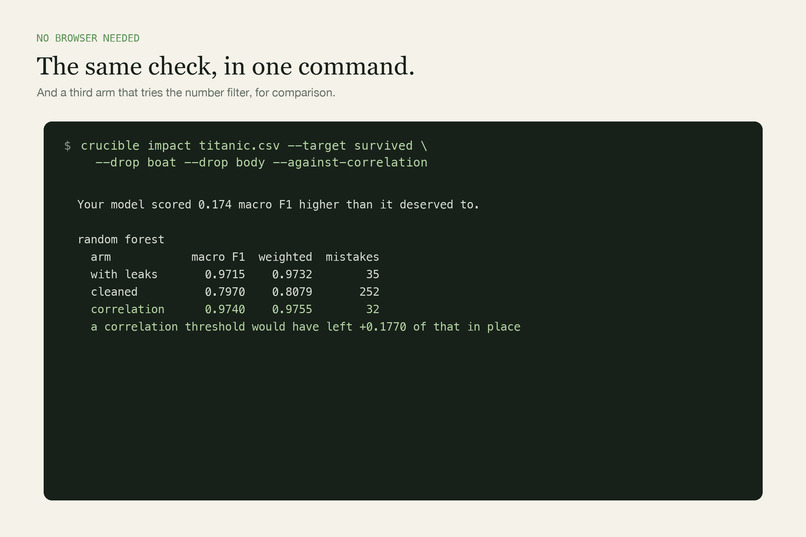
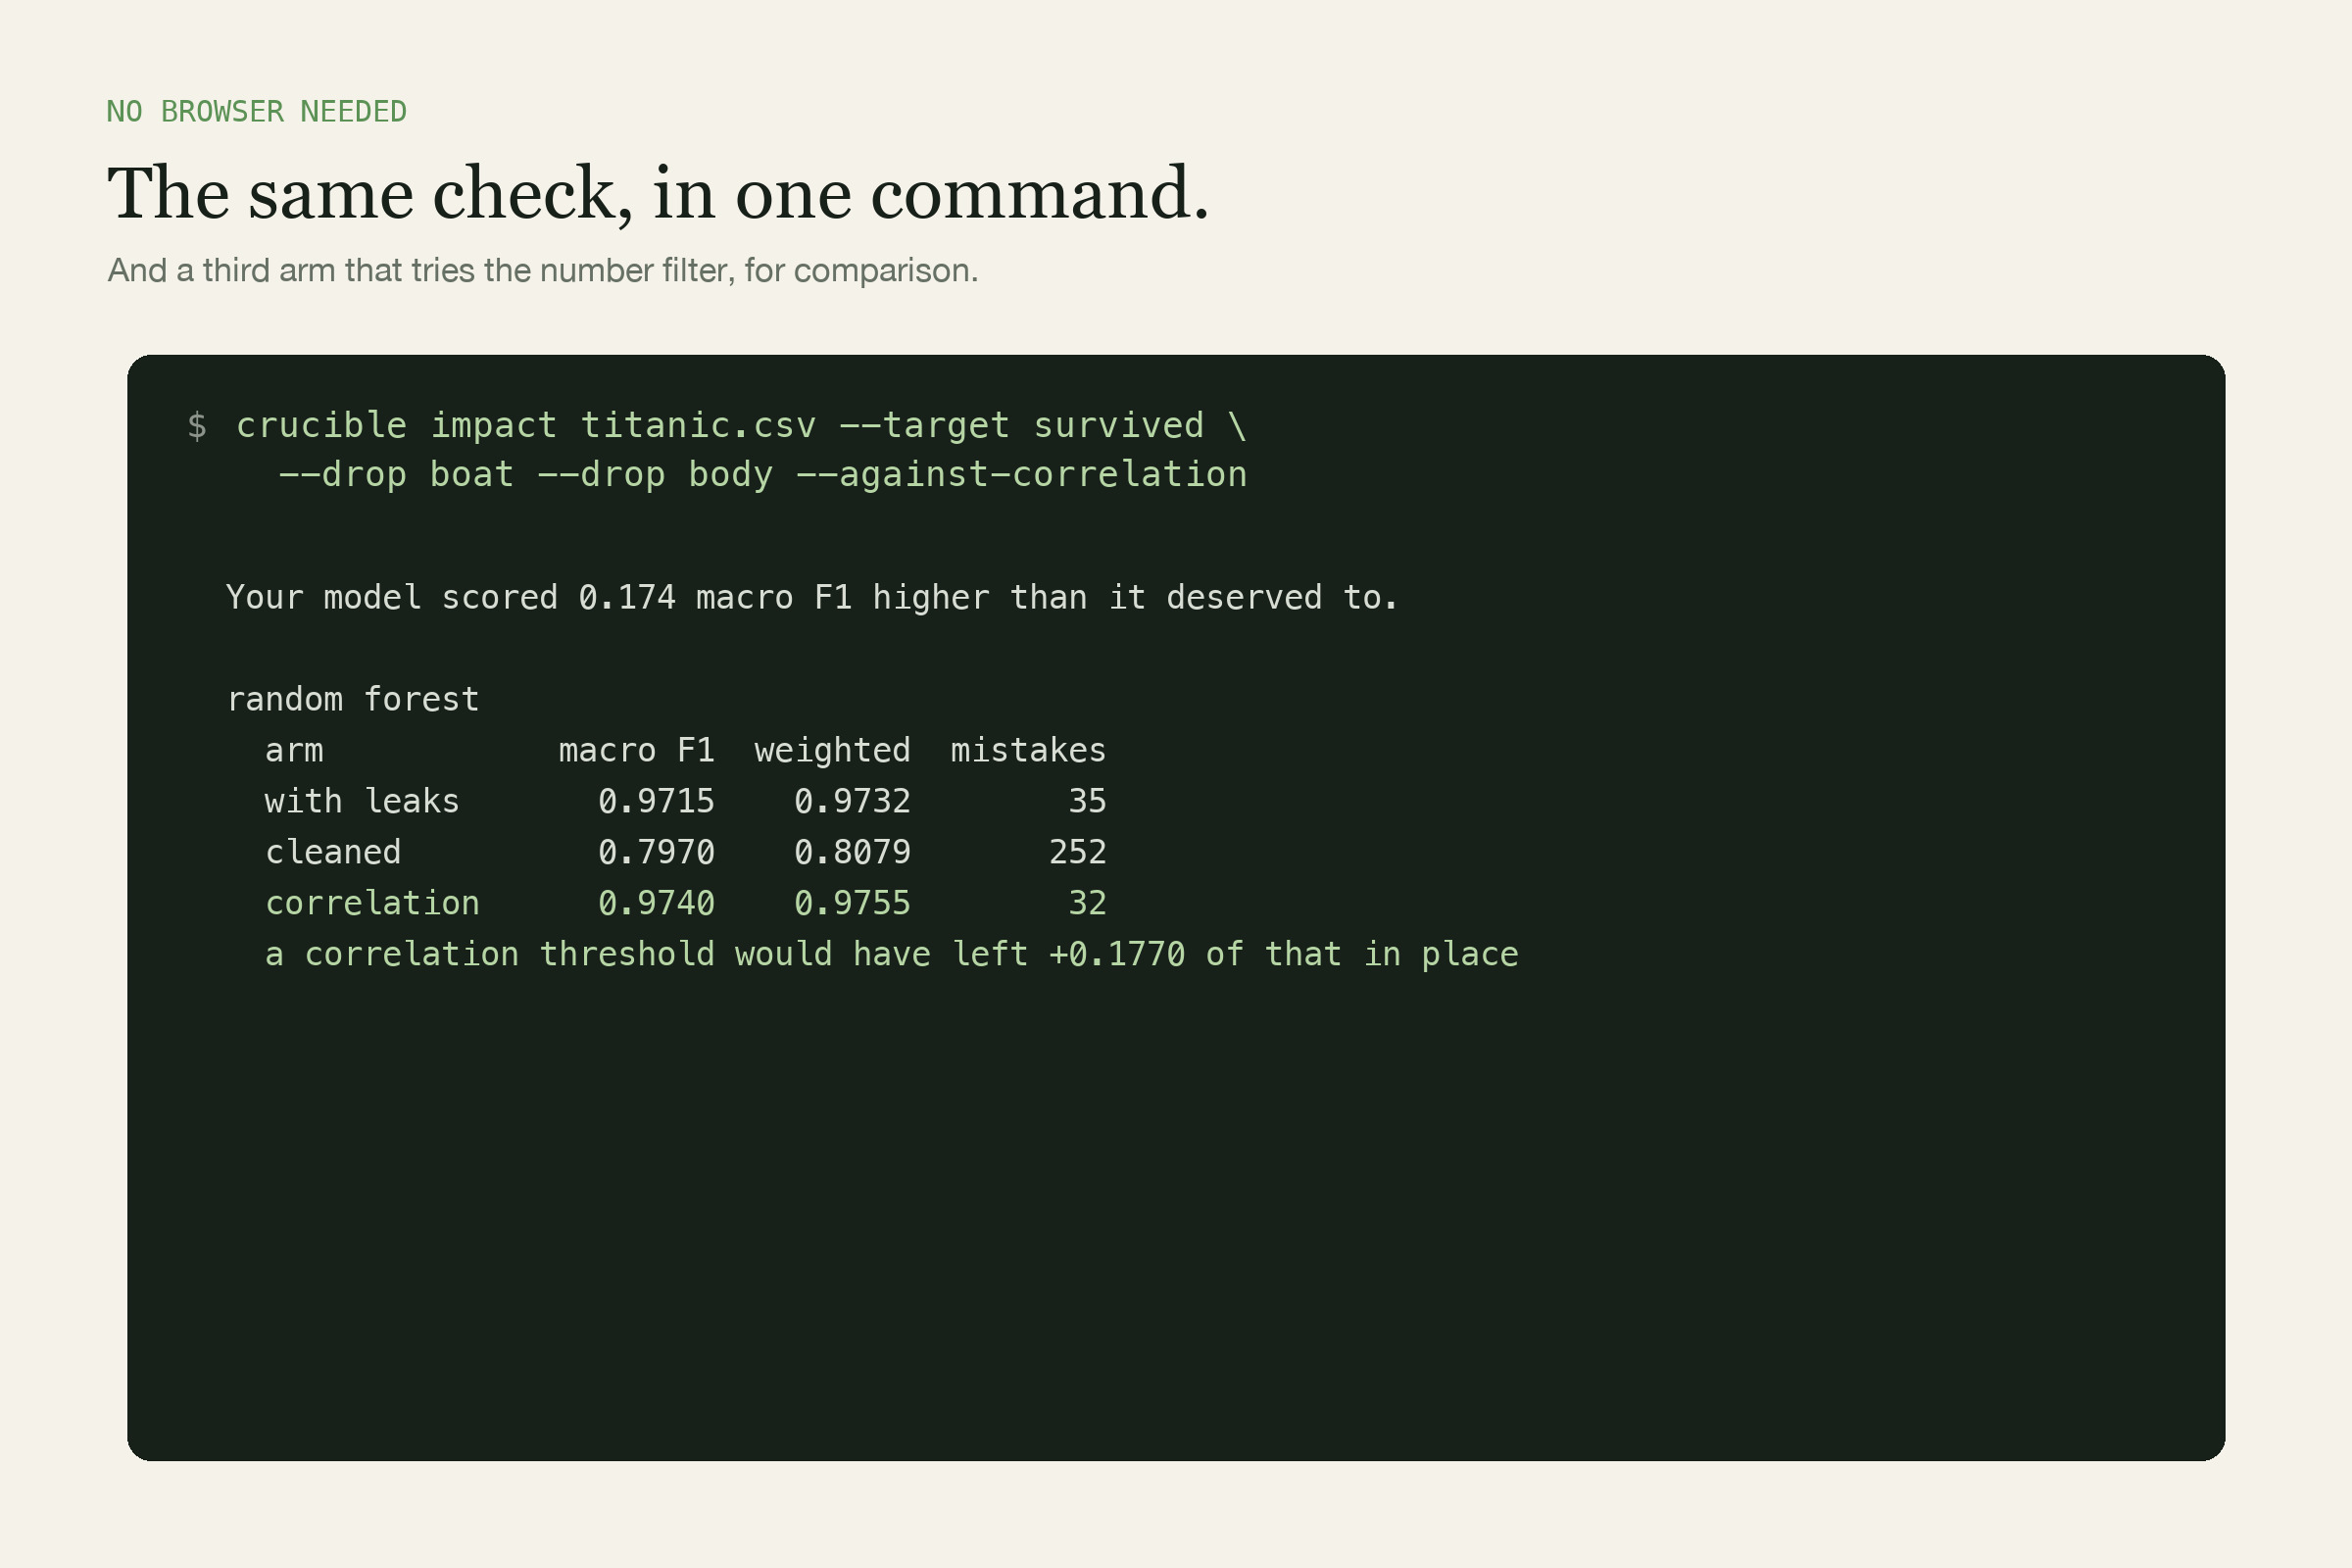
One command does the same job, with a control arm showing the cheap filter scoring higher.
-
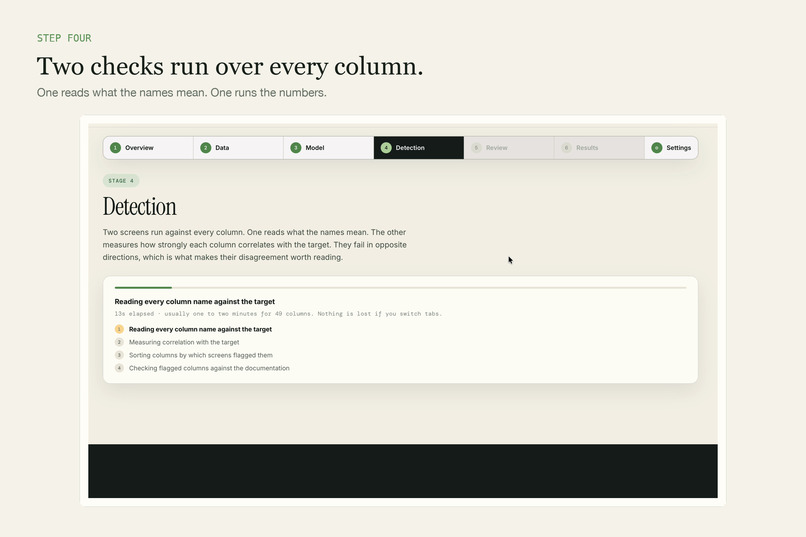
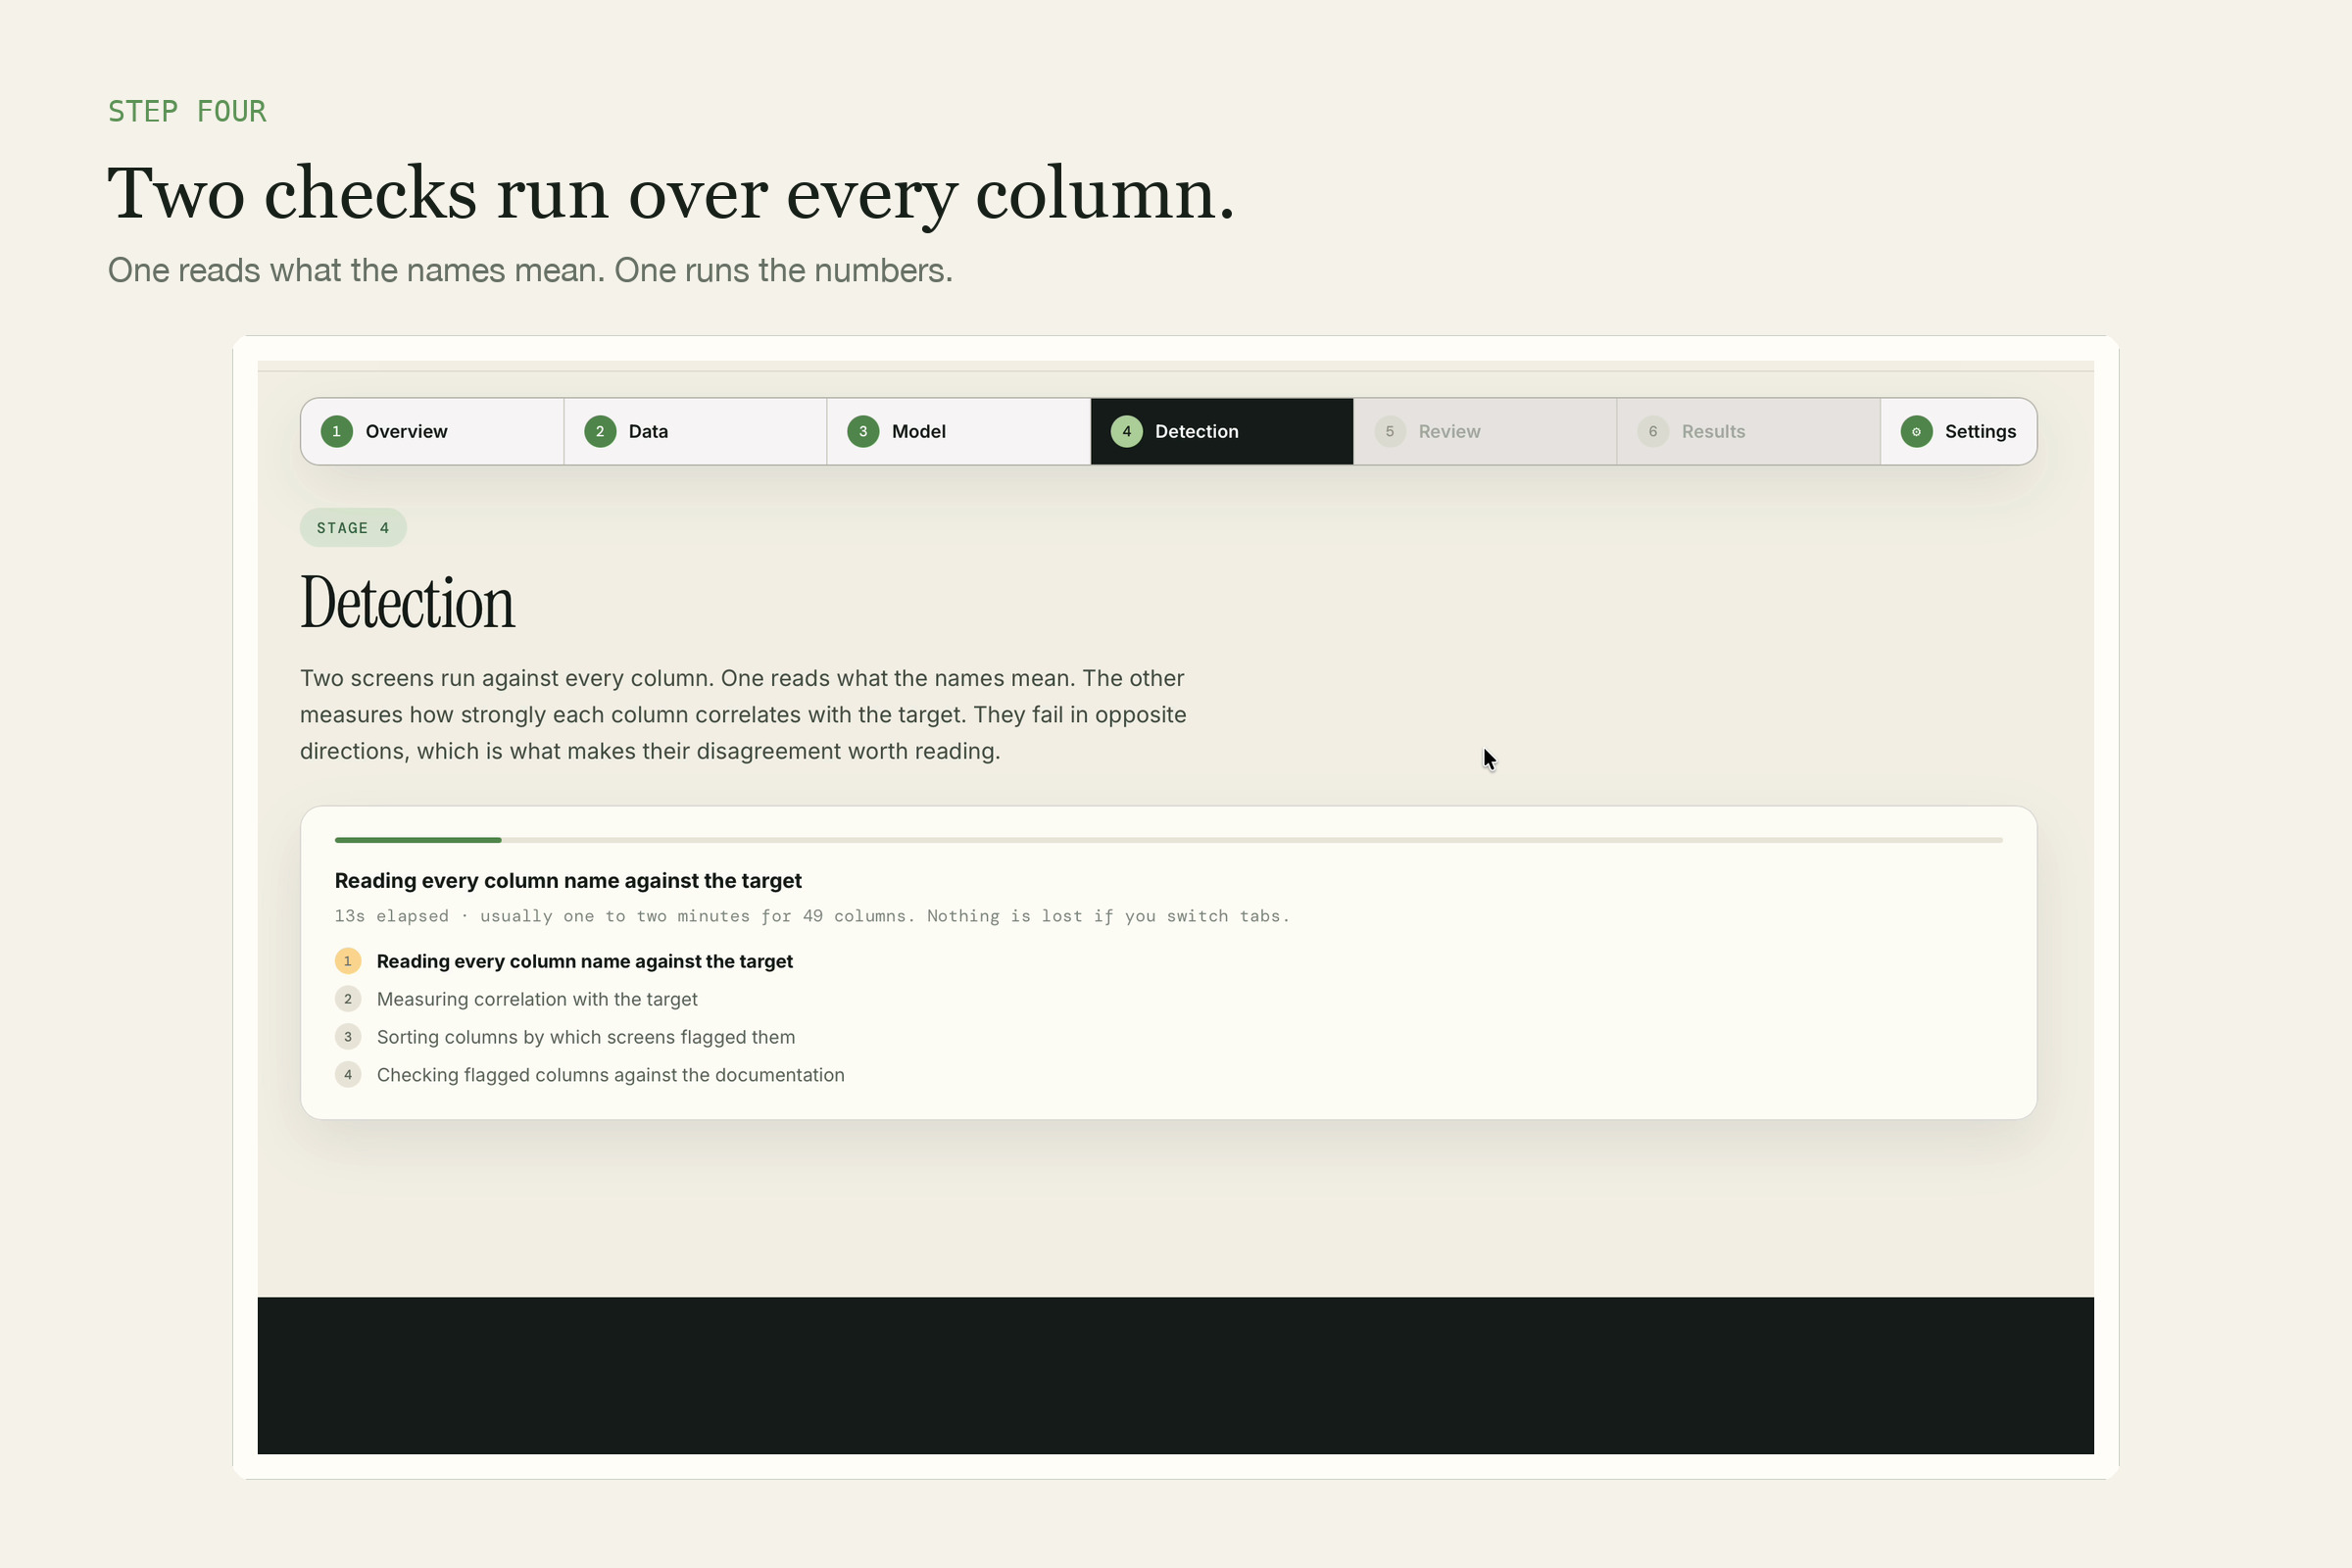
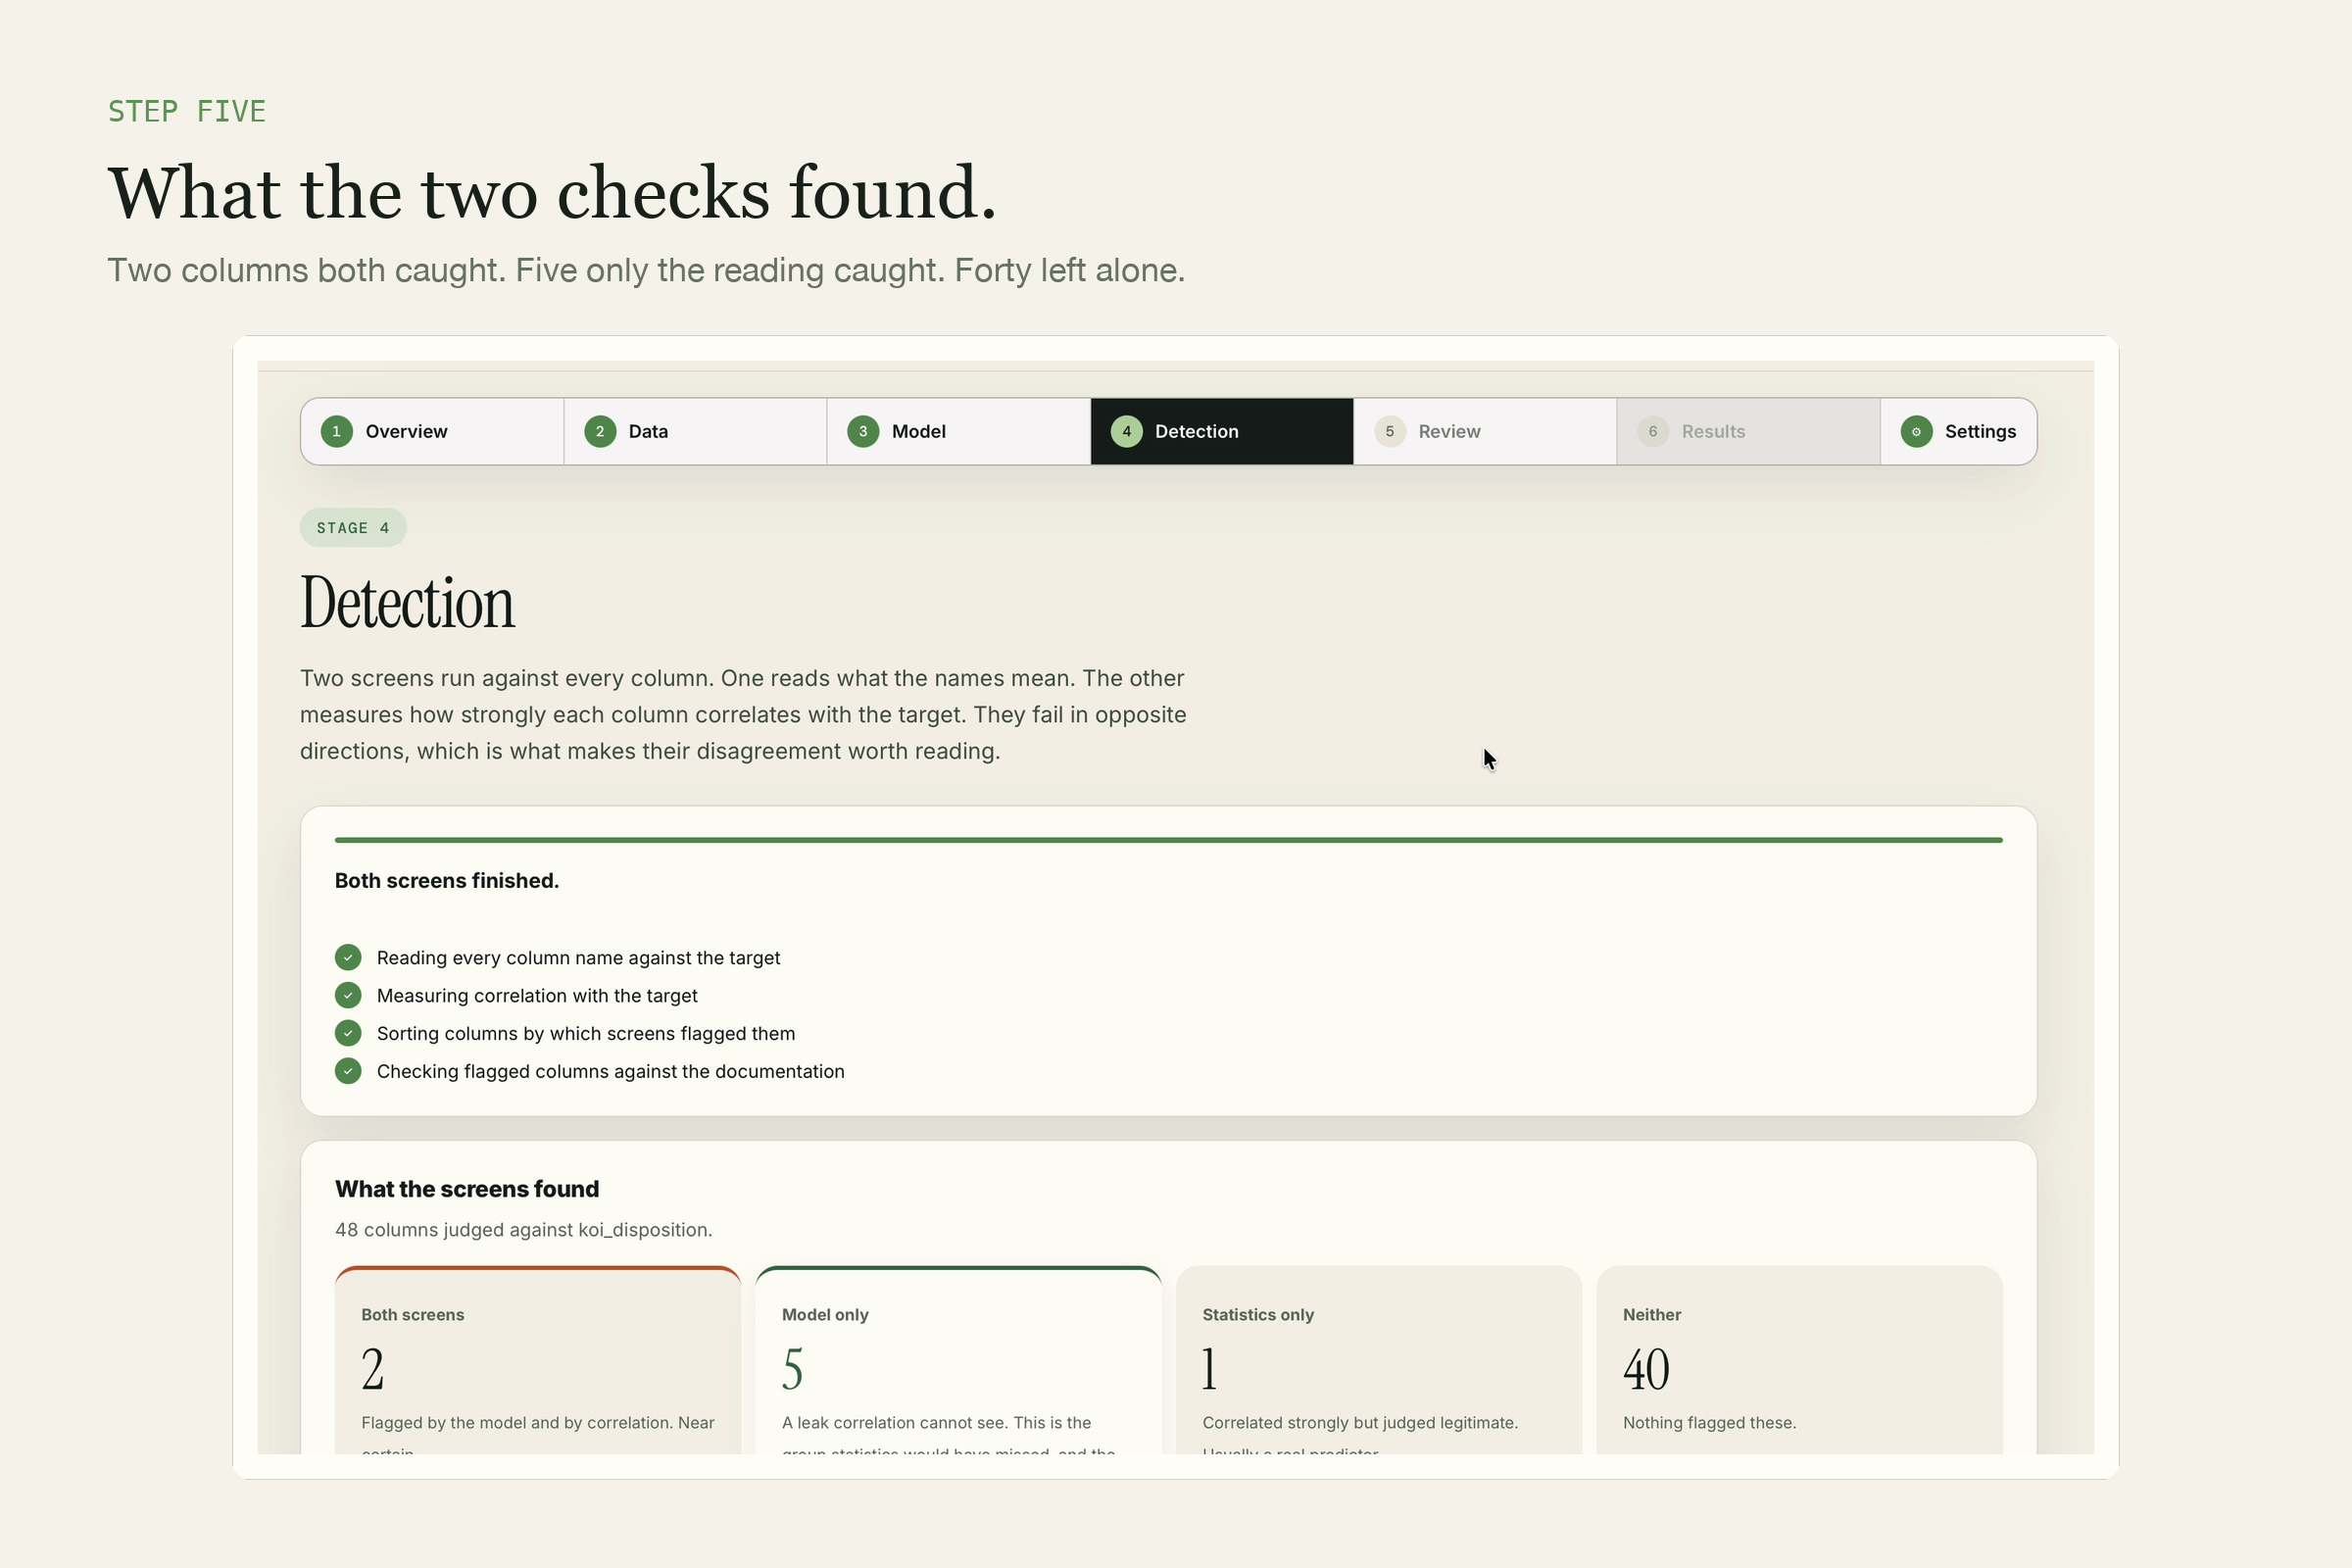
Two screens run over all 49 columns. One reads the names, the other measures correlation.
-
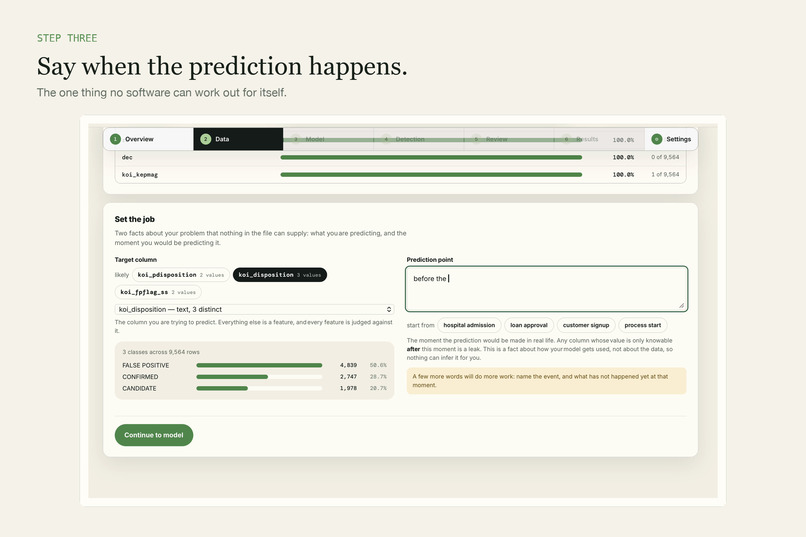
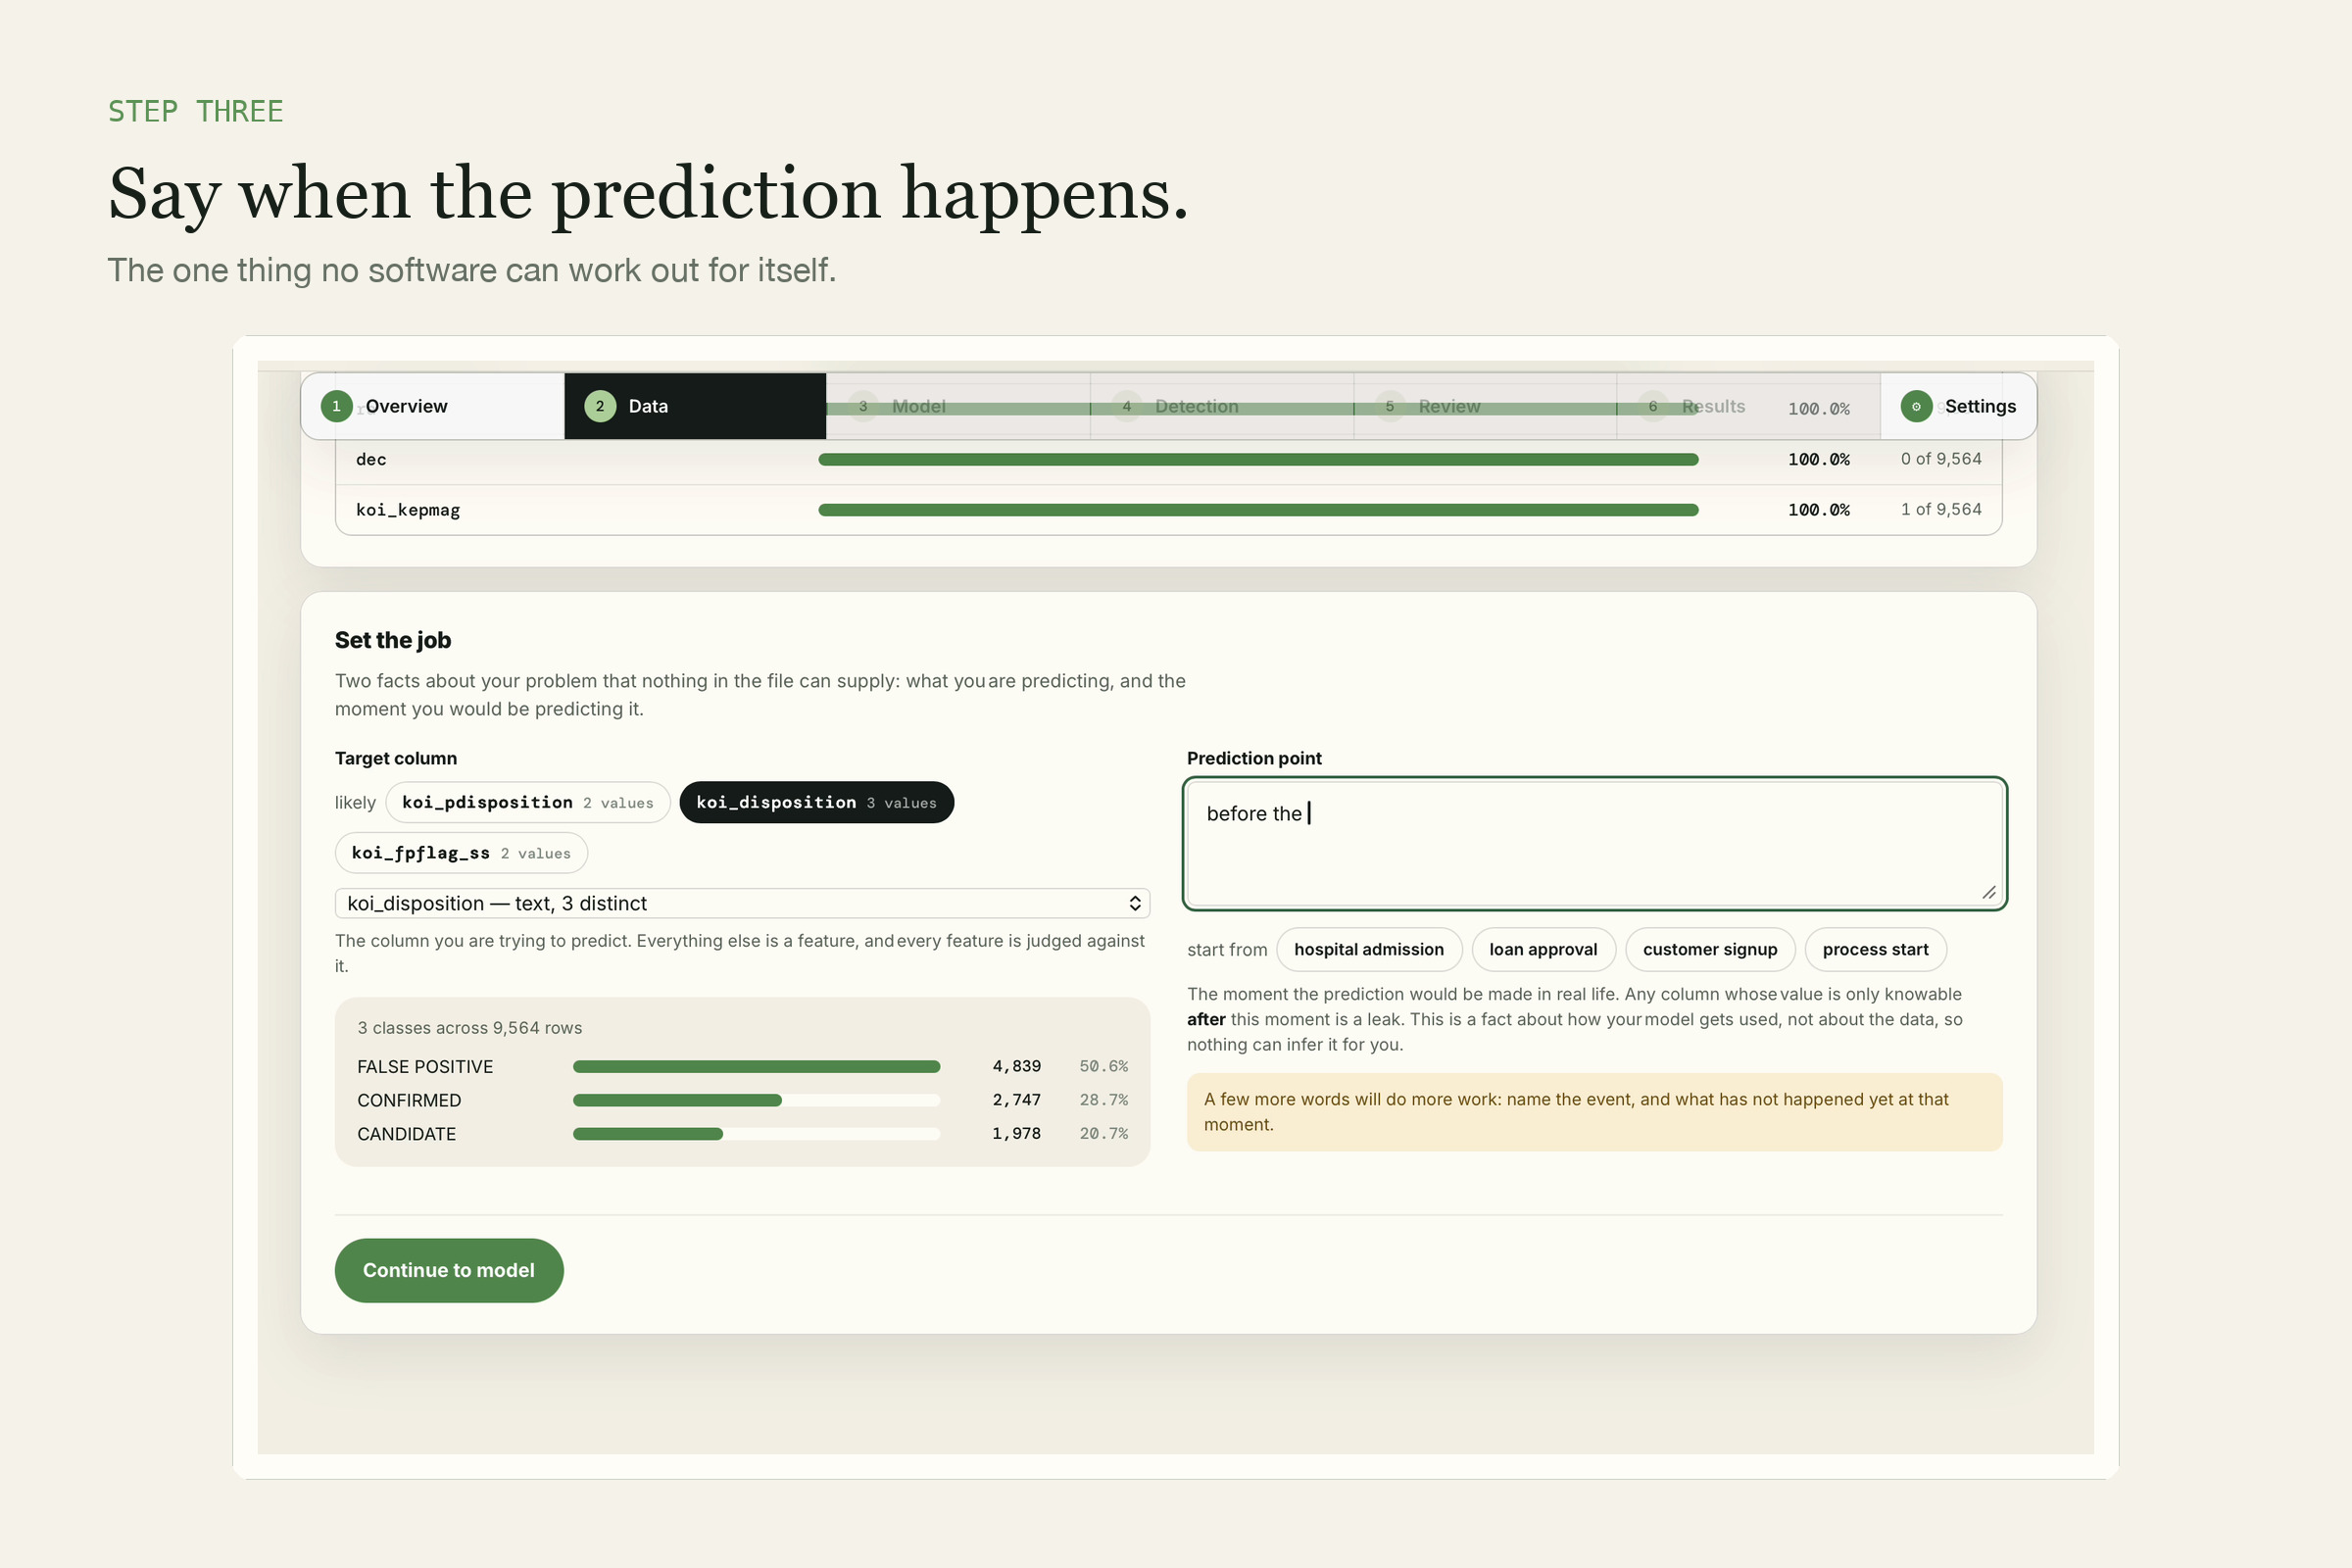
Type when the prediction happens: the one fact about your problem no software can infer.
-
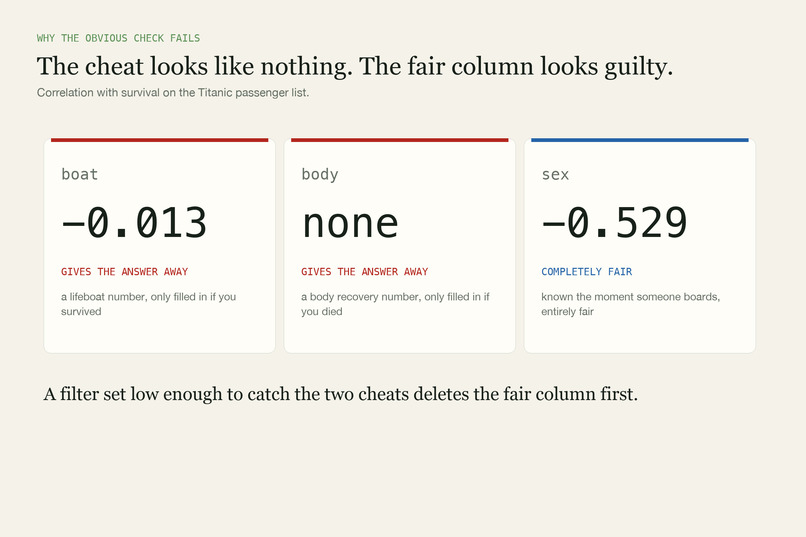
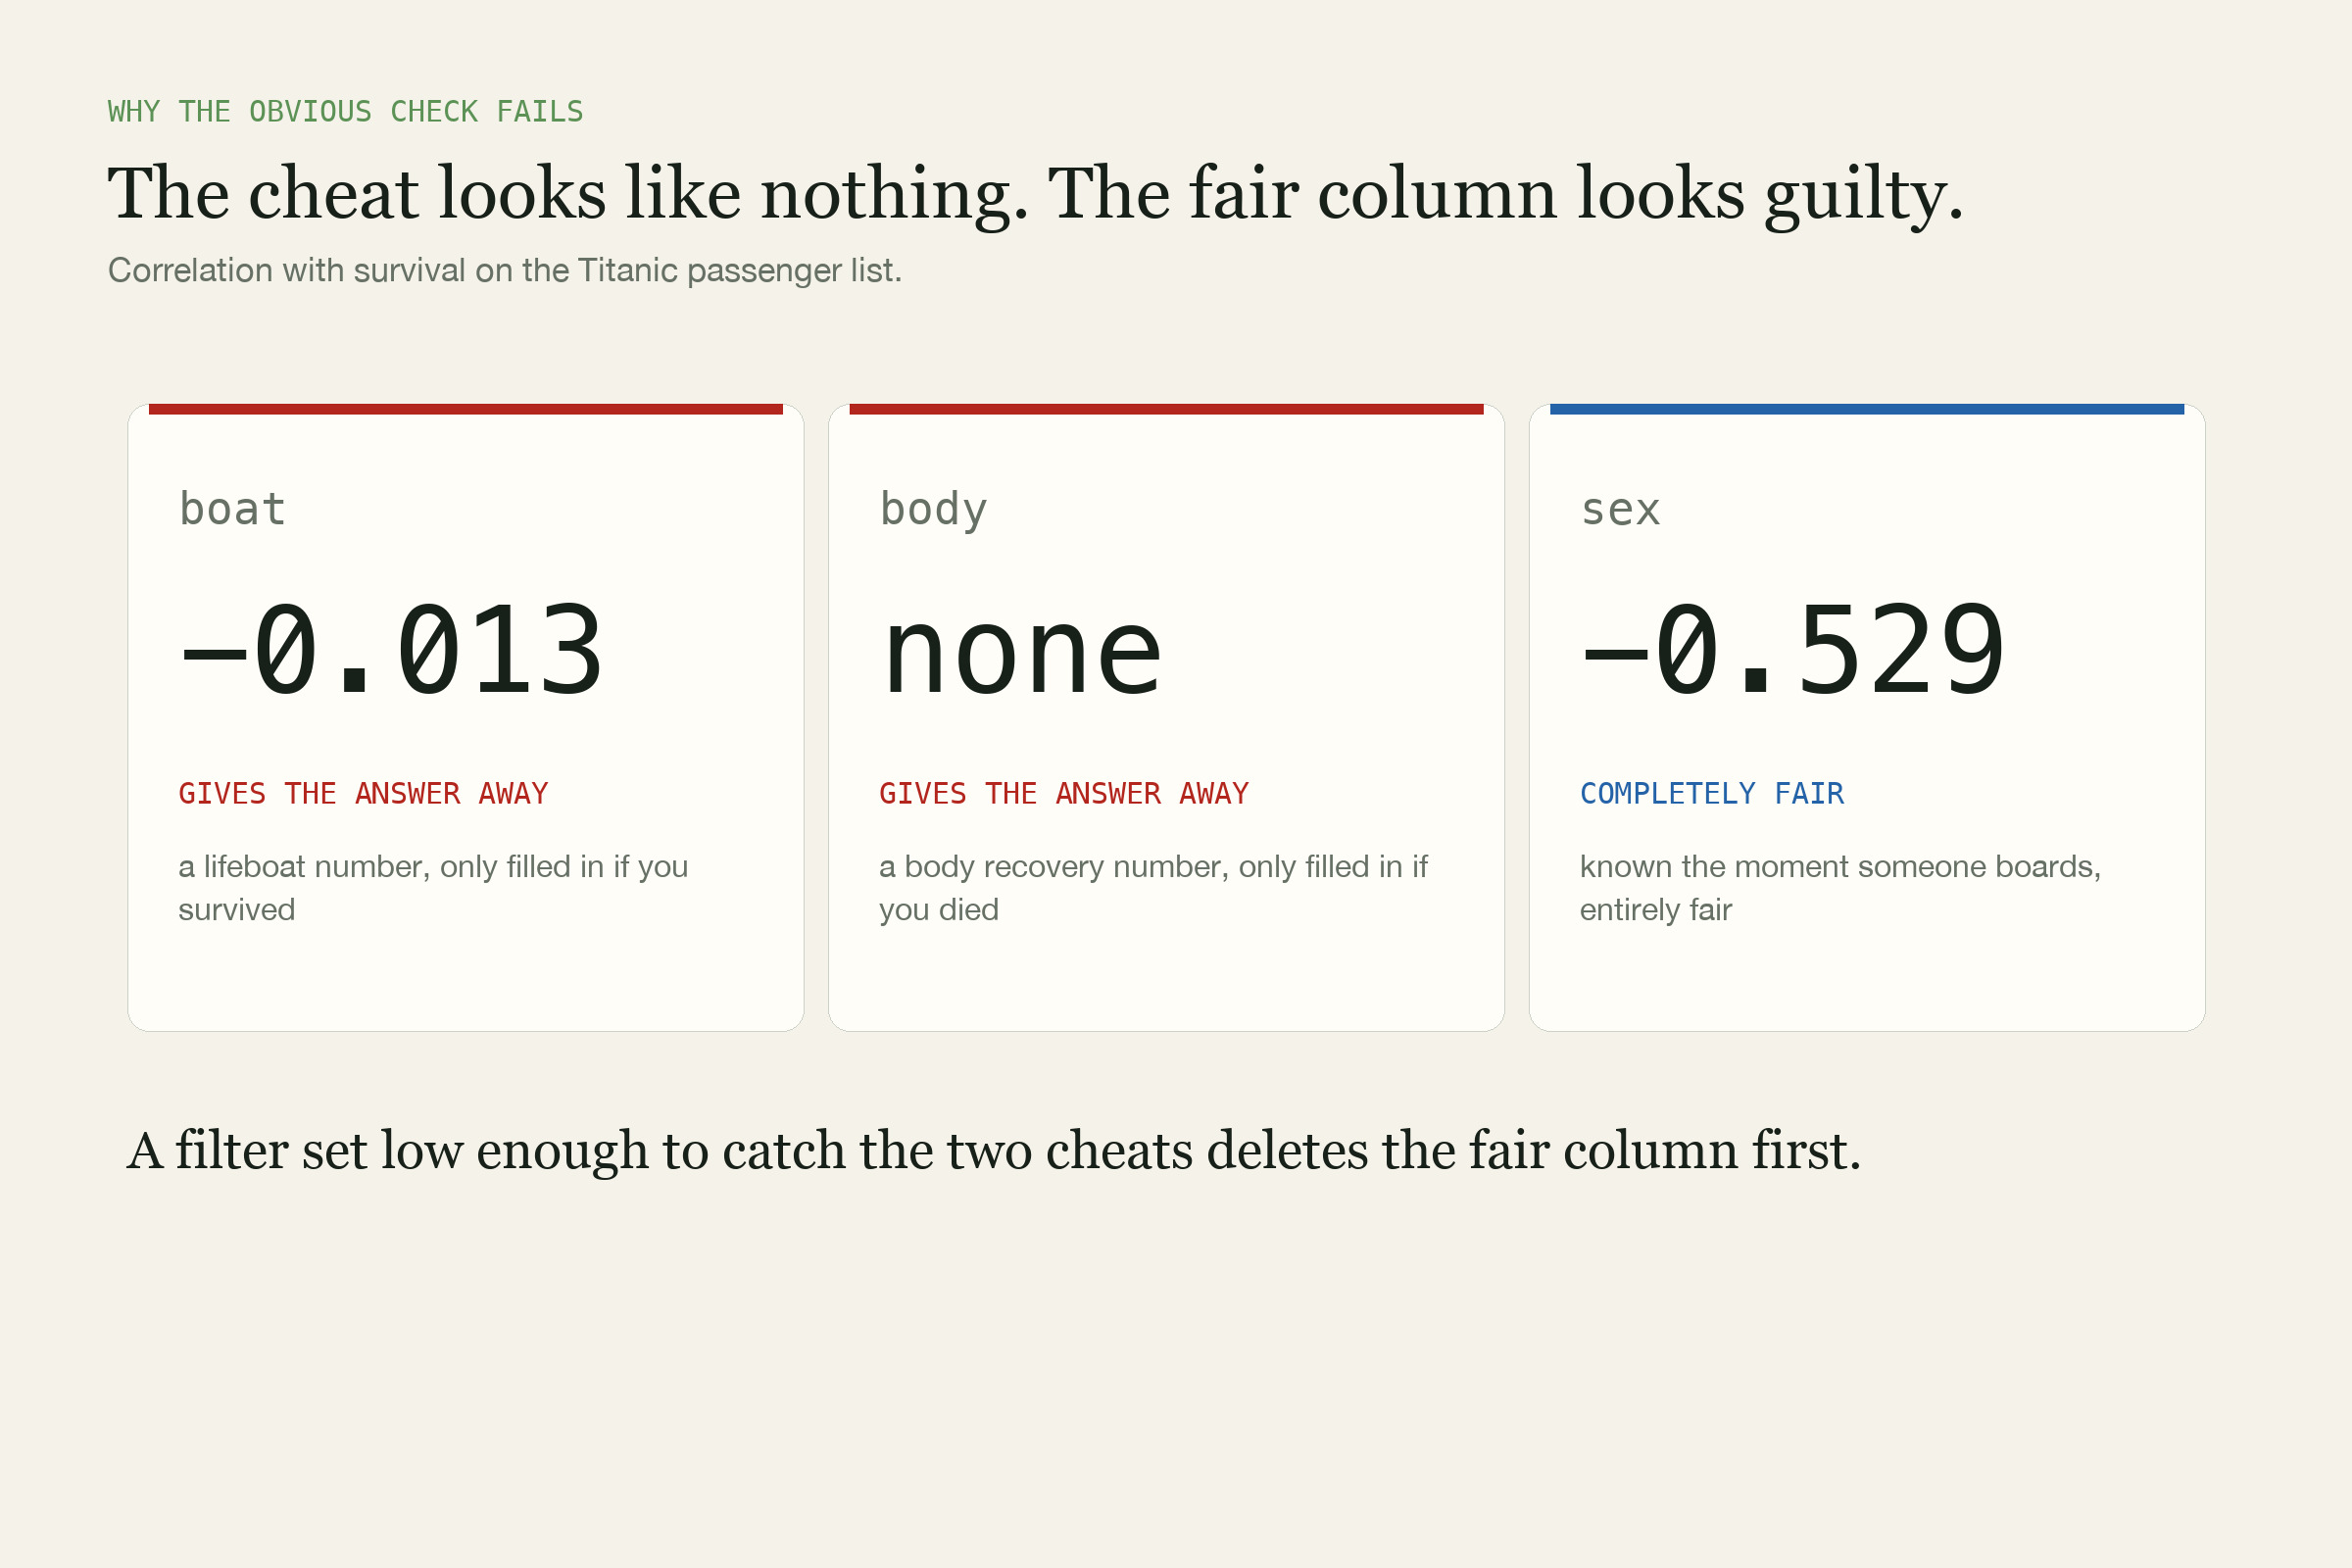
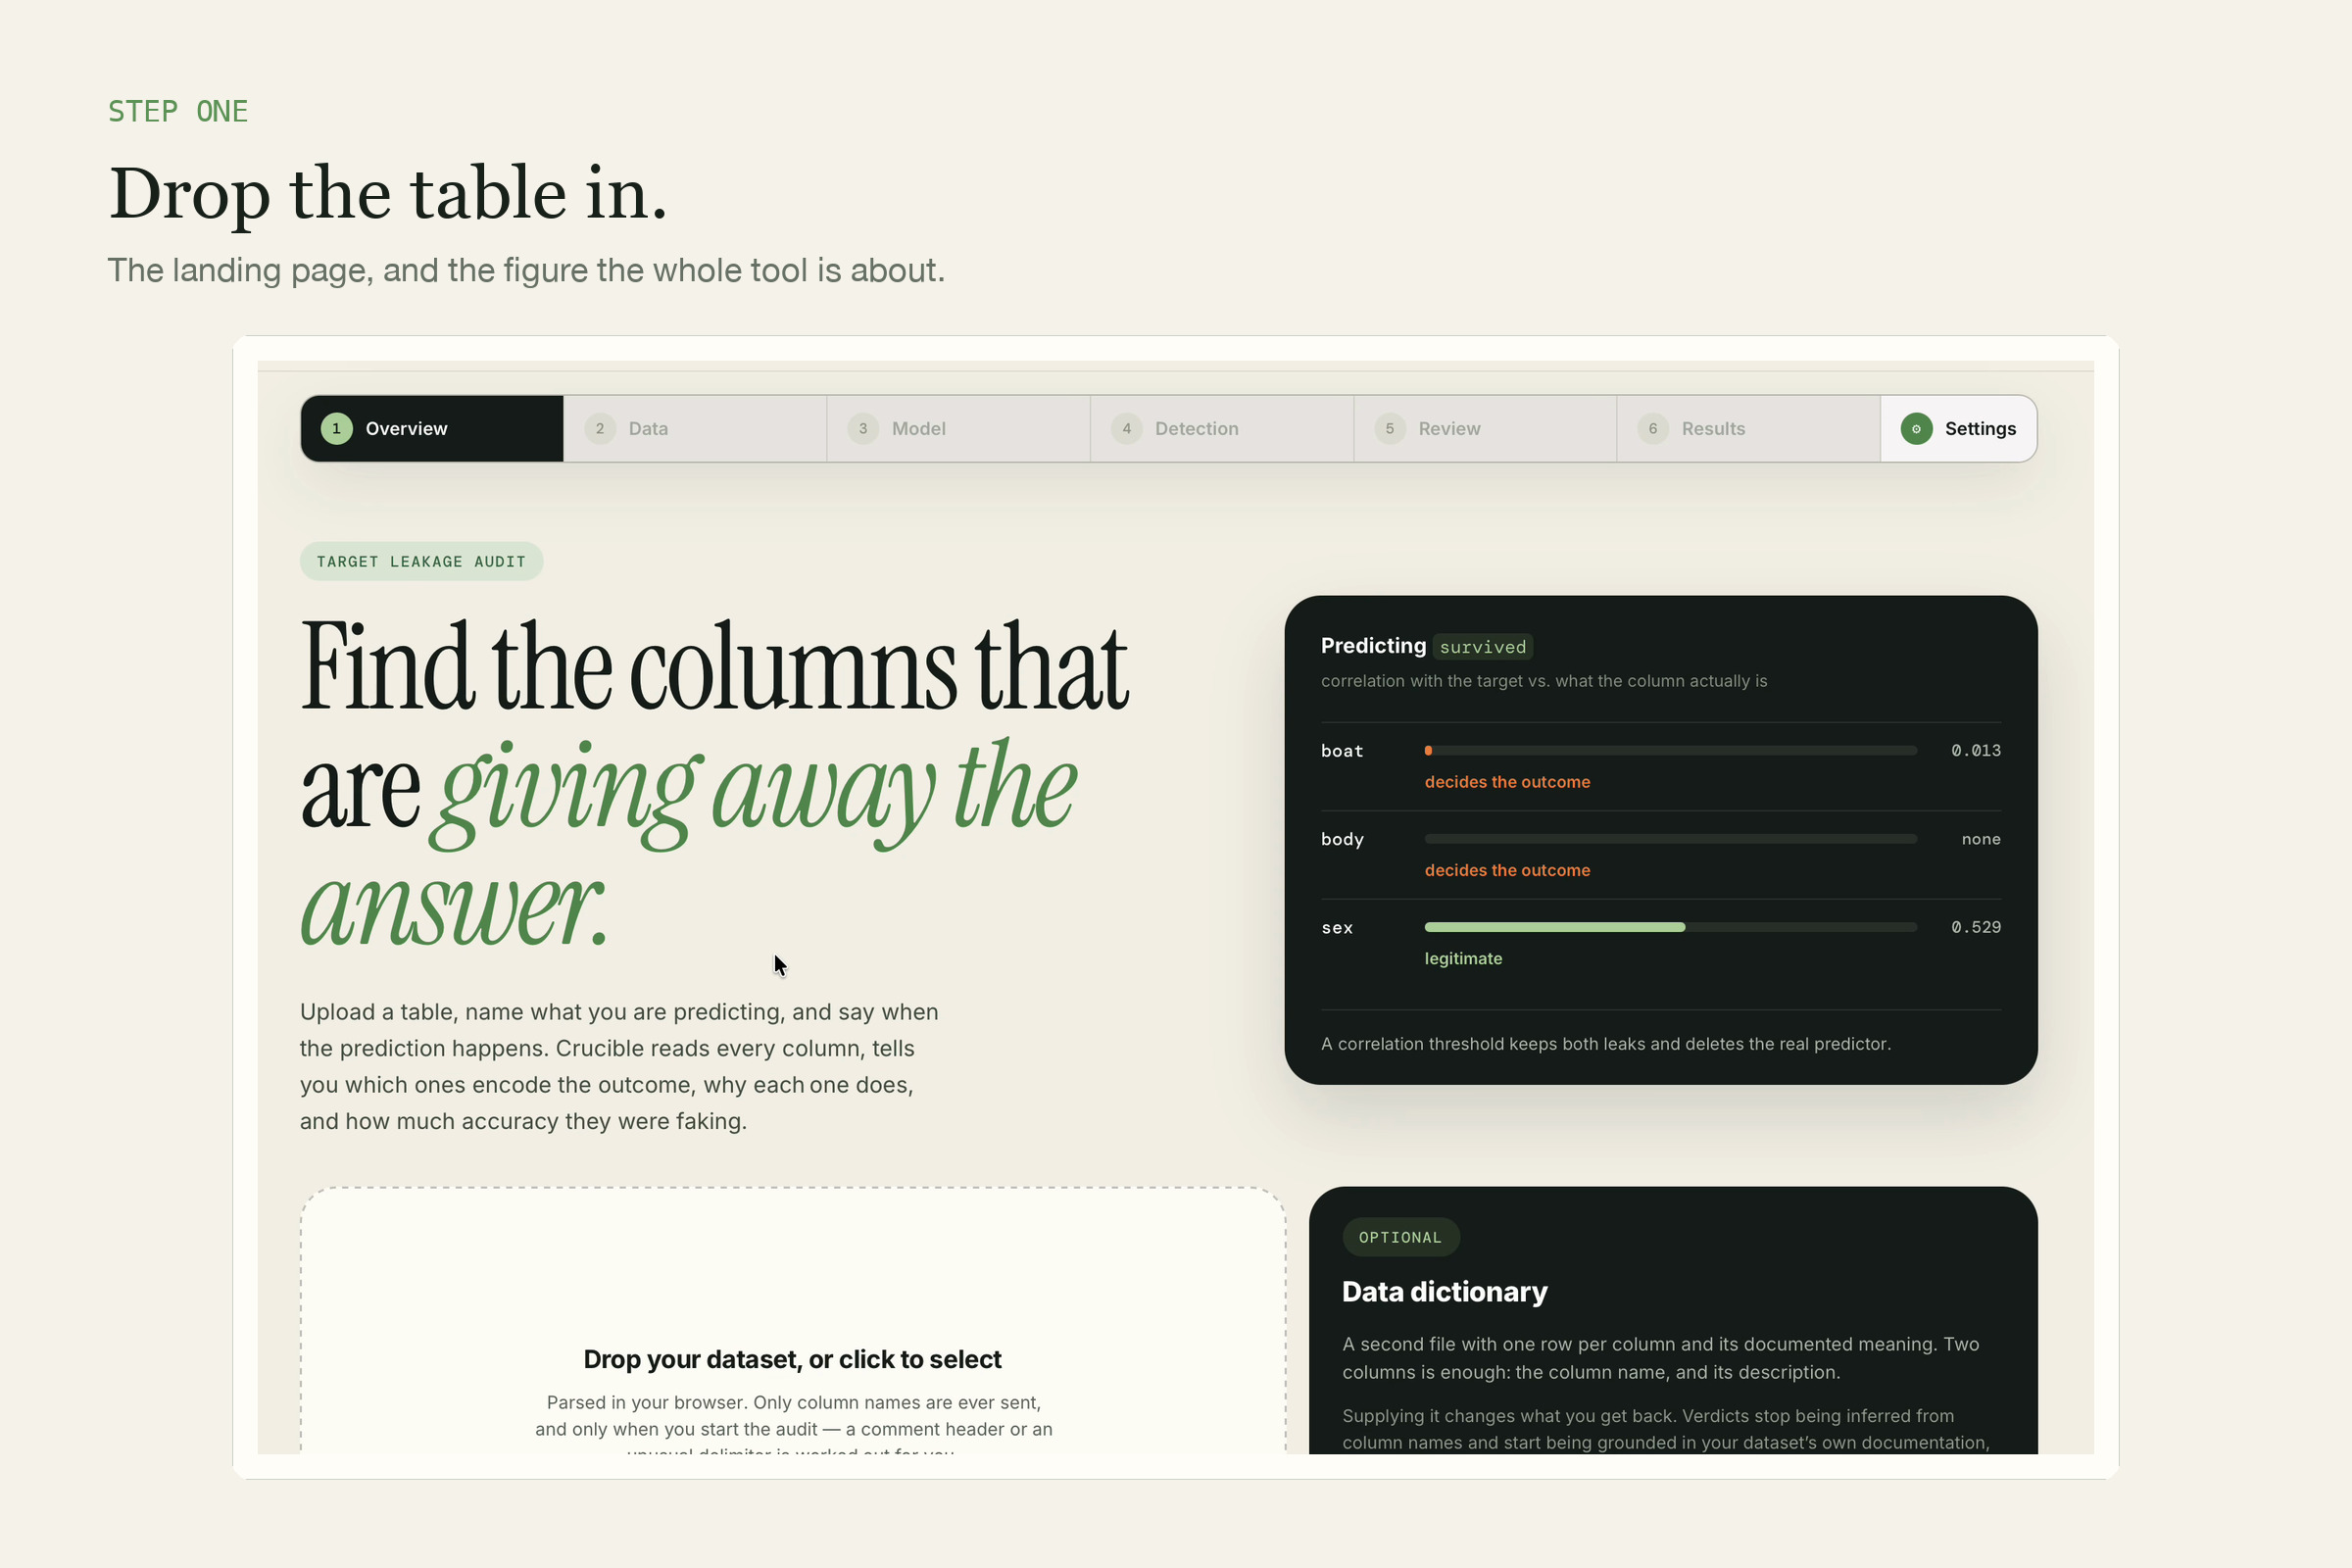
The lifeboat number correlates -0.013 and is a total cheat. Sex correlates -0.529 and is fair.
-
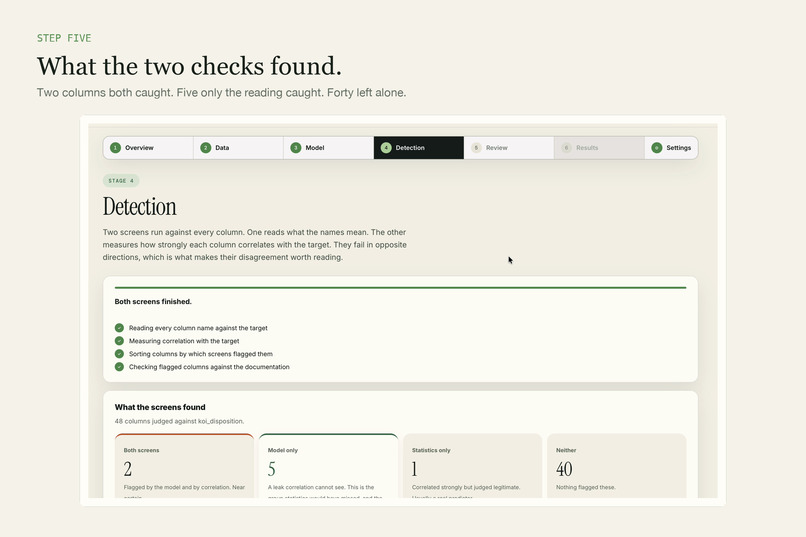
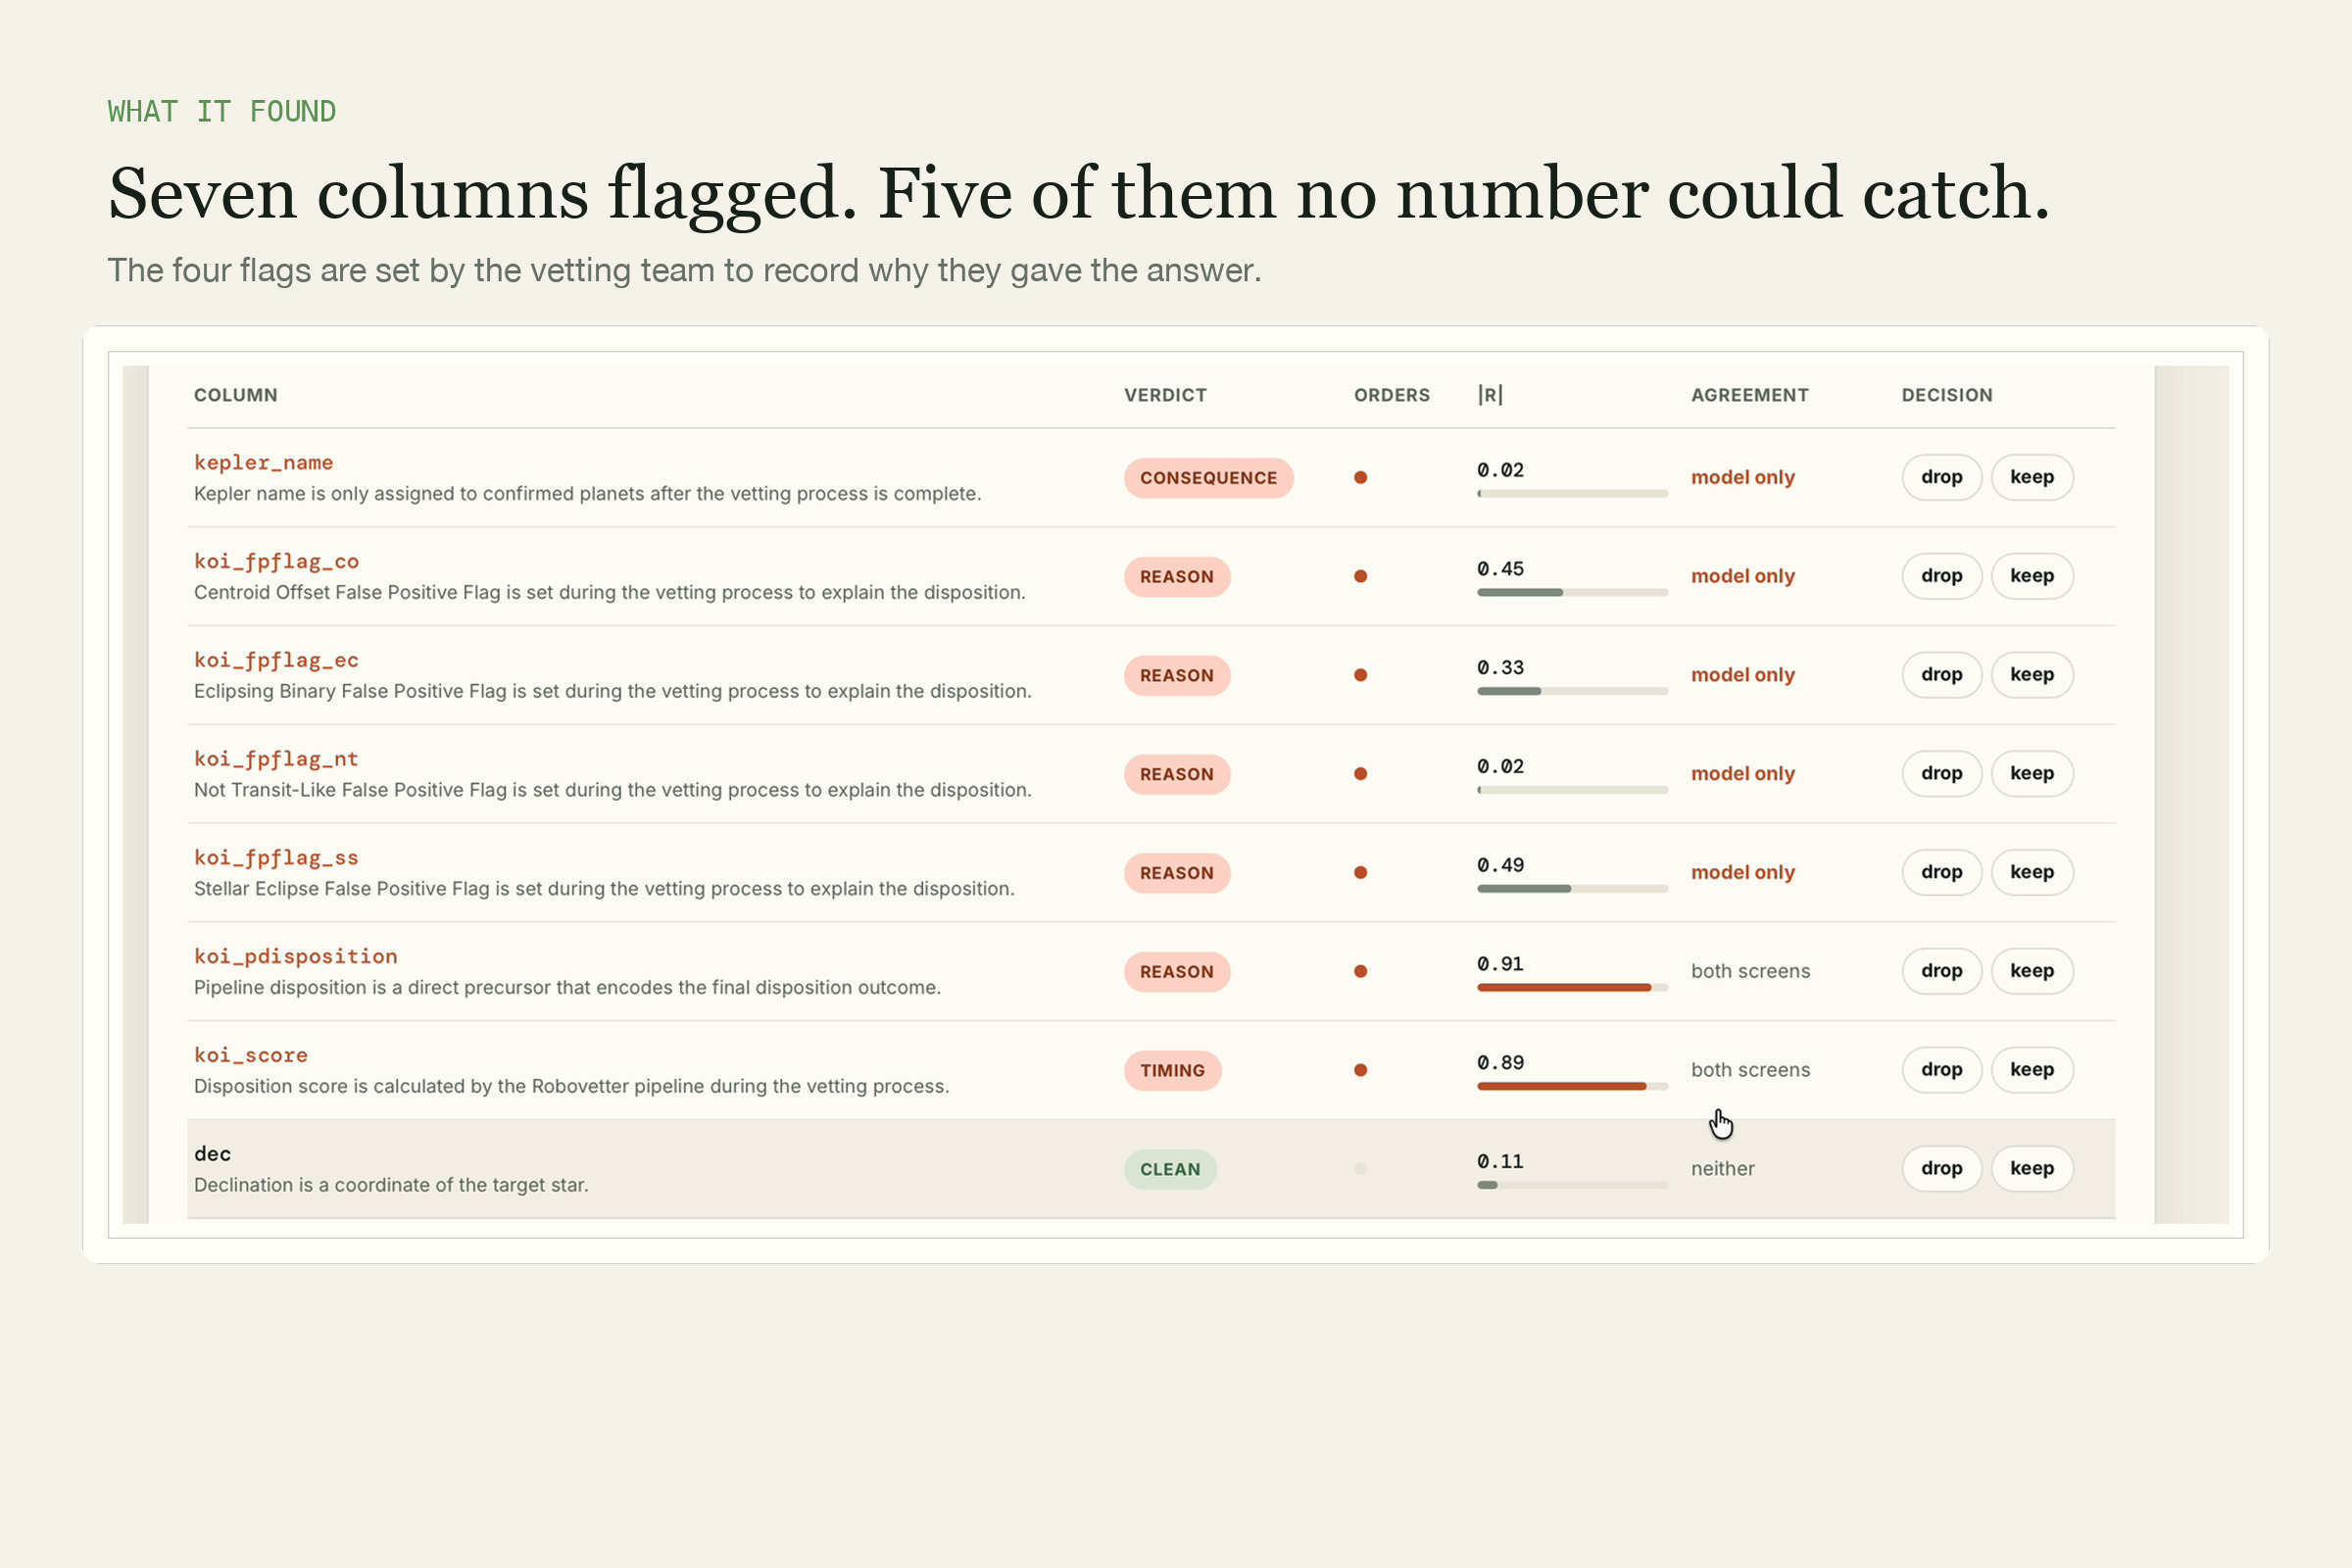
Two columns caught by both screens, five by reading alone, one by numbers, forty left clean.
-
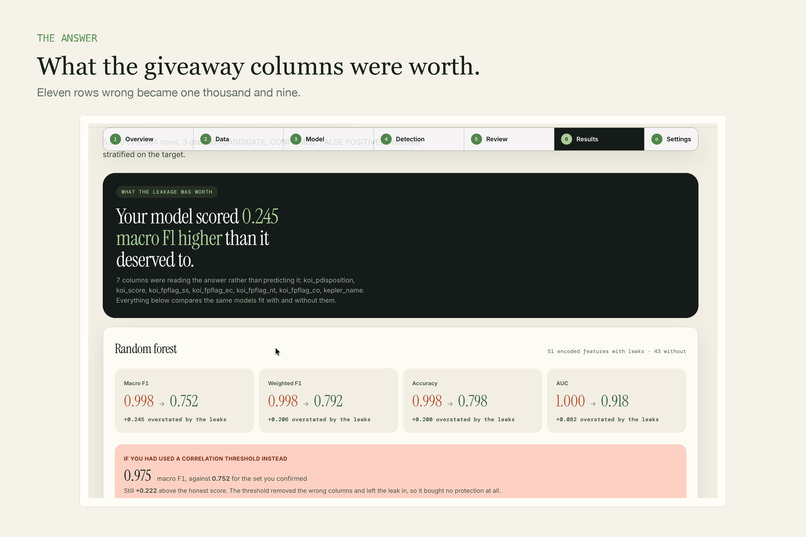
The verdict: 0.245 of inflation, and a correlation filter that bought no protection at all.
-
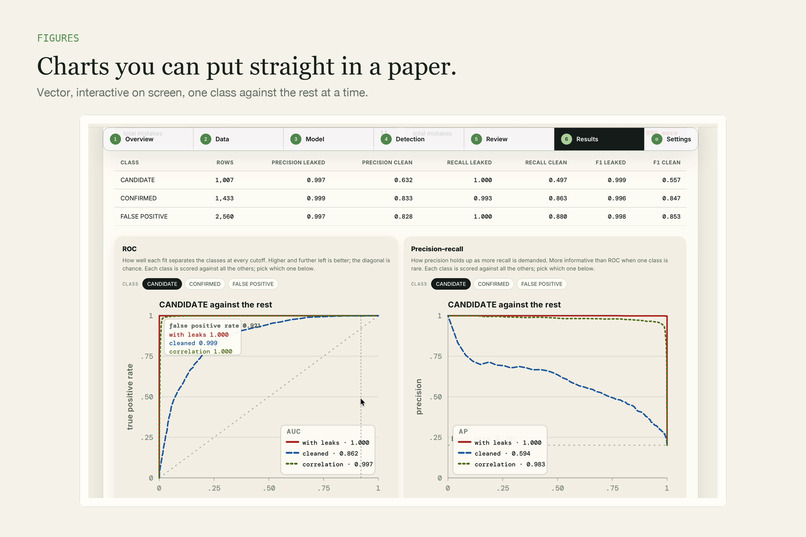
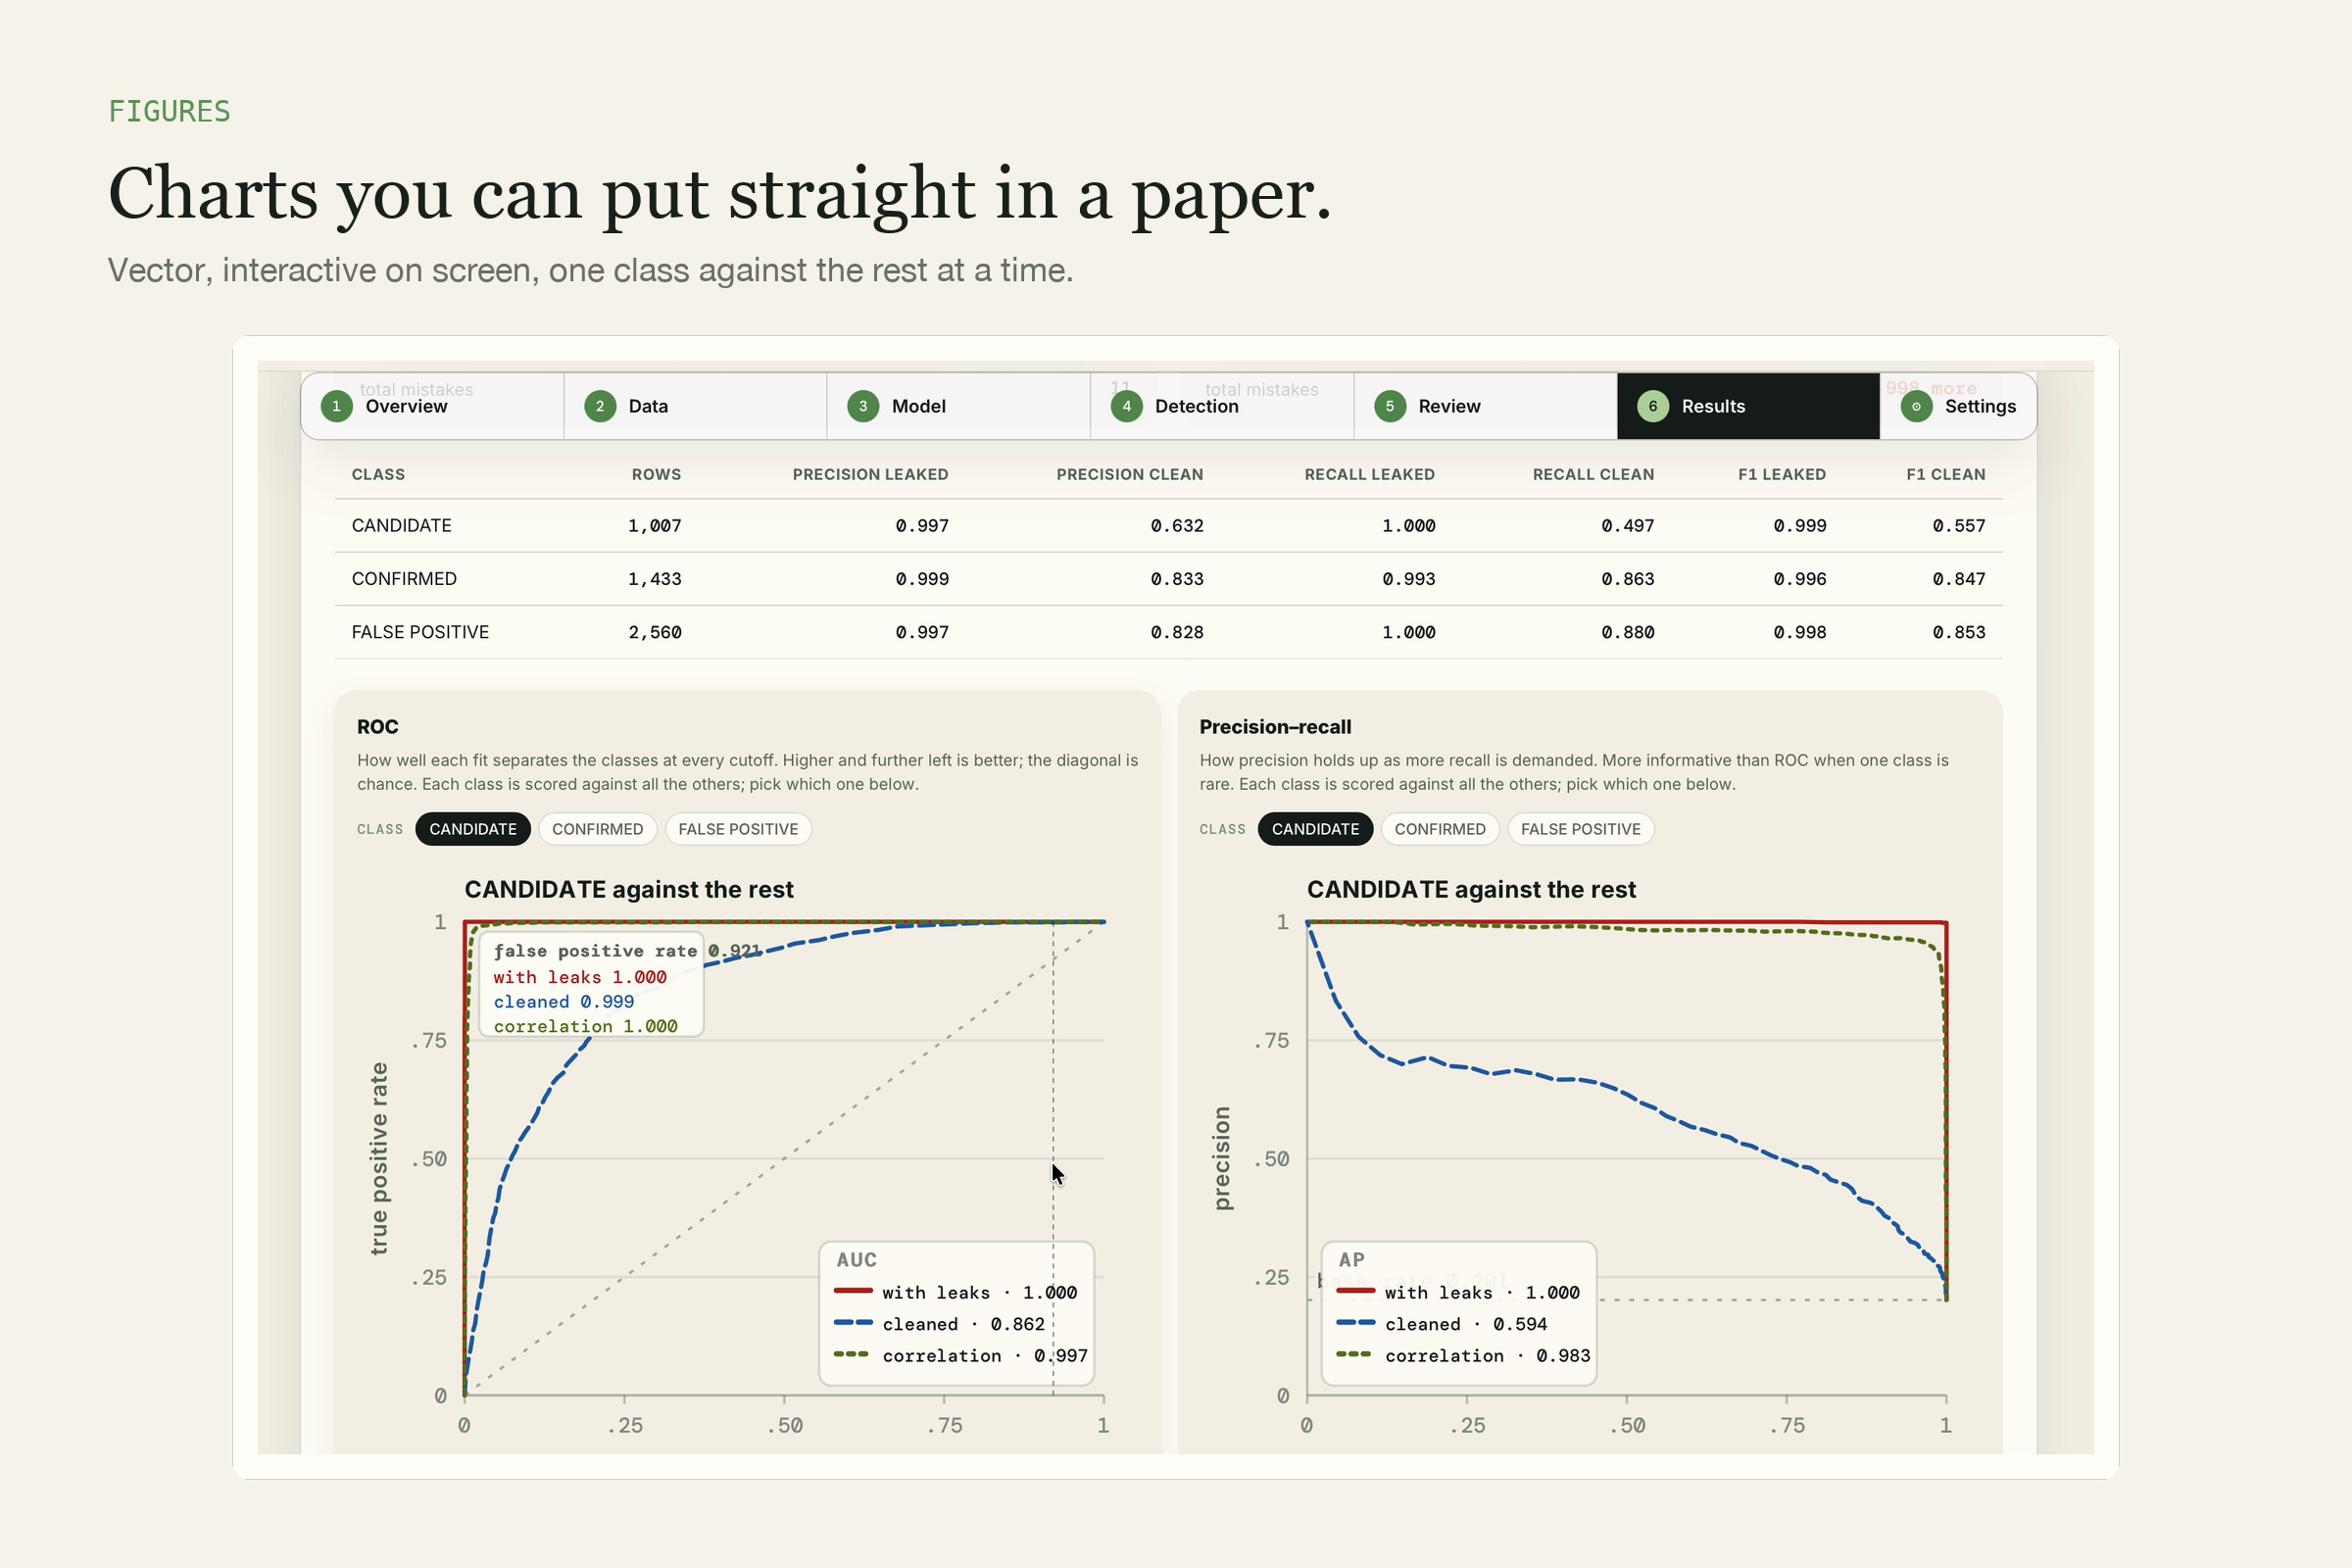
Publication figures, one class against the rest at a time, downloadable as vector files.
-
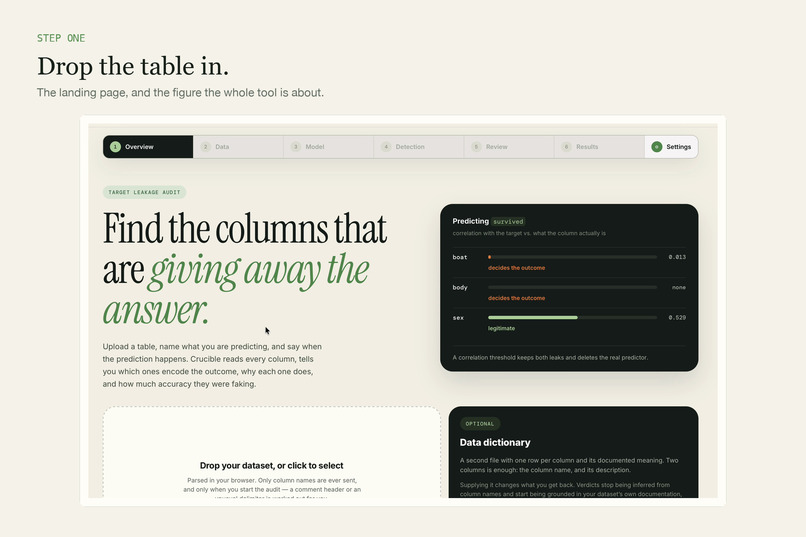
Drop a CSV in. The landing page opens on the columns the whole tool exists to find.
-
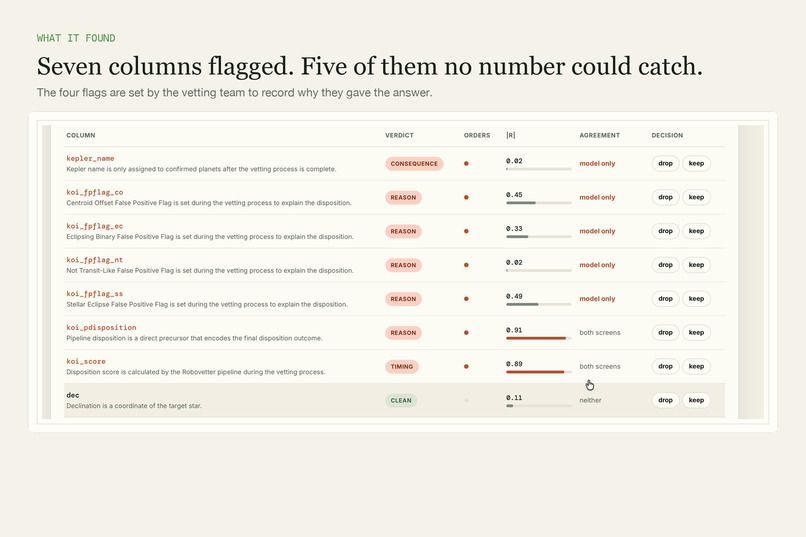
Seven columns flagged on NASA's Kepler table. Five sit under the 0.5 line no filter catches.
-
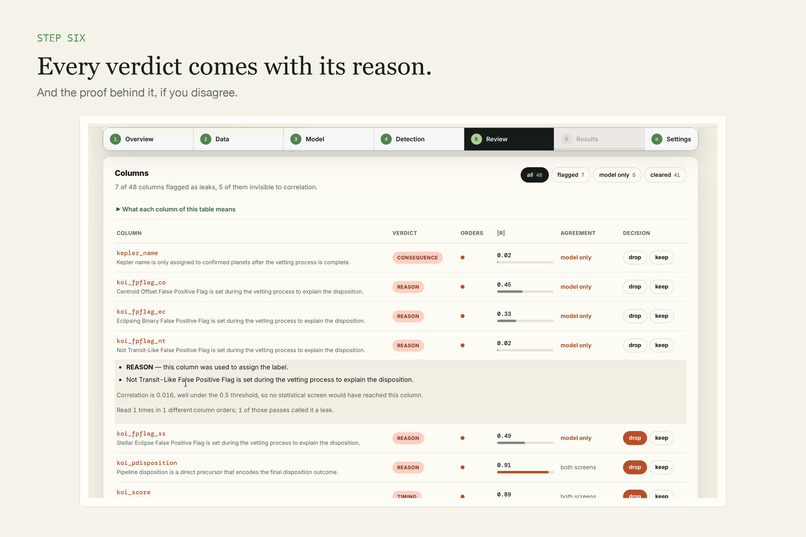
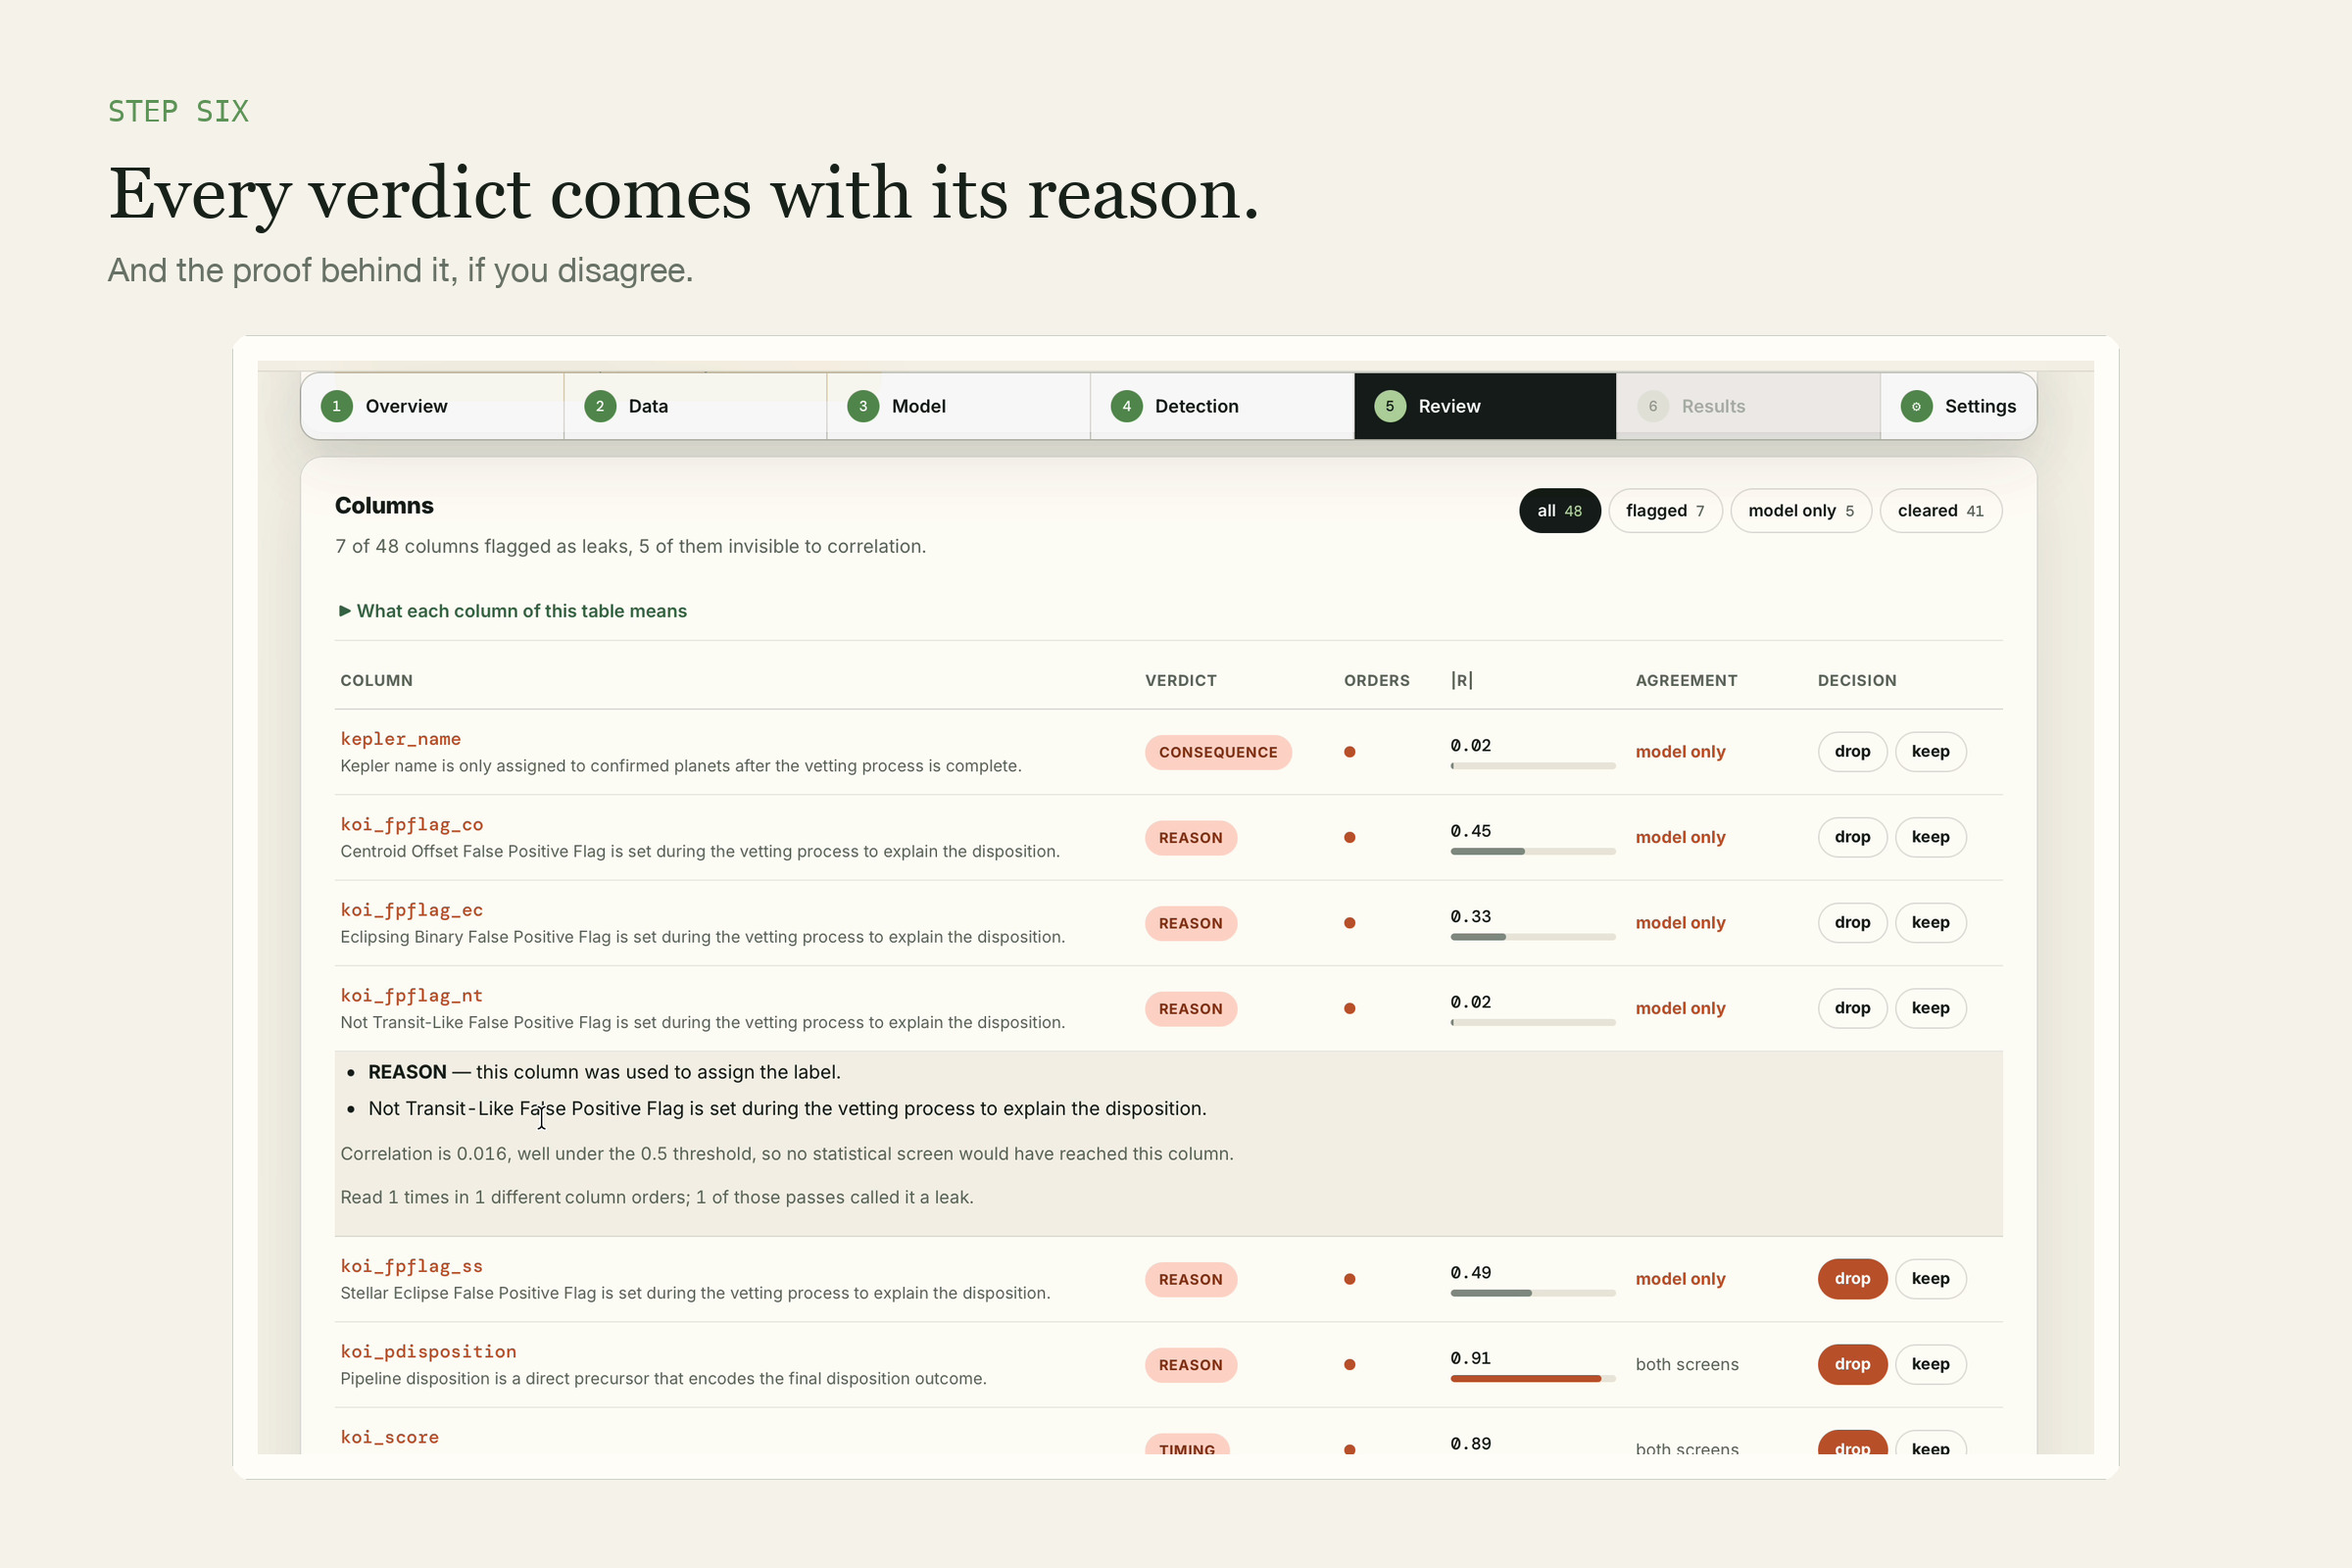
Each verdict carries its mechanism, its reason, and the evidence if you want to argue back.
-
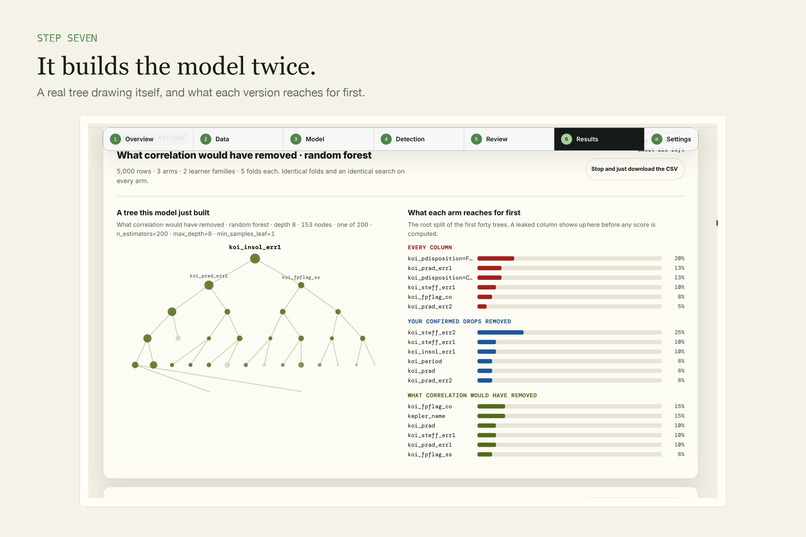
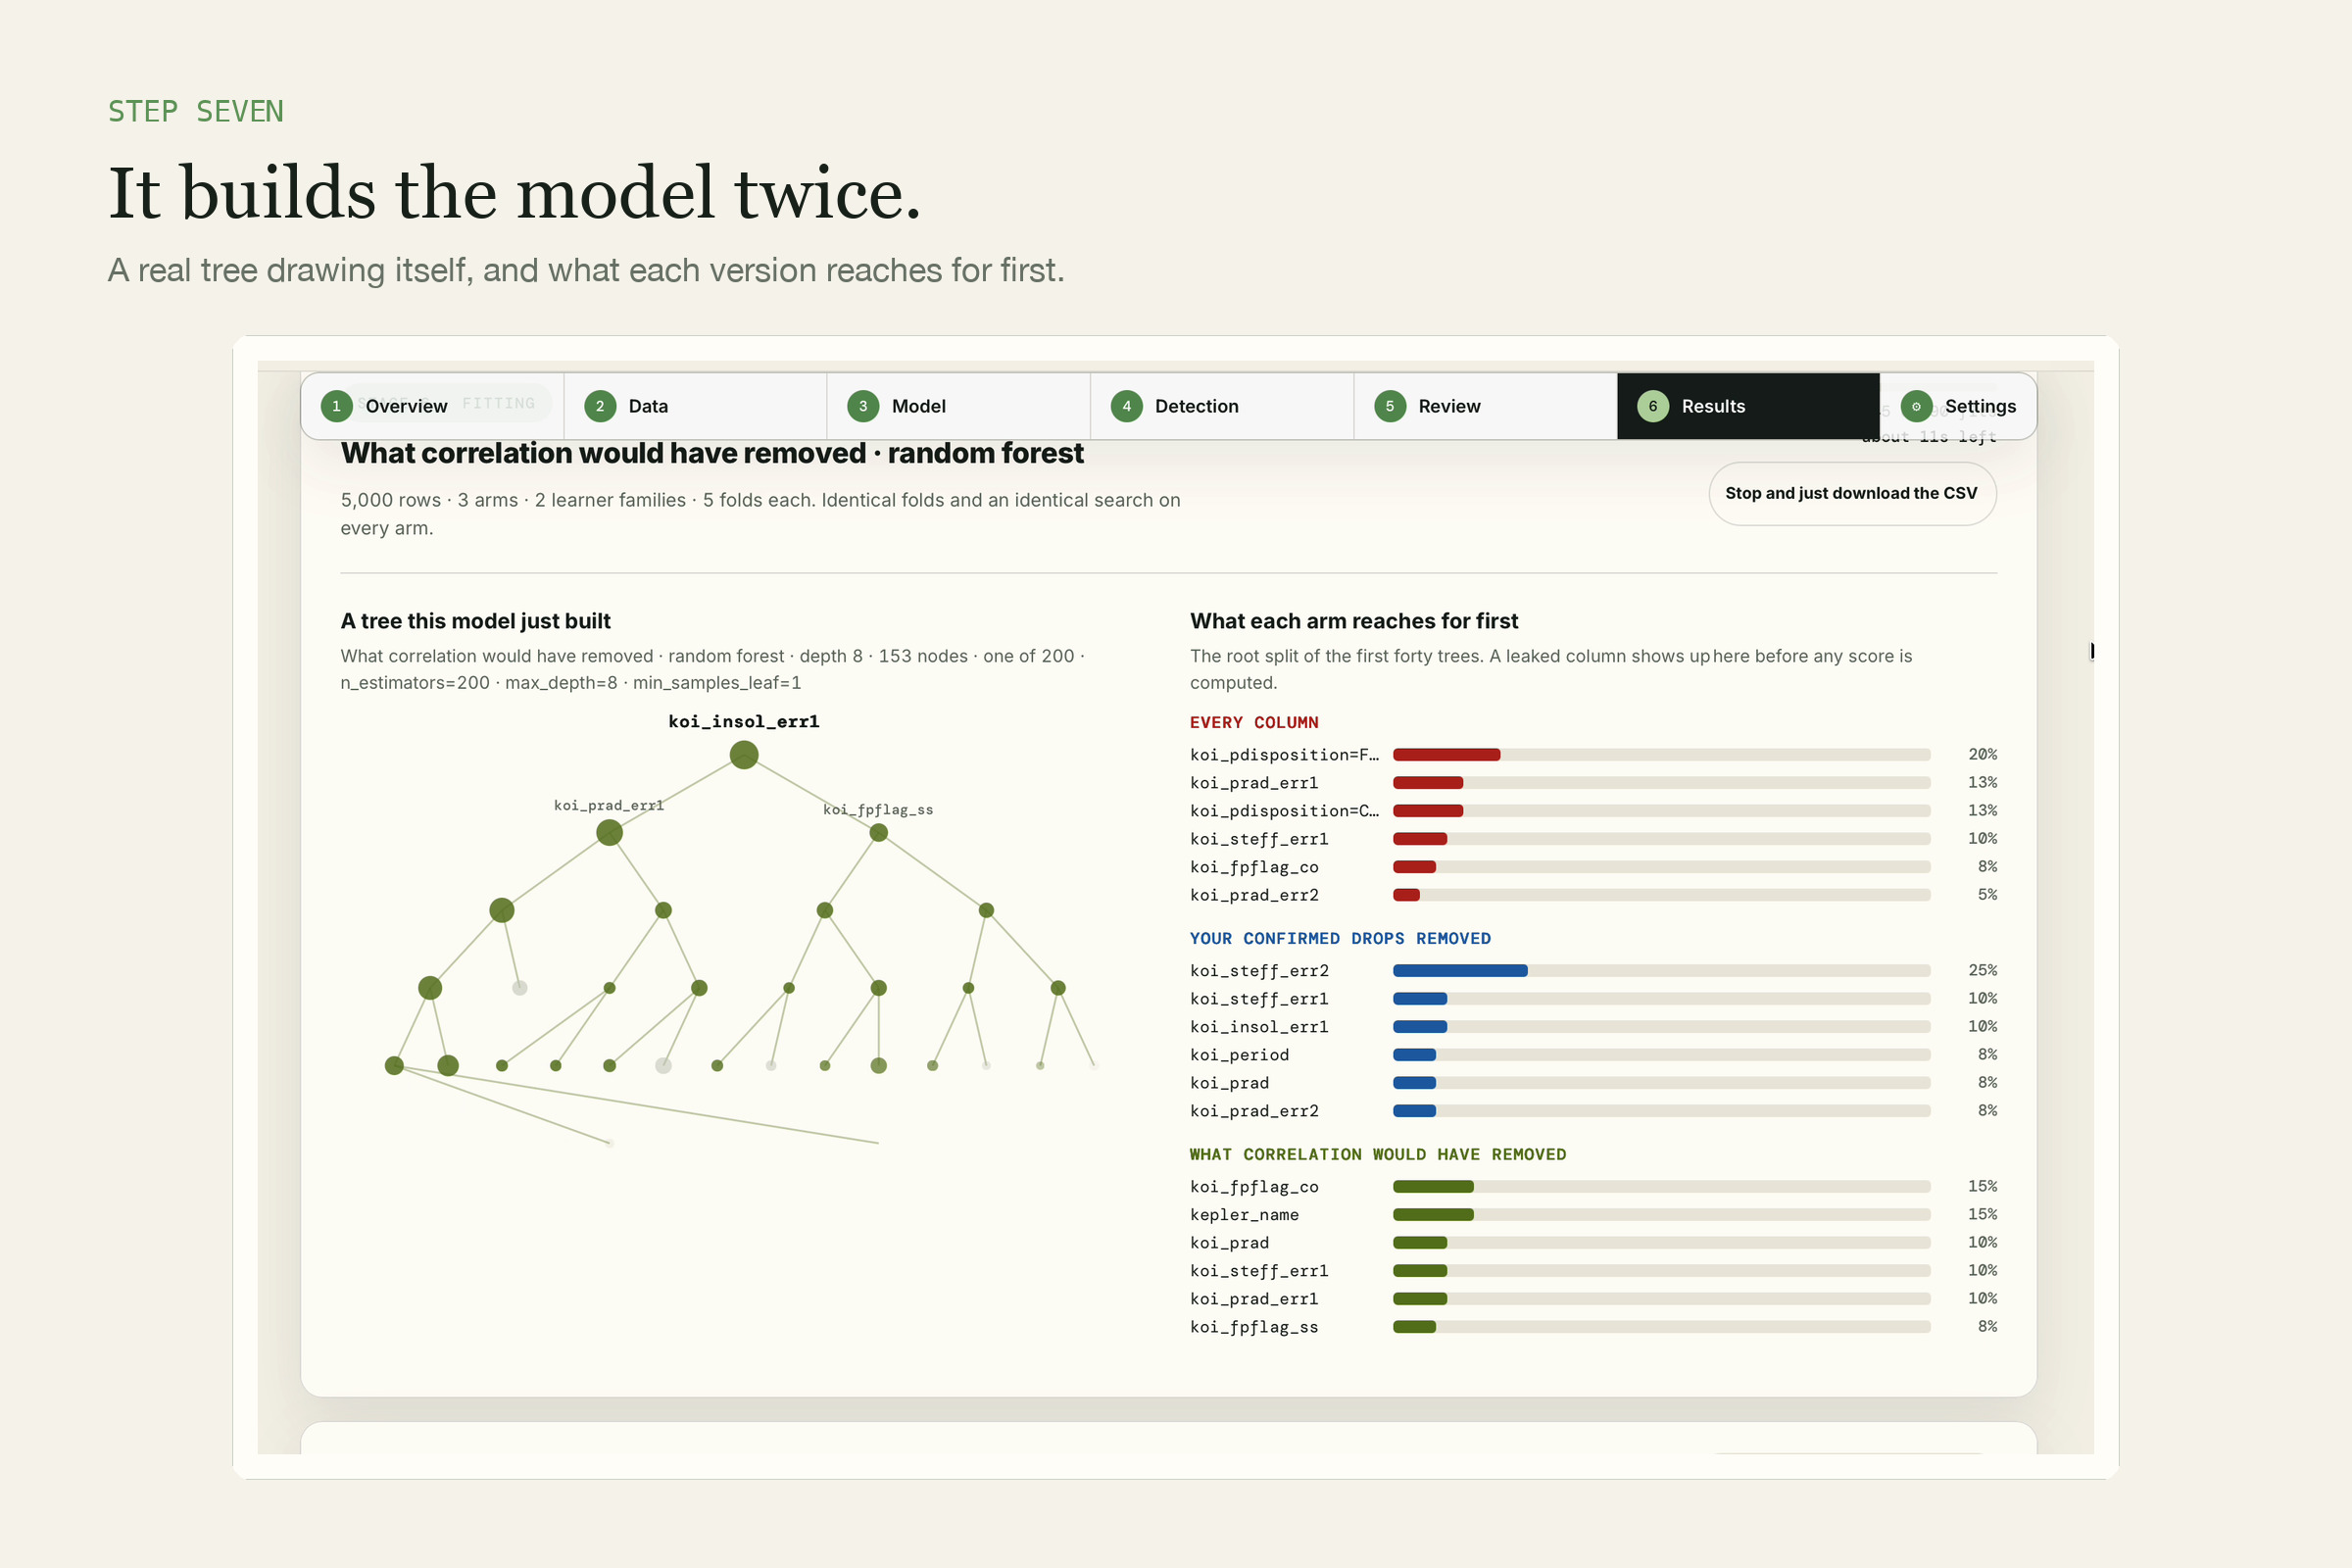
A real tree drawing itself, and what each version of the model reaches for first.
-
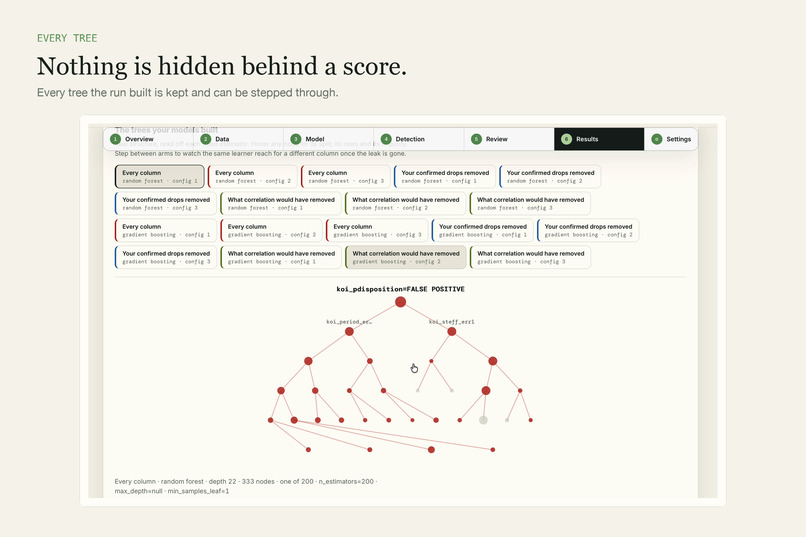
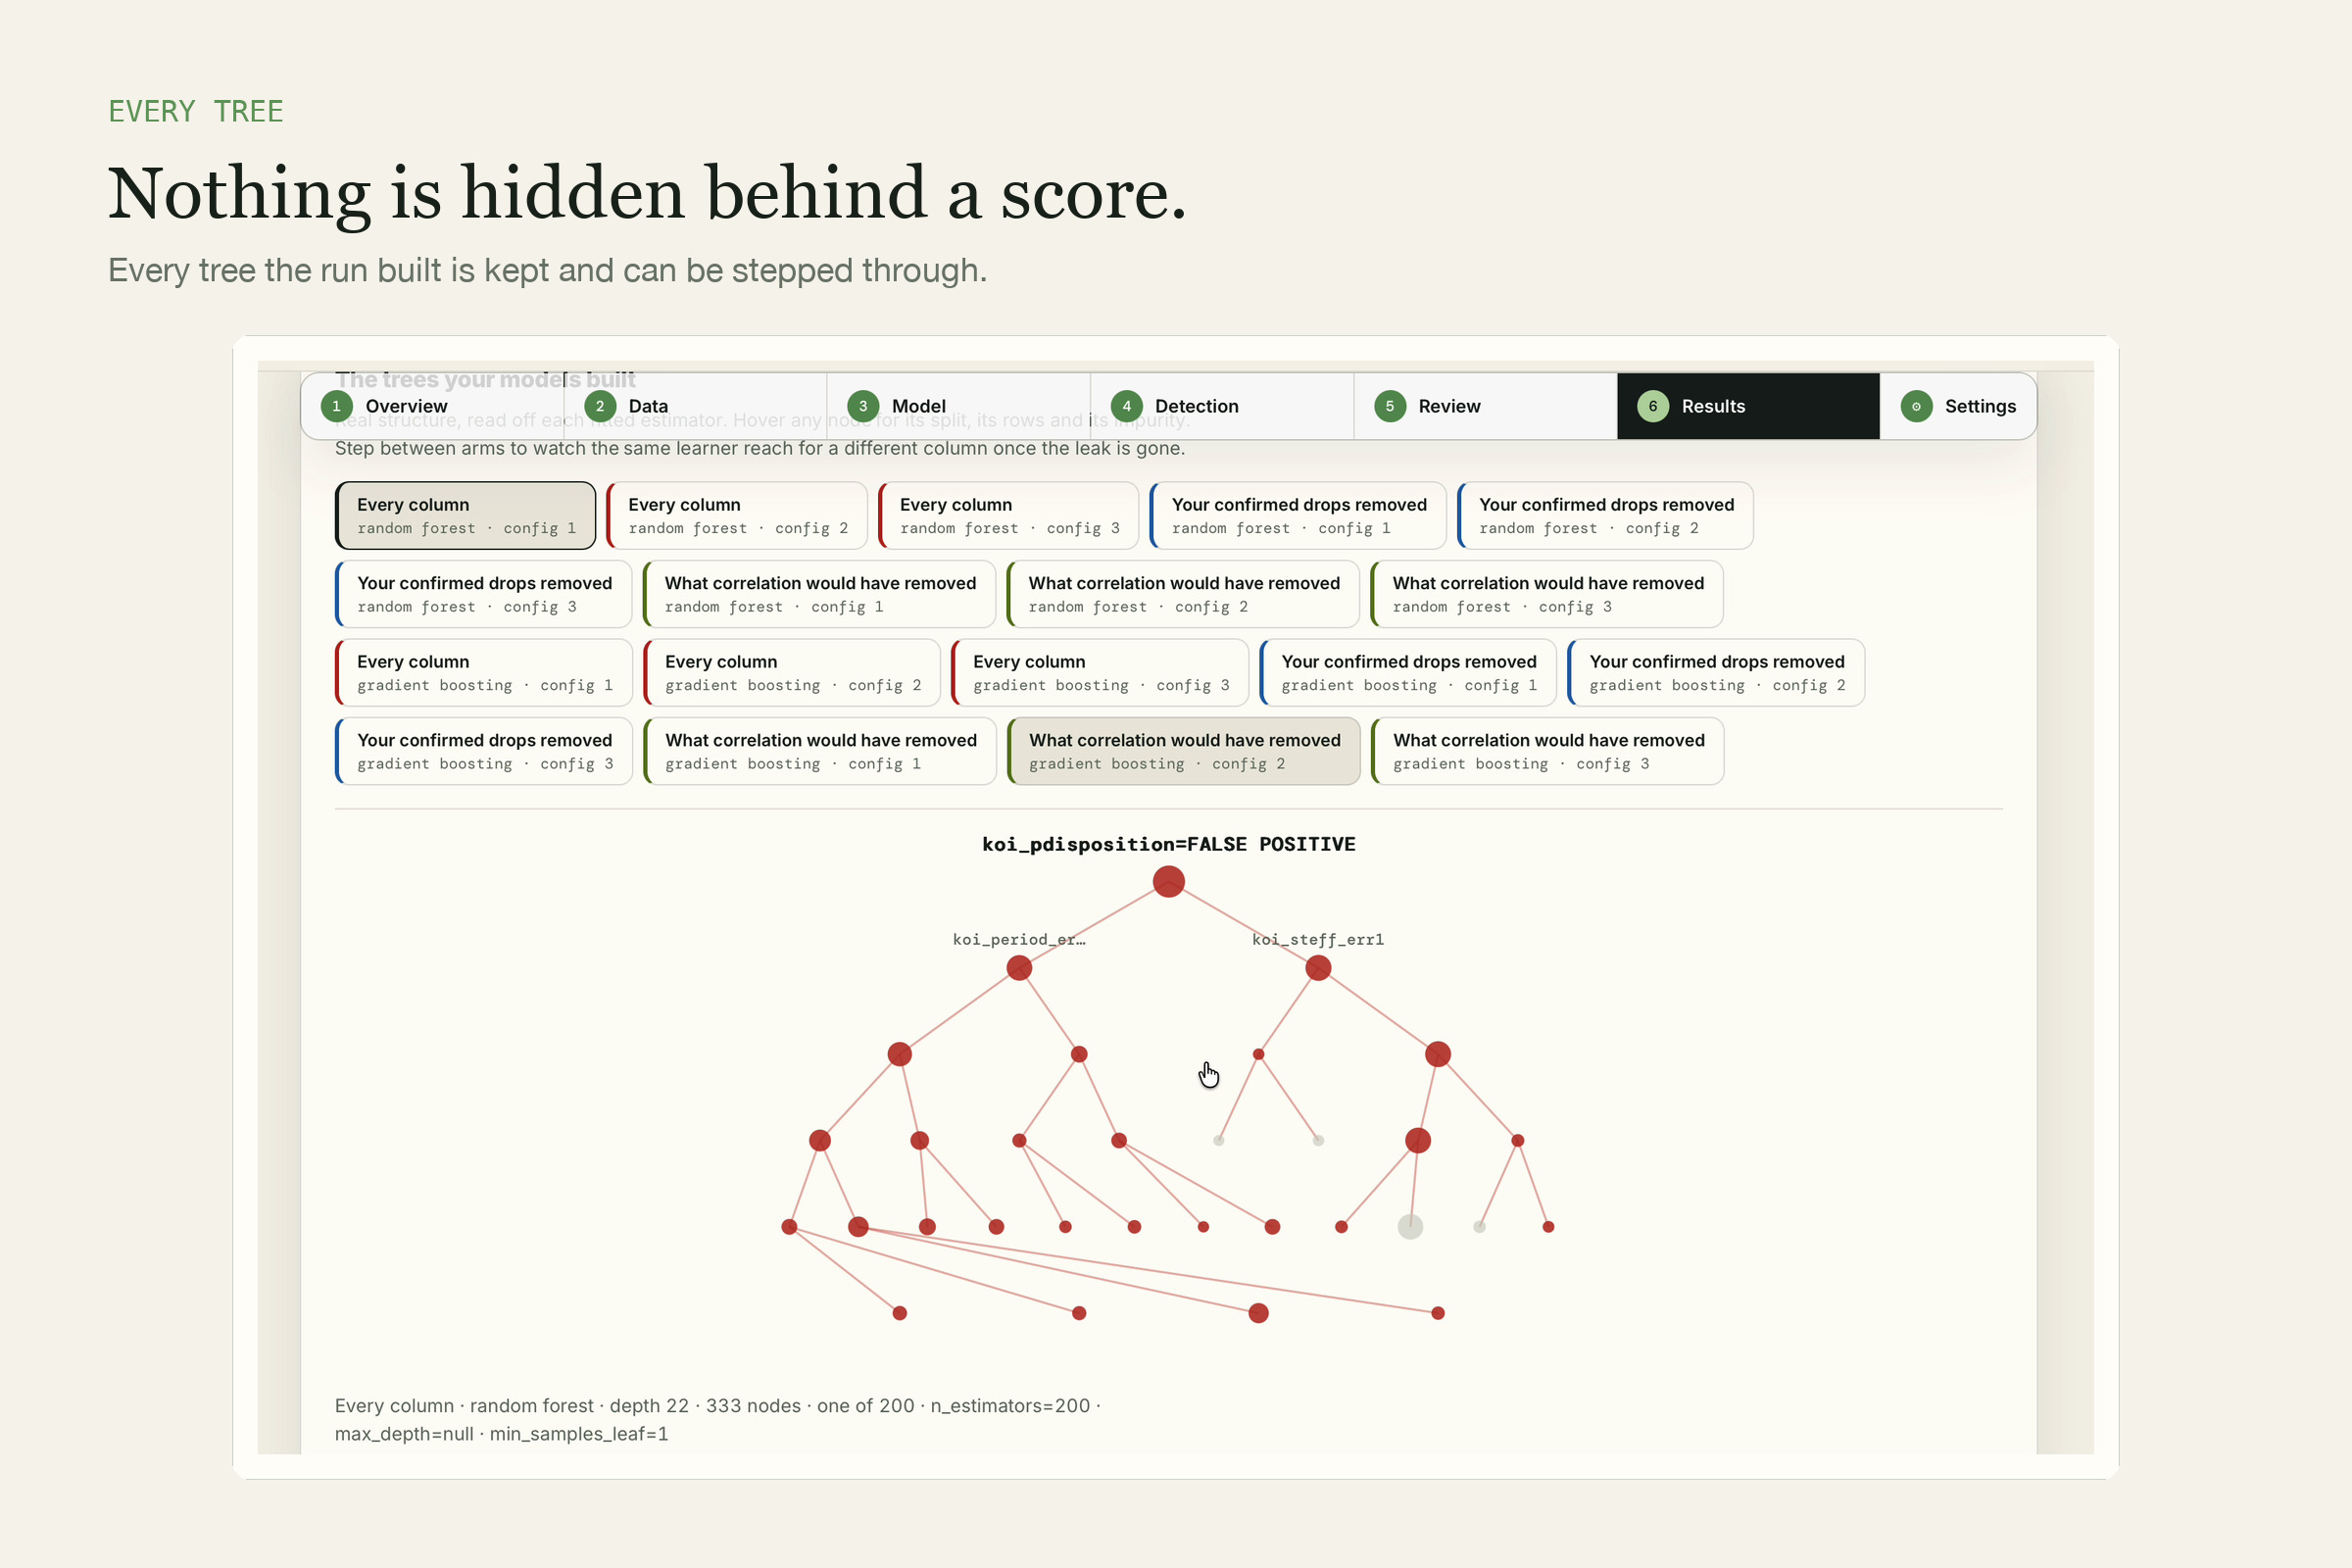
Every tree the run built is kept, so nothing hides behind a single summary number.
Crucible
A tool that finds the columns in a dataset that are quietly giving away the answer, before a model gets built on them and published.
The problem
Here is a model I built on NASA's Kepler catalogue, predicting whether an observed object is a real planet. Ordinary code. Correct split, five folds, every row scored by a model that never saw it. Out of five thousand objects it got eleven wrong.
That model is worthless, and nothing in the code says so.
Four of the columns are called koi_fpflag_nt, koi_fpflag_ss, koi_fpflag_co
and koi_fpflag_ec. They are flags the vetting team sets while deciding whether
an object is a planet, and they exist to record why the team decided it. Not
transit like. Stellar eclipse. Centroid offset. Eclipsing binary.
A flag that says "this looks like an eclipsing binary and not a planet" is not a measurement of the star. It is a note explaining the answer, written at the same moment as the answer. My model was not predicting anything. It was reading those four notes and handing the answer back.
This is not a niche accident. Two researchers went looking for it across published work and reported what they found.
"we find 17 fields where leakage has been found, collectively affecting 294 papers and, in some cases, leading to wildly overoptimistic conclusions"
Sayash Kapoor and Arvind Narayanan, Leakage and the Reproducibility Crisis in Machine-Learning-Based Science, Patterns 4(9), 100804 (2023). doi:10.1016/j.patter.2023.100804
The problem has a name and a definition, and it has had both since 2011.
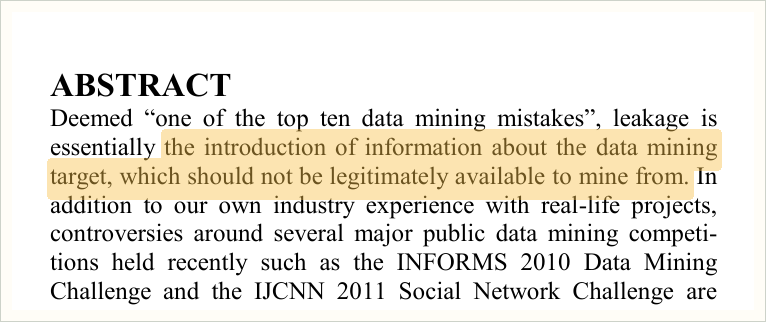
Shachar Kaufman, Saharon Rosset, Claudia Perlich and Ori Stitelman, Leakage in Data Mining: Formulation, Detection, and Avoidance. KDD 2011, 556 to 563. Extended in ACM Transactions on Knowledge Discovery from Data 6(4), Article 15 (2012). doi:10.1145/2382577.2382579
The same paper gives the test, and the test is short enough to remember. A column is fair only if its value could have been known before the thing being predicted happened.
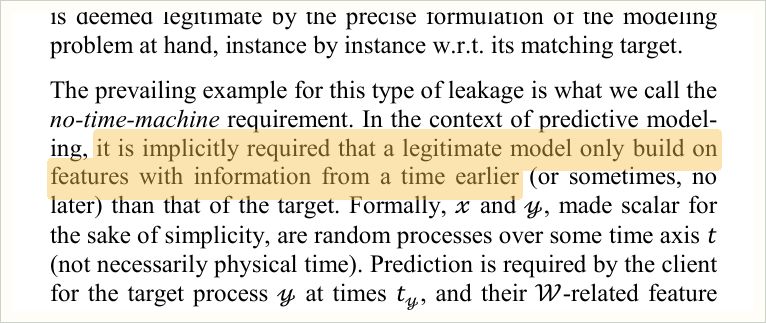
The authors call it the no time machine requirement, and it is a question about three moments: when a column's value gets fixed, when you make the prediction, and when the outcome is settled. A column is fair only if the first comes before the second. Applying that takes someone who knows what each column actually is, and by the time a dataset reaches you, that person is usually gone.
Why the obvious check does not work
The obvious check is to look for columns that correlate suspiciously well with the target, pick a cutoff, and delete everything above it. Half is the usual choice.
Try that on the Titanic passenger list. There is a column called boat, the
lifeboat number a passenger was rescued in. It only has a value if they
survived, so it gives the answer away completely, and its correlation with
survival is minus 0.013. There is body, the body recovery number, which has no
computable correlation at all. And there is sex, which correlates at minus
0.529 and is entirely legitimate, because you know it the moment someone boards.
A correlation filter ranks all three of those backwards. Set the cutoff low enough to catch the two cheats and it deletes the honest column first.
That is not a thought experiment. Crucible runs that filter as a control arm on
every measurement, and on Titanic the filtered model scores higher than doing
nothing at all, because it dropped sex and kept both cheats. It would have
reported success.
Back on the Kepler table, the same thing happens with less drama and more consequence. Here is what the tool returned, with each column's correlation sitting next to the verdict.
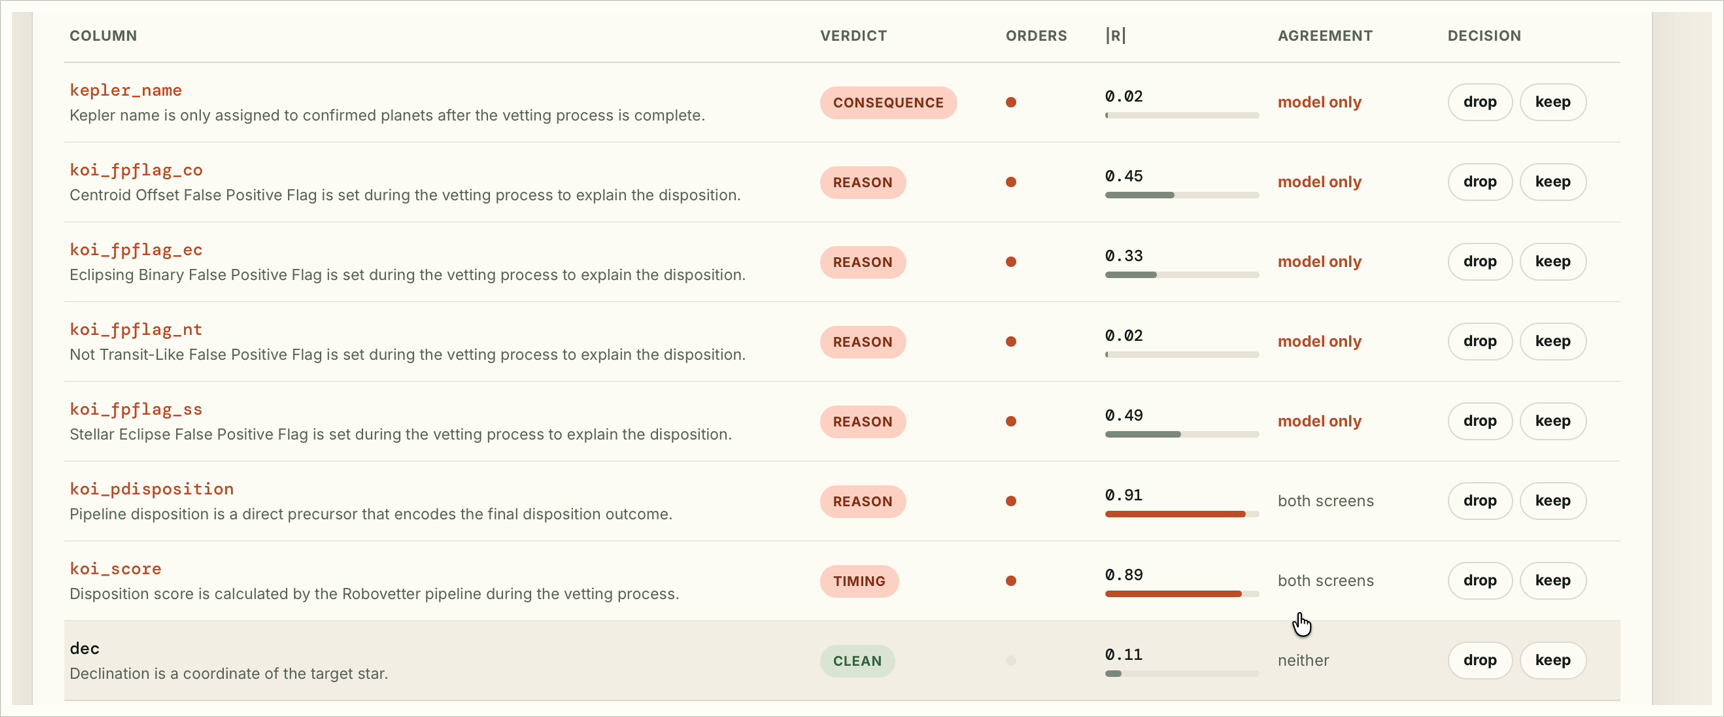
Look at the second-to-last column. Seven columns were flagged. Two of them were caught by both screens, and five by the reading alone.
The two the statistics caught are koi_pdisposition at 0.91 and koi_score at
0.89. Those are the easy ones. They are numeric summaries of the vetting outcome,
and they track the answer closely enough that any threshold finds them.
The four flags sit at 0.45, 0.33, 0.02 and 0.49. Every one of them falls below
the 0.5 line, and koi_fpflag_ss misses it by a hundredth. There is no cutoff
that catches those four and leaves the real measurements alone: dec and kepid
in the same table sit at 0.11, and plenty of legitimate astronomy sits higher
than 0.49.
So the four columns that gave the answer away most directly are exactly the four that nothing numerical would have found. They are integers. They were split correctly and scaled correctly. The only thing wrong with them is what they mean, and the only way to reach that is to read the name and the documentation.
What already exists, and what it does not cover
There are good tools for leakage already. The closest is LeakageDetector, a PyCharm plugin that reads machine learning code and finds three specific faults.
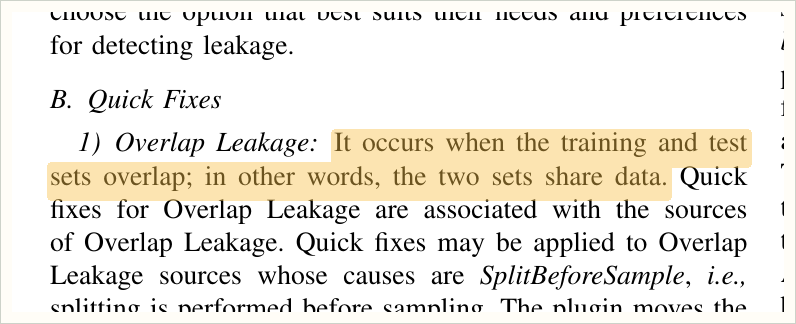
Drake, Pham, Rahman and colleagues, LeakageDetector: An Open Source Data Leakage Analysis Tool in Machine Learning Pipelines. arXiv:2503.14723
Training on the test data. Cleaning the data before splitting it. Reusing a test set. All three are real, all three are common, and all three are mistakes in the code, which is why a code analyser can find them.
None of them is the Kepler problem. My split was correct. My folds were correct. Nothing touched the test set. The fault was in four columns, and no amount of reading the source will tell you what a column means.
Crucible works one layer down, on the data rather than on the pipeline. If you are being careful you want both, and they do not overlap.
How it works
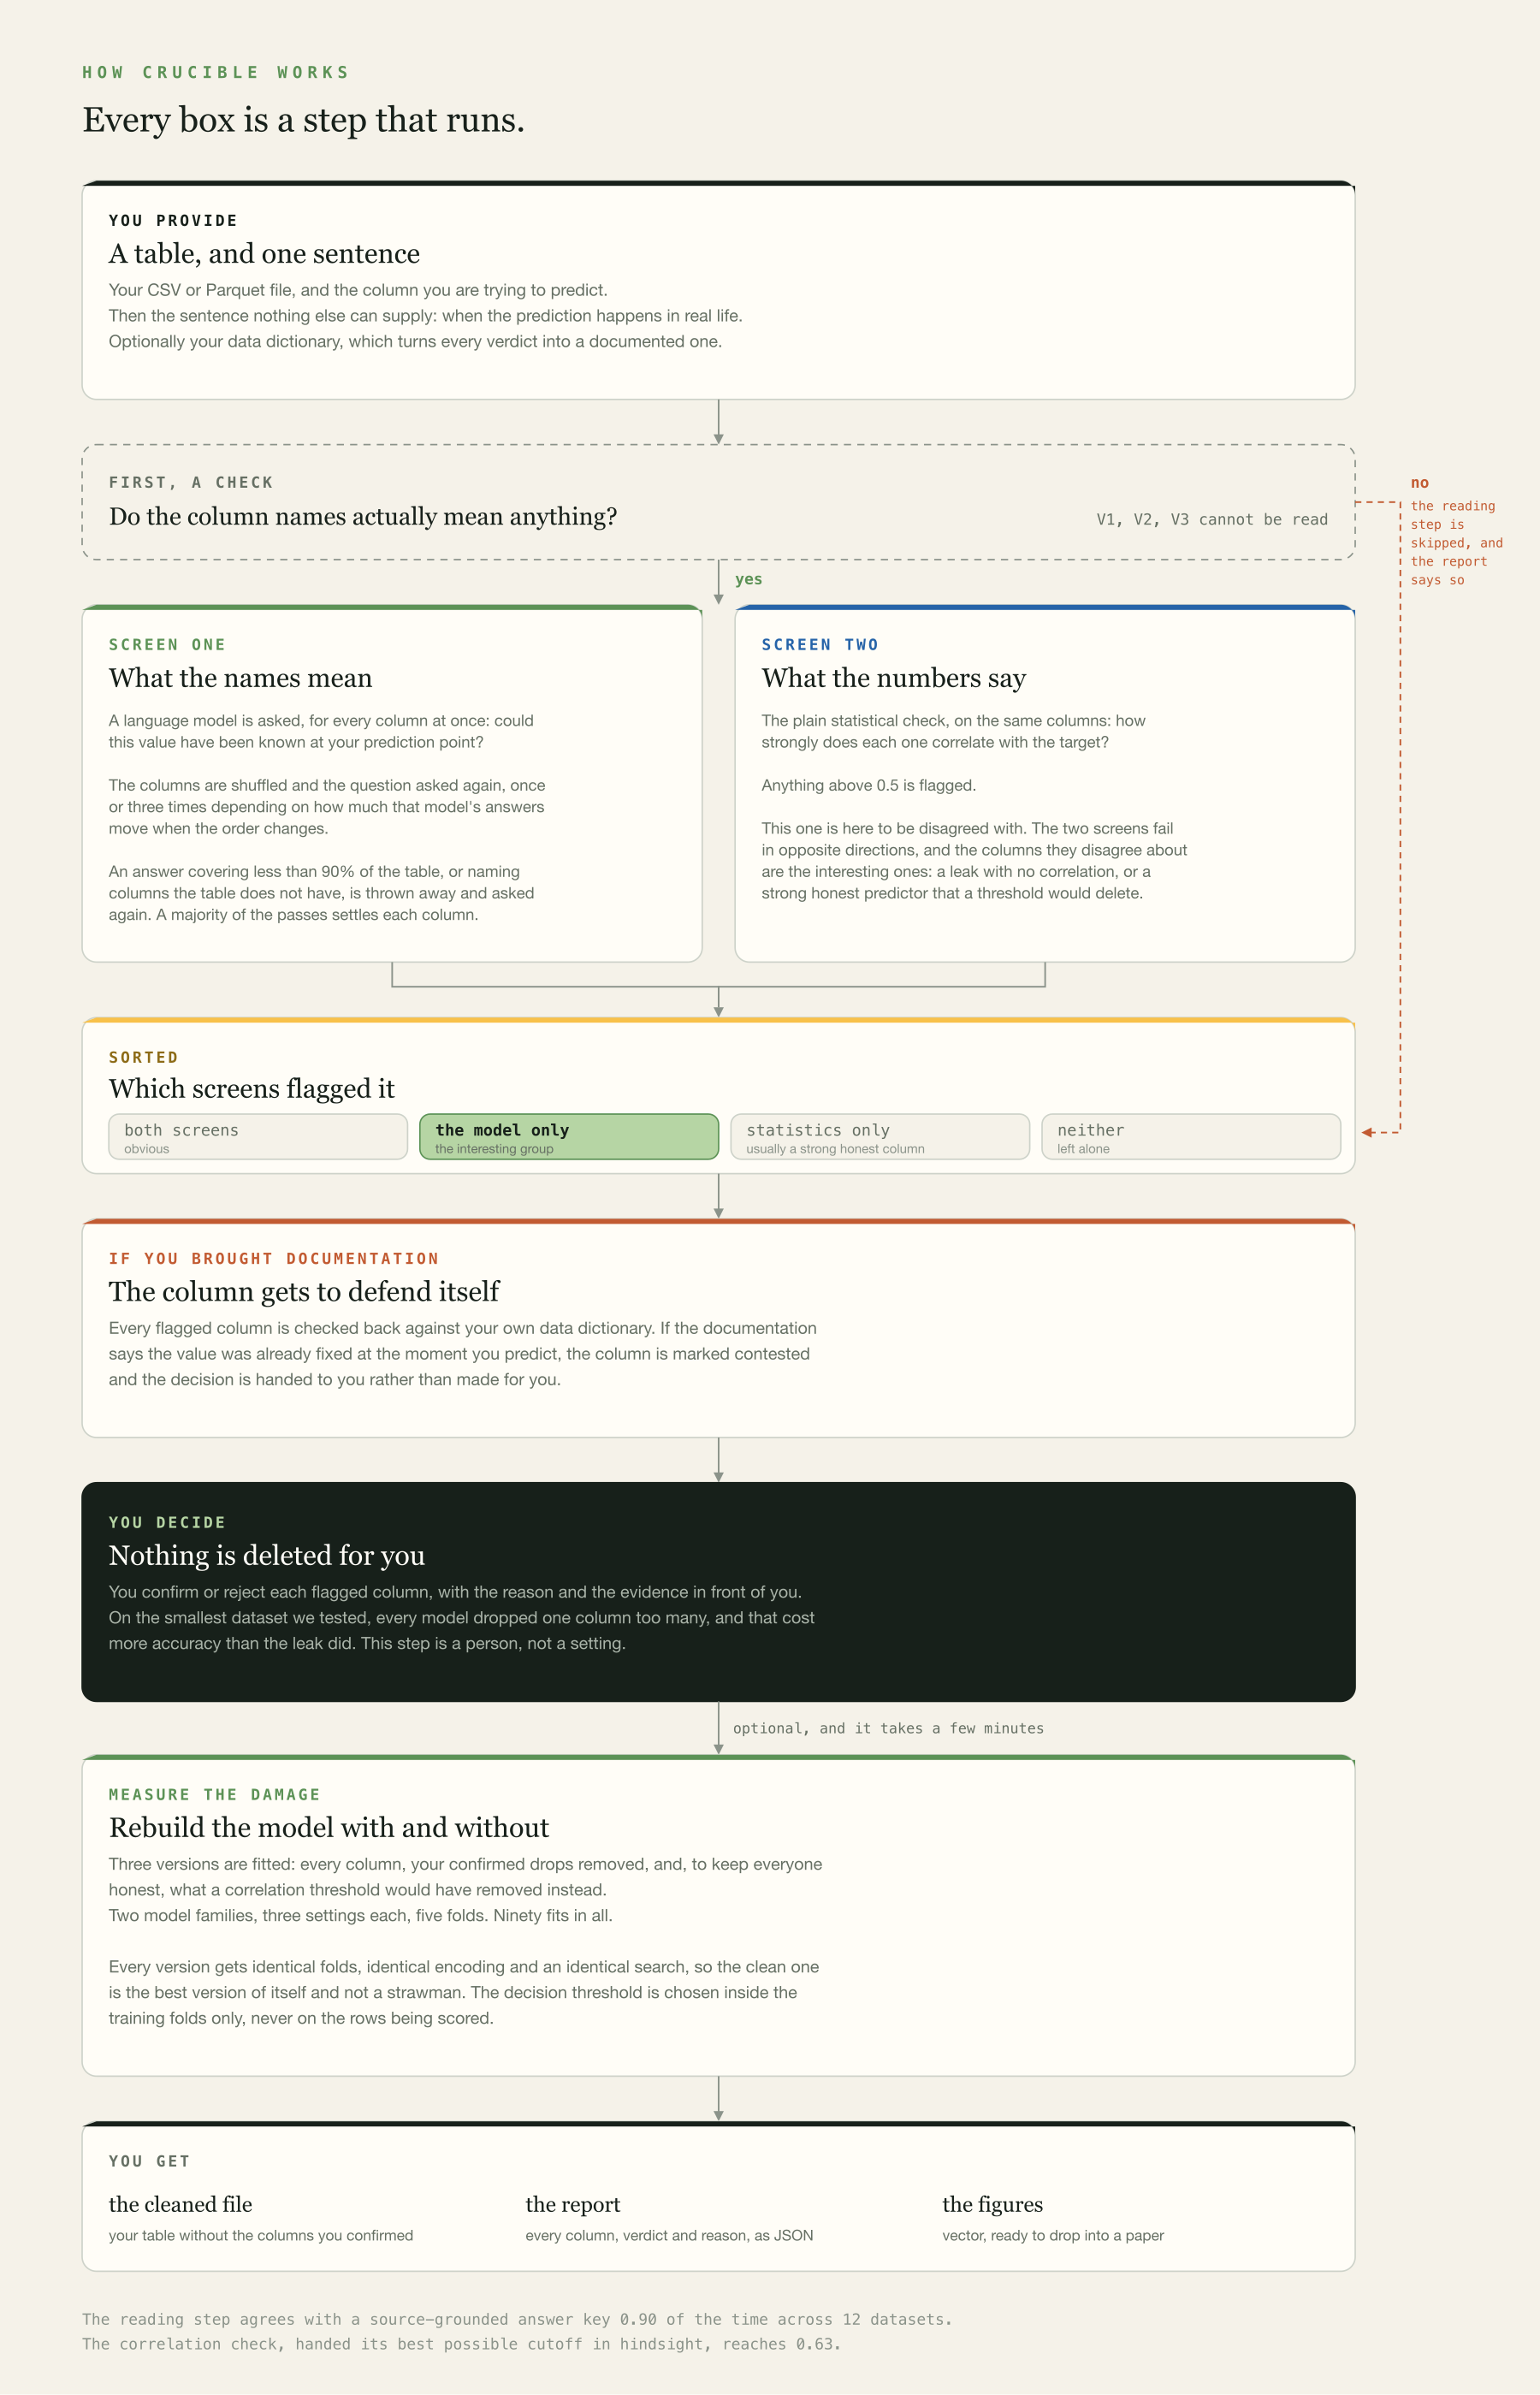
You give it a table, the column being predicted, and one sentence saying when the prediction would happen in real life. That sentence is the only thing the tool cannot work out for itself, because it is a fact about how the model gets used and not about the data.
Two screens then run over every column. One is a language model reading the column names against the prediction point, asked the same question in several different column orders and made to answer for the whole table before its answer counts. The other is the plain correlation check. Both are reported, and they are meant to disagree: the columns one flags and the other misses are the ones worth attention.
If a data dictionary was supplied, every flagged column is then checked back against that documentation. When the documentation says the value was already settled at the moment of prediction, the column is marked as contested and the decision goes to the person running it.
Then it stops and waits. Crucible does not delete anything.
To find out what the flagged columns were actually worth, it rebuilds the model twice, once with them and once without, and reports the gap. Both sides get identical folds, identical encoding and an identical search, so the clean version is the best version of itself rather than a strawman. On the Kepler table that gap was eleven mistakes against one thousand and nine.
Who this is for
Anyone who trains a model on a table they did not collect themselves.
That is most of computational science. You download a public dataset, or inherit one from a collaborator, or pull an export from a clinical system. It arrives with forty or ninety columns, some documented, most named by somebody who has left. There is a deadline. The model gets fitted and it works well.
Researchers about to submit. The screen takes about a minute on a table of fifty columns, which is a cheap thing to do before writing the results section and an expensive thing to skip. The report it produces is also a record of what was checked and why the kept columns were kept, which is the part a reviewer asks about.
Reviewers. Run it on the authors' data and get a list, column by column, of what looks unsafe and why, without needing to know the field.
Anyone doing a reproducibility study. That is exactly the work the Patterns paper describes, and it was done by reading datasets by hand.
How to use it
Three ways, and they all do the same thing.
In a browser, to watch what it is doing. Drop the file in, name the target, type the sentence, and both screens run in front of you.
From the command line, which is where it belongs in a pipeline:
crucible audit data.csv --target outcome --at "at admission, before any complication is recorded"
Or as a Python import, to get the verdicts inside your own script.
The output is the cleaned file, a report with every column and every verdict and the reason for it, and the figures as vector files that go straight into a paper.
Why it asks rather than deletes
Because deleting can cost more than the leak does.
The smallest dataset in the benchmark has 131 rows. On that one, every model I tested flagged one column too many, and the accuracy lost to that extra deletion was larger than the accuracy the leak had inflated. An automatic cleaner would have made things worse and reported that it had helped.
So Crucible flags, explains, and stops. The last word stays with the person, and on a small table that is not a courtesy. It is the difference between a better model and a worse one.
What I measured
The tool comes out of a benchmark built for this question: 604 columns across 15 datasets, where every label was traced back to the dataset's own documentation rather than to anybody's opinion.
Reading the column names agrees with that answer key nine times out of ten. The correlation check, handed the most favourable cutoff in hindsight, gets it right about two thirds of the time. Matching column names against a keyword list catches almost nothing.
On a typical table you are asked to look at fourteen percent of the columns, and doing so catches about ninety four percent of what is there.
Those are the numbers the tool quotes about itself, and every one of them names the section of the paper it comes from.


Log in or sign up for Devpost to join the conversation.