-
-
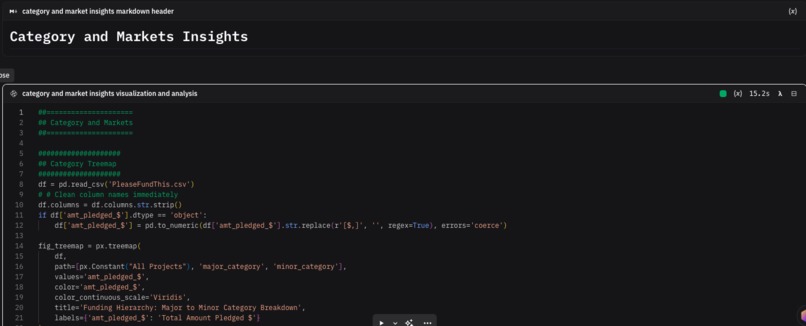
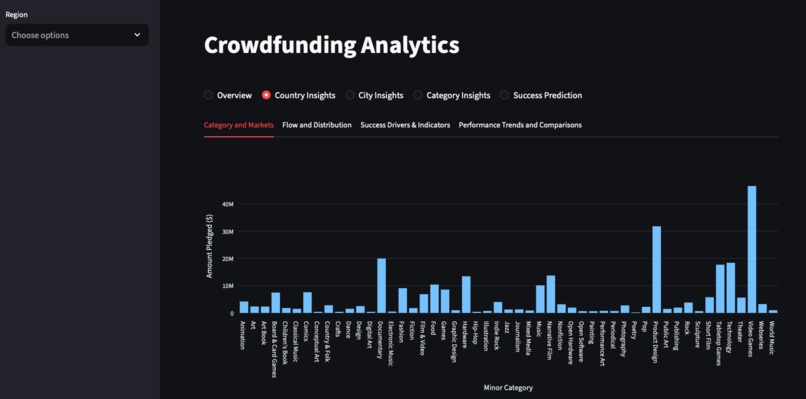
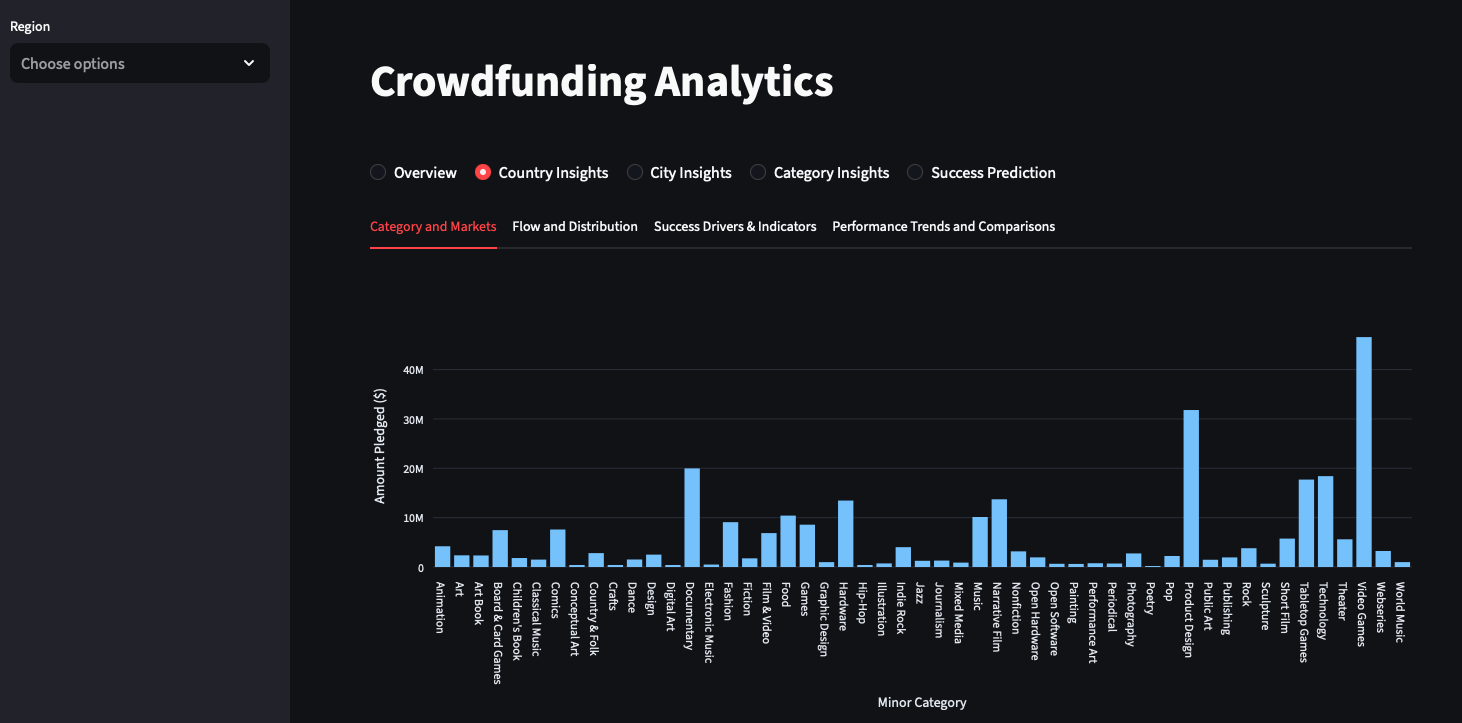
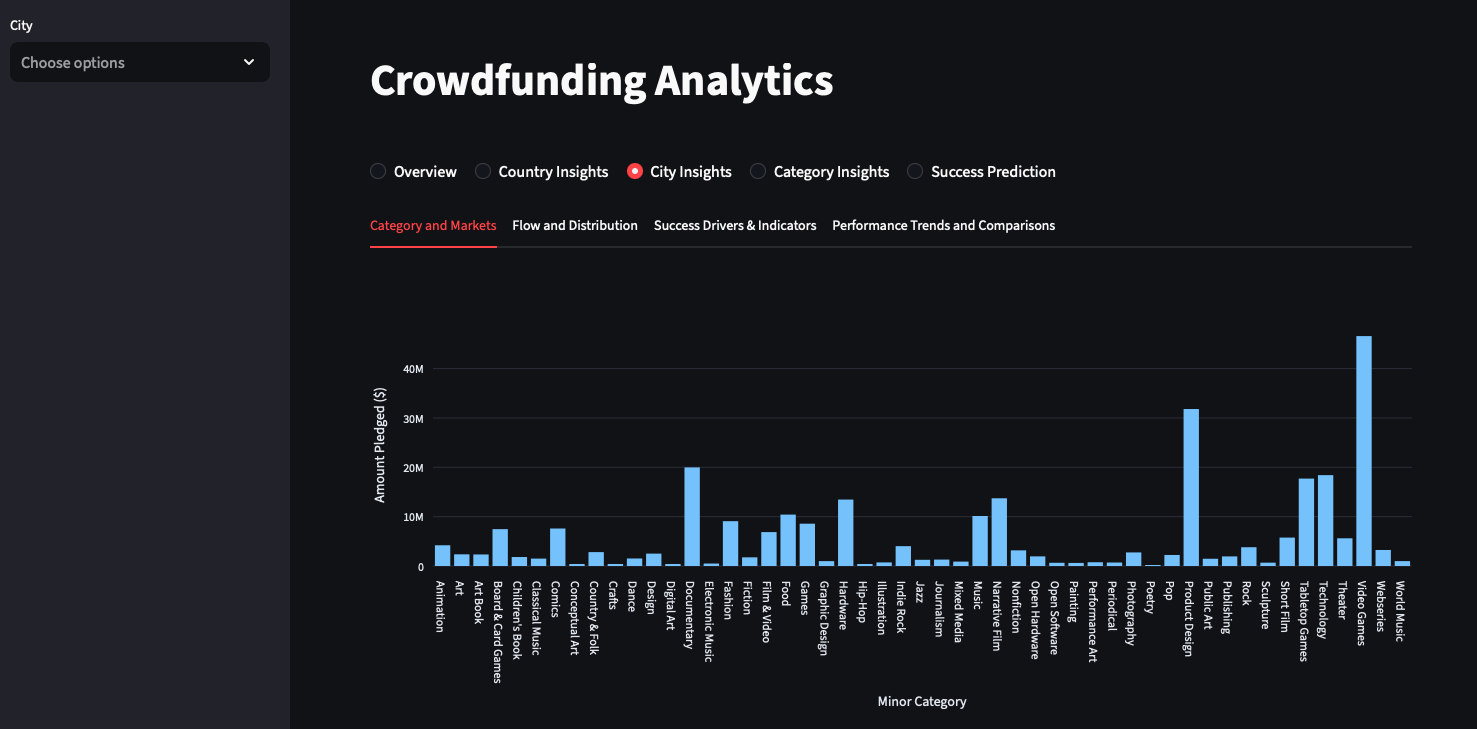
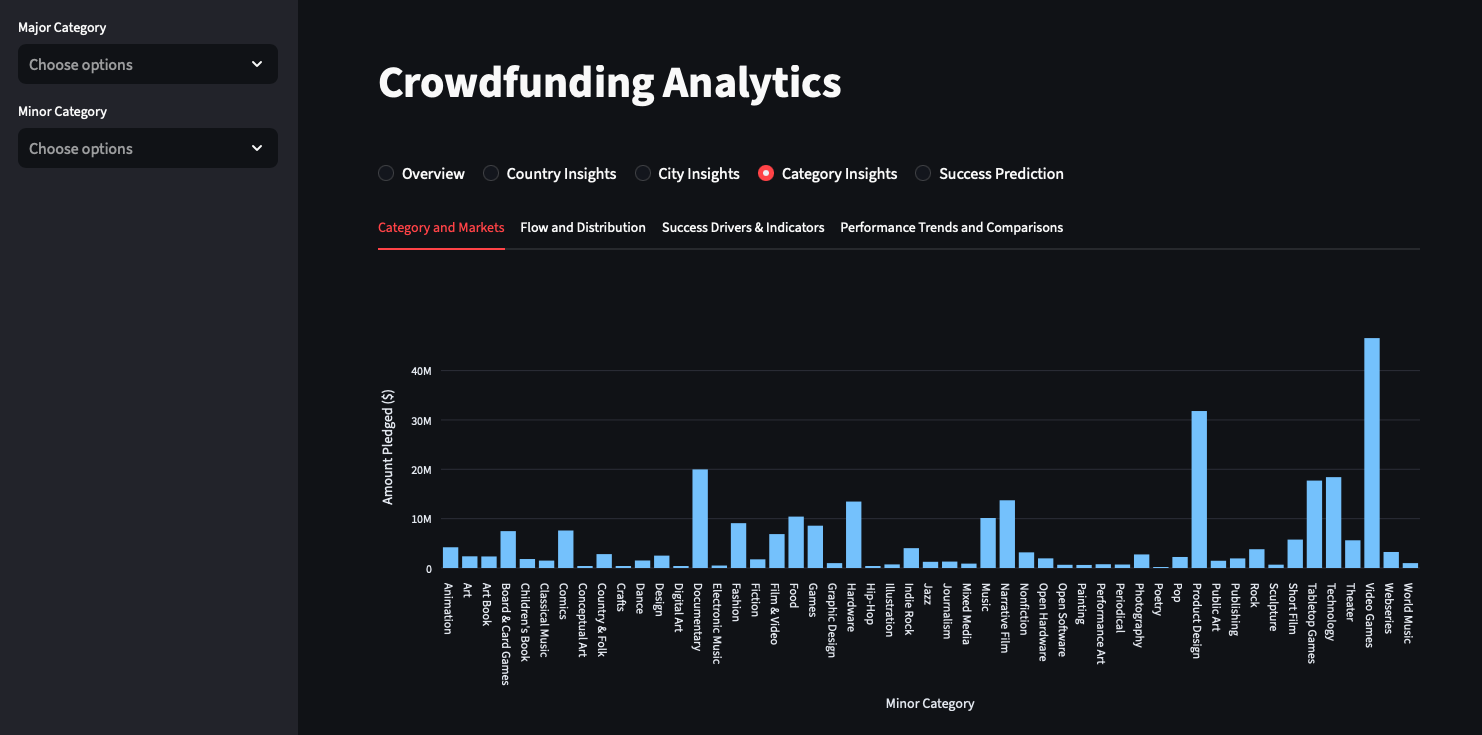
Category and Market Insights
-

Performance Trend and Comparison
-

Flow and Distribution
-
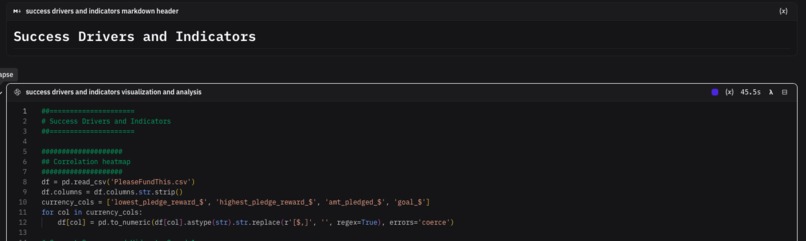
Success Drivers and Indicators
-
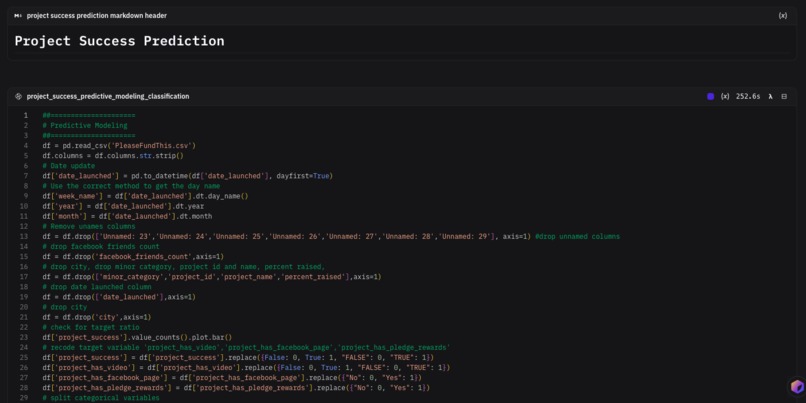
Project Success Prediction
-
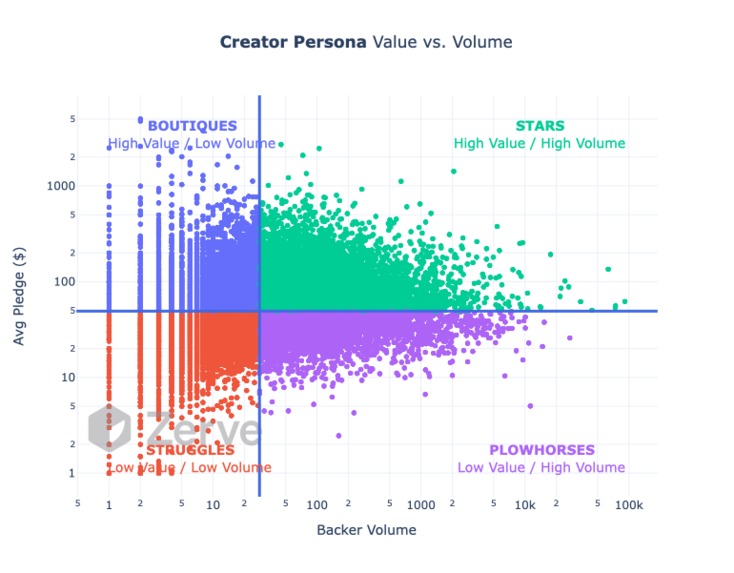
Creator Persona Value vs Volume
-
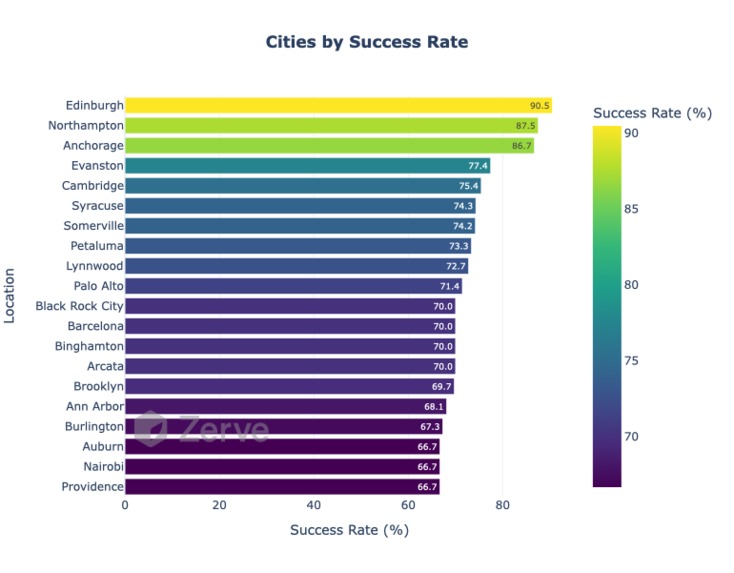
Cities by Success Rate
-
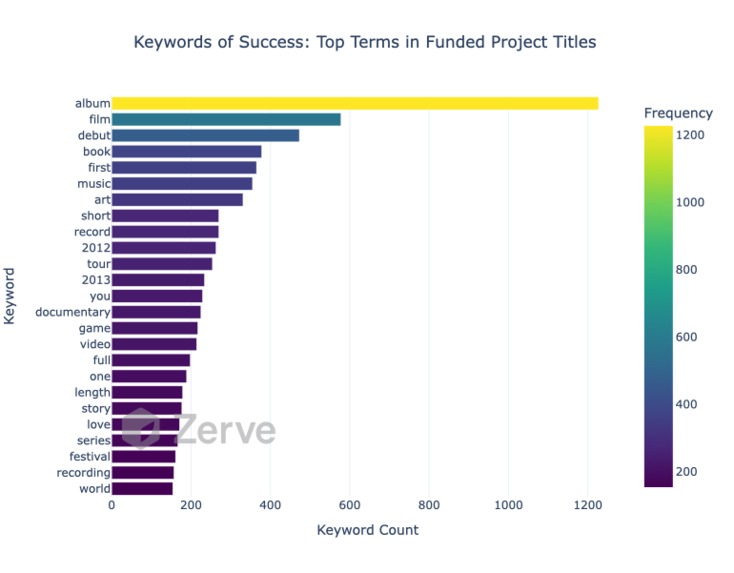
Keyword of Success
-
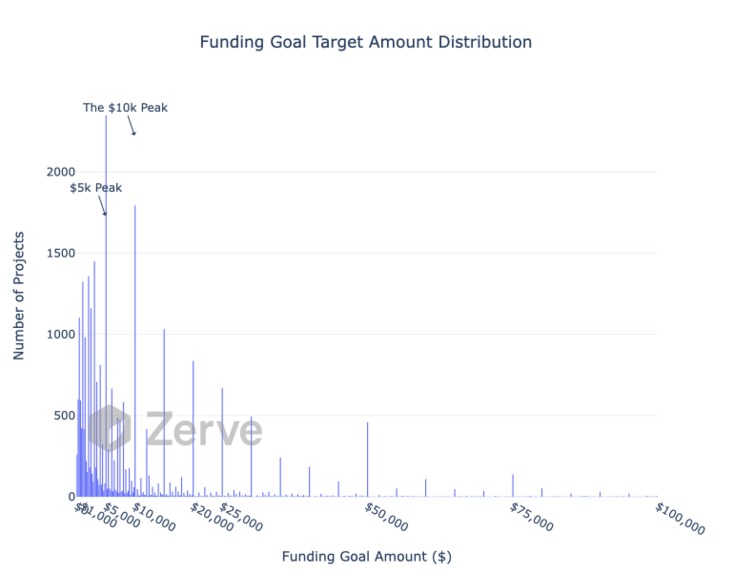
Funding Goal Target Distribution
-
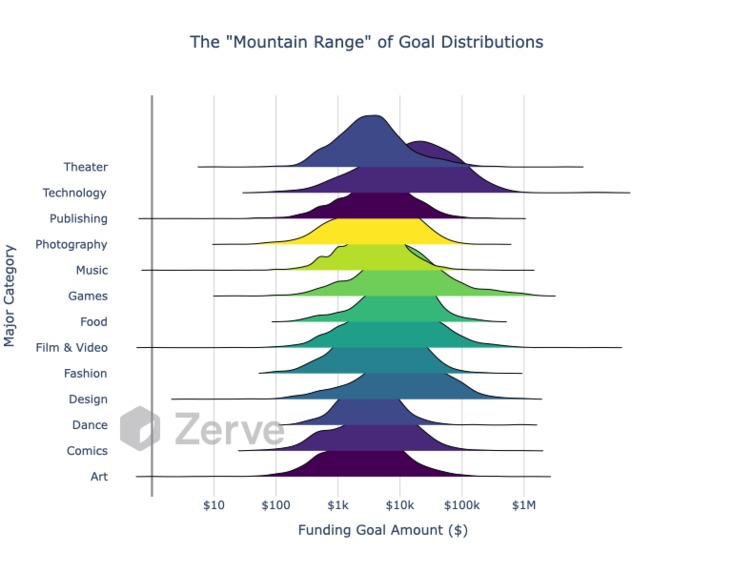
Mountain range of goal distribution
-
Pledgers by Category
-
Pledge Amount by Minor Category
-
Pledge Amount by Major Category
-
Funding Hierarchy - Major to Minor Breakdown
-
Magnitude of Overfunding
-
Funding Gap by Category
-
Success Rate by Day of Week
-
Seasonal Success
-

multi-factor success path
-
High tier reward pledge density
-
Entry level reward pledge density
-

Success Rate by Project Type
-
Project Flow from Category to Success
-

Anchor Effect
-

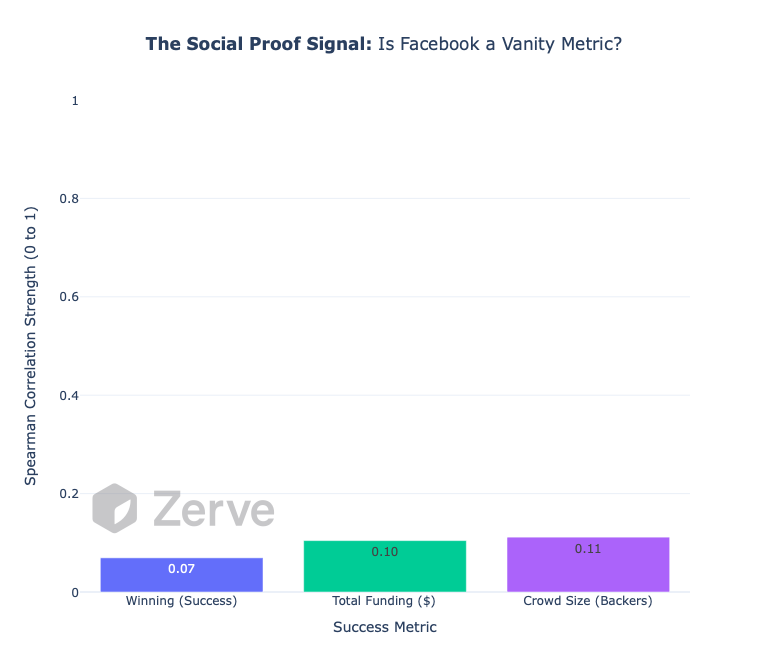
Social Proof Signal
-
Anatomy of an overachiever
-
Backer Value Index
-
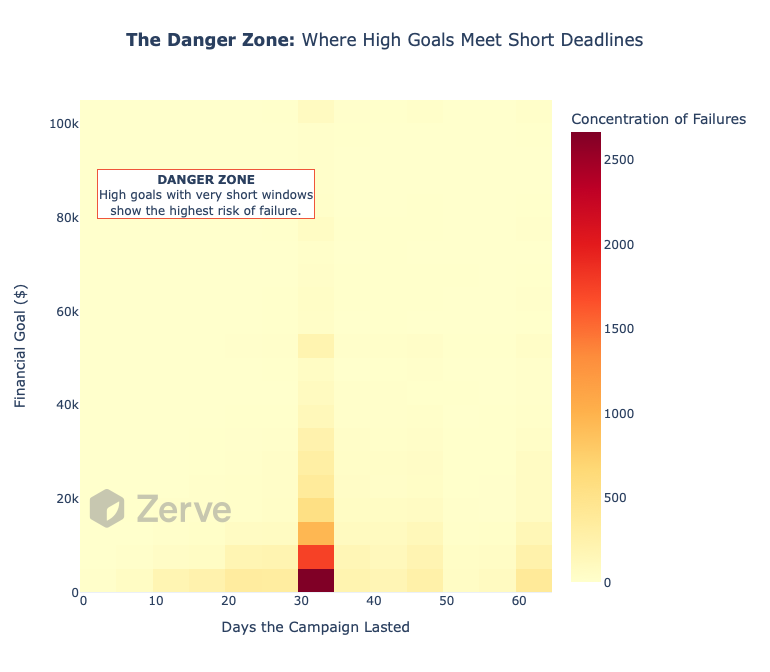
Danger Zone
-
Crowdsourcing Power
-
Social Lift
-
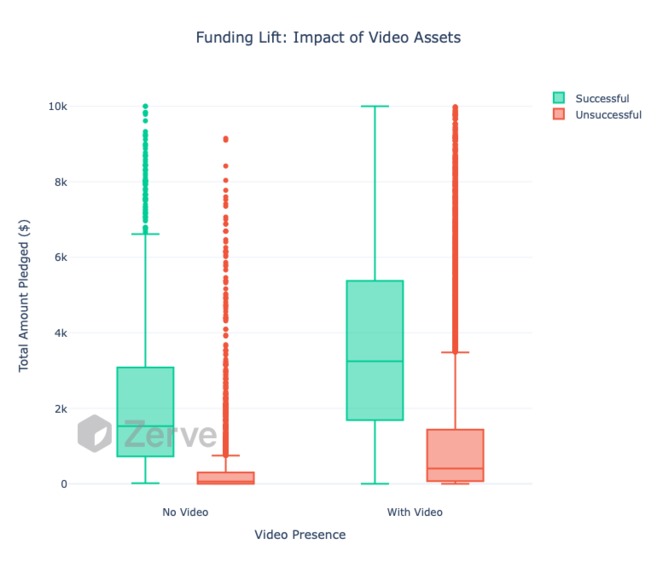
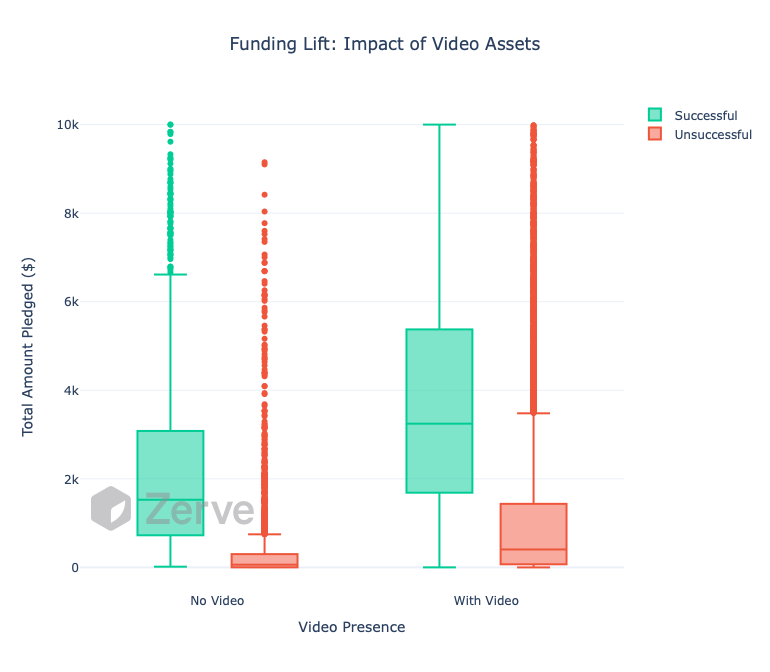
Funding Lift Impact of Video
-
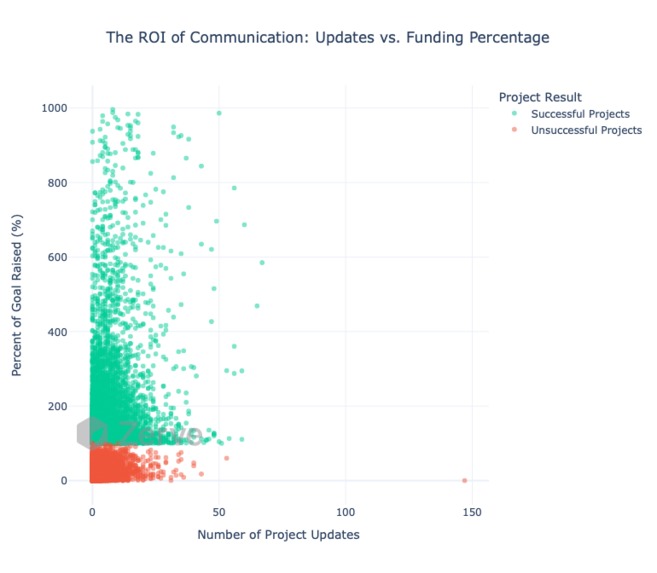
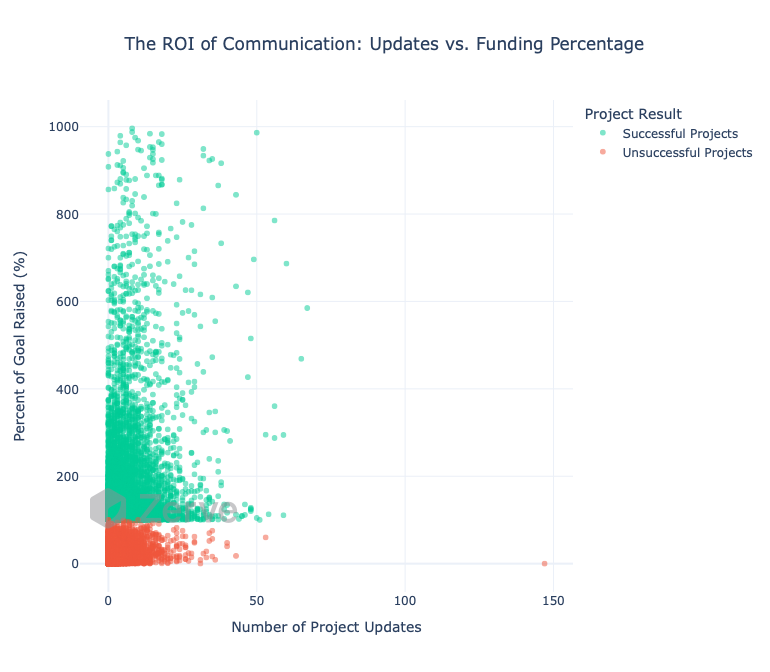
ROI of Communication
-
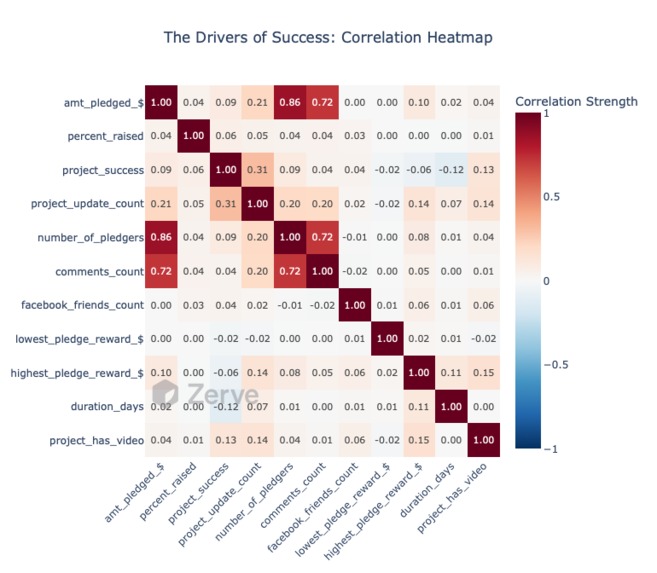
Drivers of Success
-
Streamlit app overview
-
Streamlit app Country Insights
-
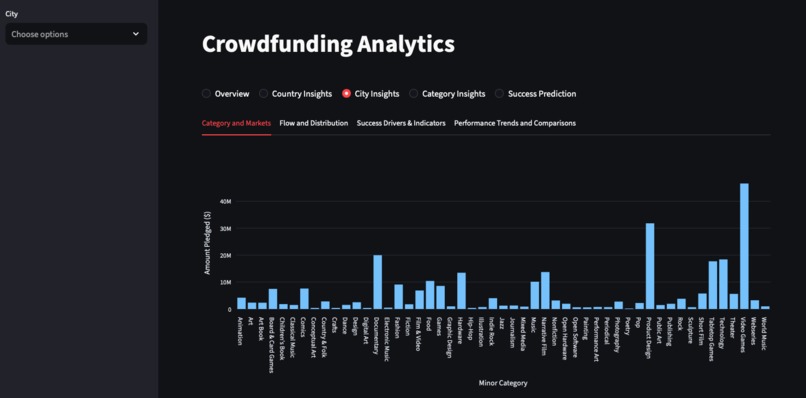
Streamlit app City Insights
-
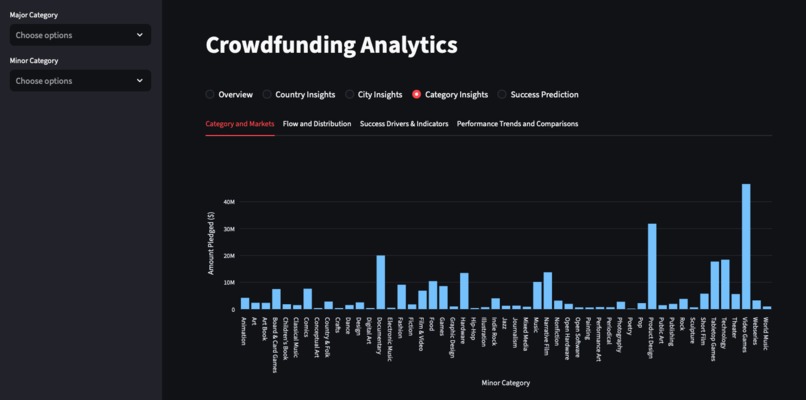
Streamlit app Category Insights
-
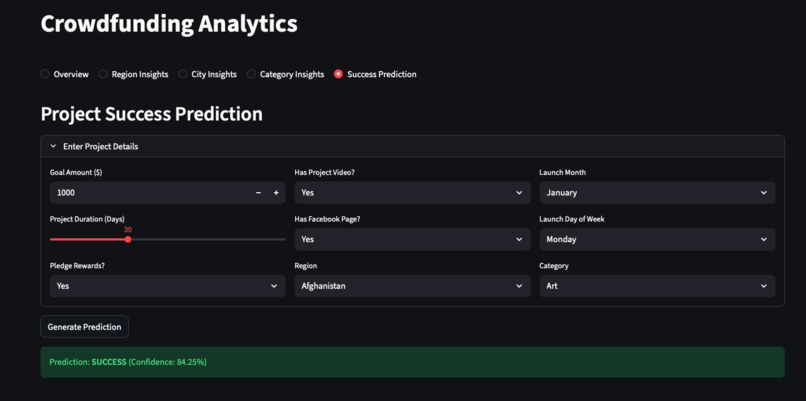
Streamlit app Success Prediction


Inspiration
The inspiration for doing the analysis was listening the Exploding Kittens episode of How I Built This podcast by Guy Raz. The episode was talking about how an entrepreneur used crowdfunding to sell their card product. I wanted to explore this more from an analytics standpoint.
What it does (Project Summary)
The analysis looks at crowdfunding from different perspective leveraging visualization, analytics and machine learning. It focused on 4 core themes. The analysis was done using the zerve.ai platform.
- Category & Market Insights (The "Where"): This theme establishes the environment. It helps the user get a good performance baseline.
- Performance Trends & Comparison (The "When & How Much"): This theme focuses on benchmarking. It moves from what the market is to how it behaves over time and against expectations.
- Flow & Distribution (The "Who & What"): This theme analyzes the mechanics of the crowd. It looks at how many people are involved and at what price points.
- Success Drivers & Indicators (The "Why"): This theme attempts to find metrics that would drive crowdfunding outcomes.
A crowdfunding success classification model was built. I Peformed training and tested using the data using different machine learning models and experiments. I then settled on a gradient boosting model. The finalized model had an accuracy of 66%.
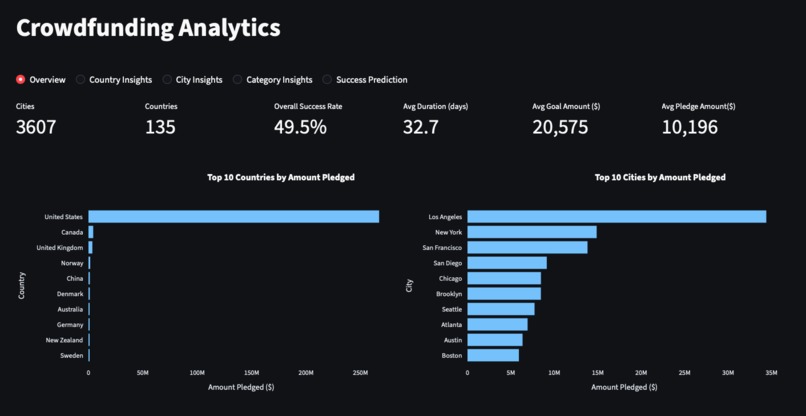
A web app was built that covers the 4 themes and the predictive model using streamlit. It has an overview section, Country Insights, City Insights, Category Insights and Success Prediction.
How it was built
- The app was built using Crowdfunding data
- zerve.ai served as the analysis and prediction platform
- Python libraries were used for the analysis (Pandas), visualization (Plotly) and machine learning (scikit-learn)
- Web app built using Streamlit
Key Insights
The key insights are aligned to the themes show in the Project Summary section.
Category and Market Insights
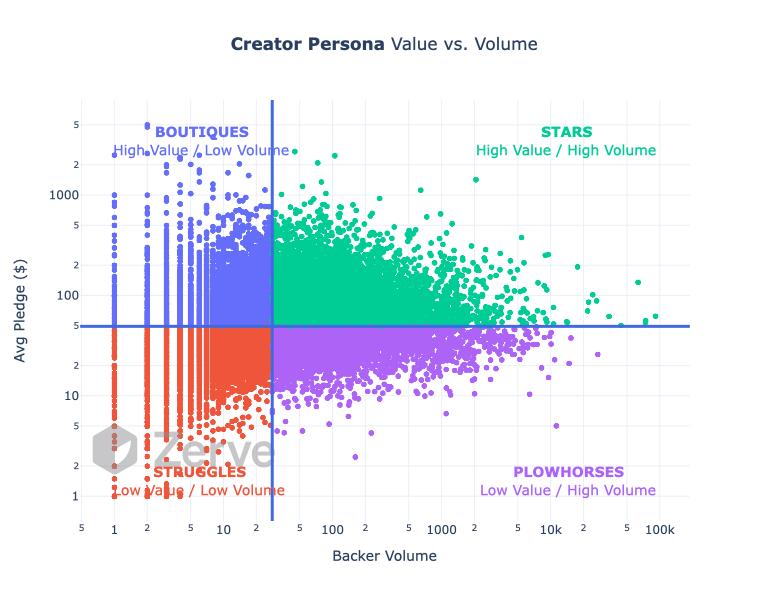
- Creator Persona: Value vs. Volume: Most creators are stuck in the "Struggles" phase; moving to "Star" status requires a rare "double threat" of high prices and massive popularity. See Createor Persona Value vs Volume chart for more details.
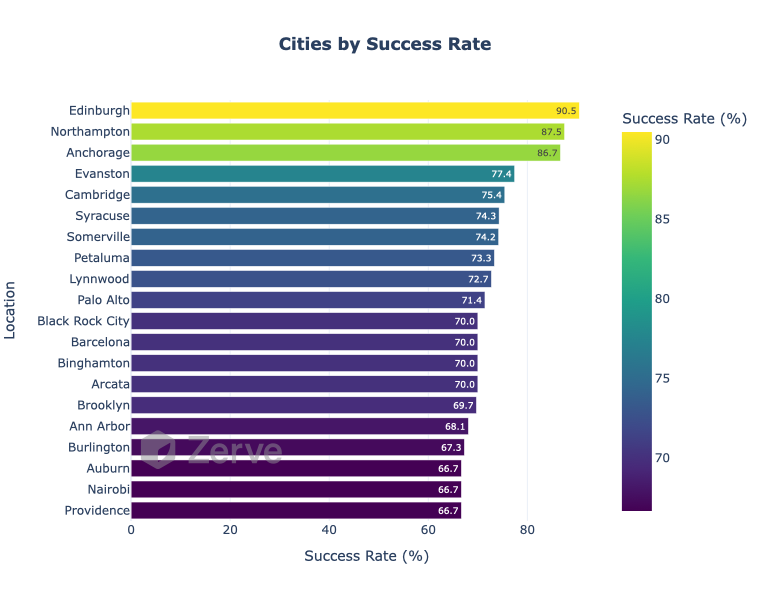
- Cities by Success Rate: High success isn't about being in a "big" city; smaller, specialized creative hubs like Edinburgh are much more effective for crowdfunding. This suggests that smaller, high-trust communities provide better support for local projects. See Cities by Success Rate chart for more details.
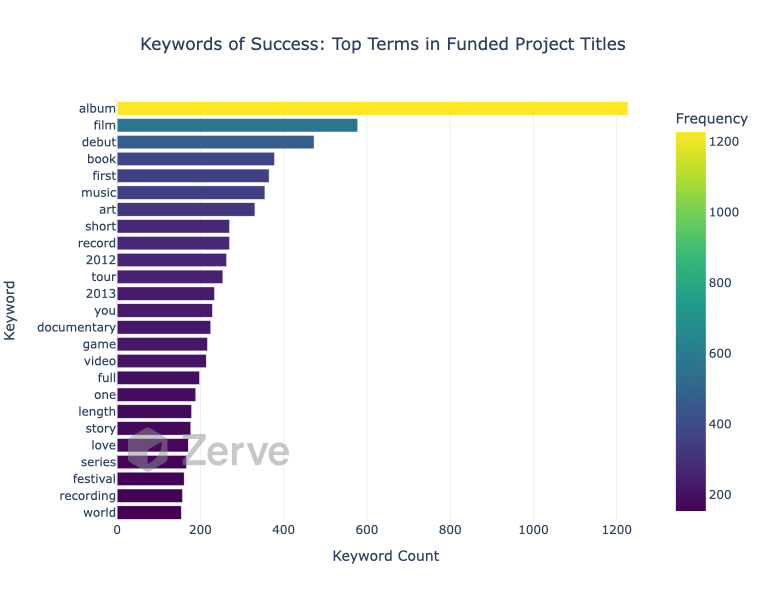
- Keywords of Success: Backers are most attracted to "firsts" and physical, traditional media. The word "Album" is the single most powerful driver of funded projects. See Keyword of Success chart for more details.
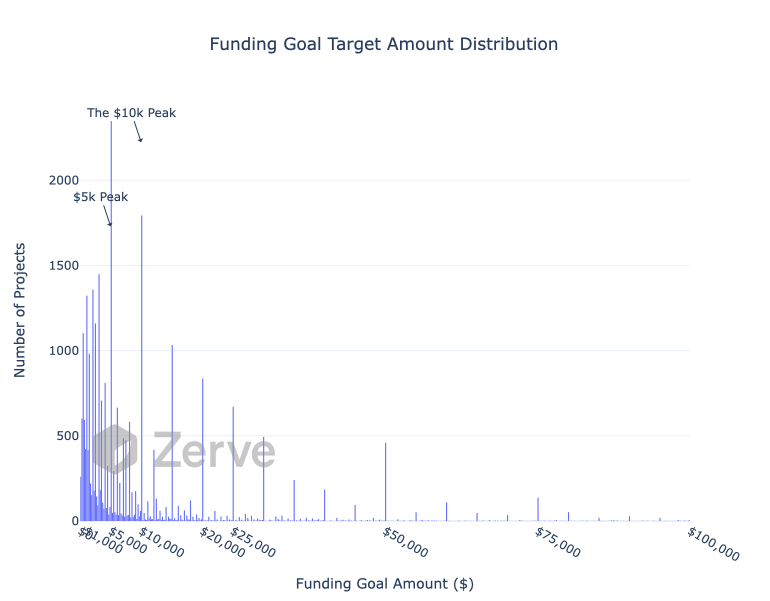
- Funding Goal Target Amount Distribution: Creators rely on "psychological round numbers" like $5,000 and $10,000 to set their goals, rather than calculating exact project costs. See Funding Goal Target Distribution chart for more details.
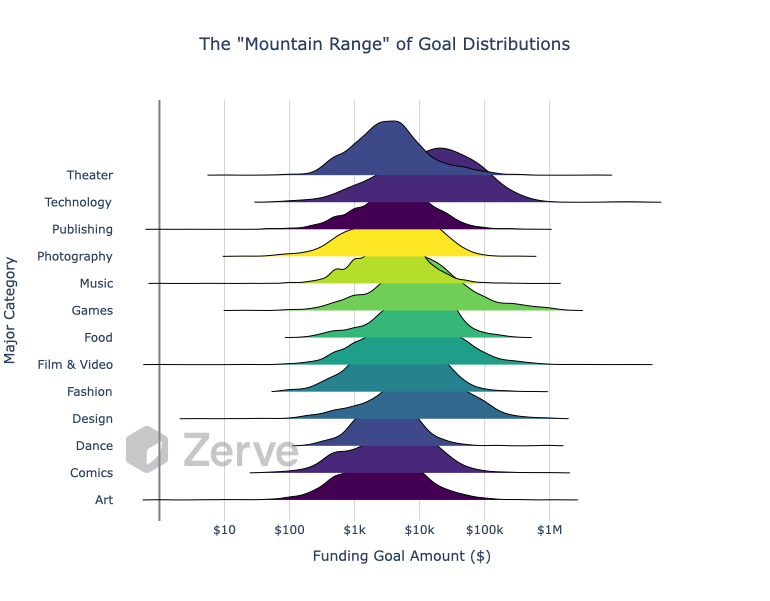
- The "Mountain Range" of Goal Distributions: Different industries have completely different "normal" costs; Technology projects typically ask for 10x more than Art or Dance projects. See Mountain range of goal distribution chart for more details.
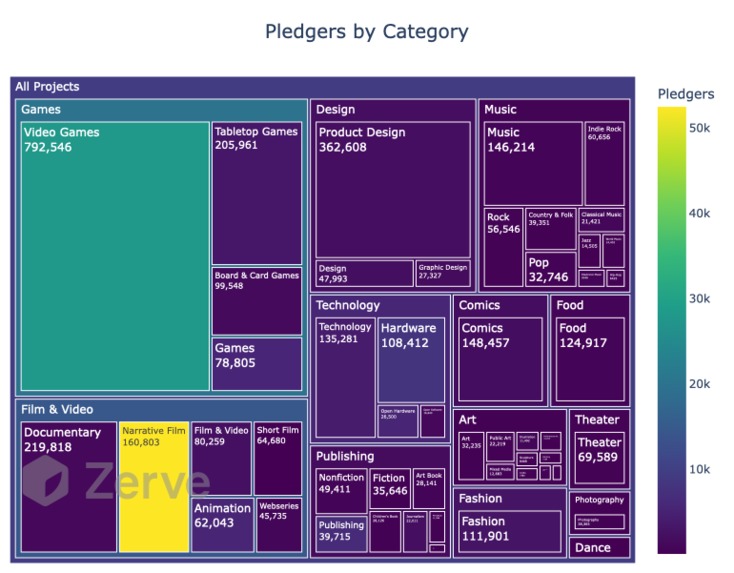
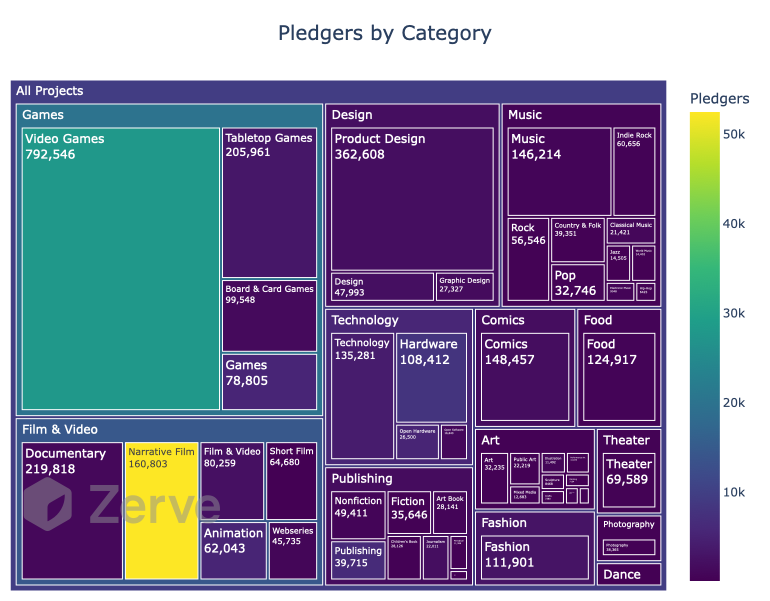
- Pledgers by Category: Video Games and Narrative Film are the "community kings." They don't just raise money; they attract the highest volume of individual people. See Pledgers by Category chart for more details.
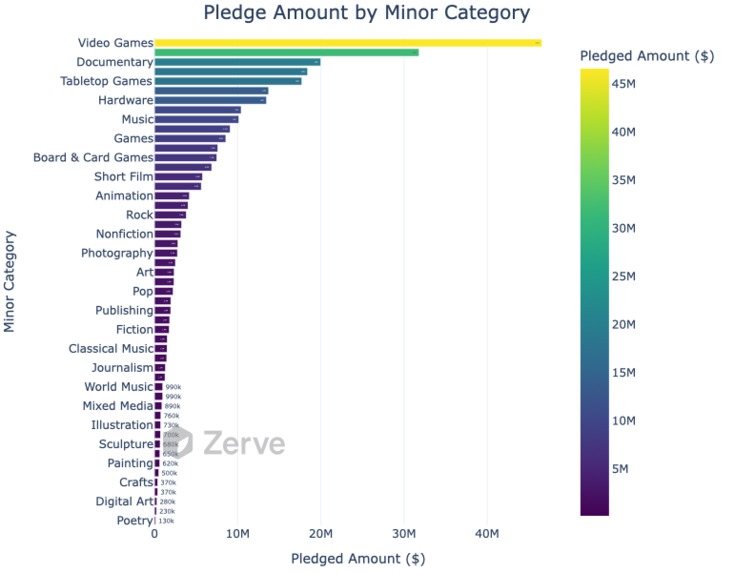
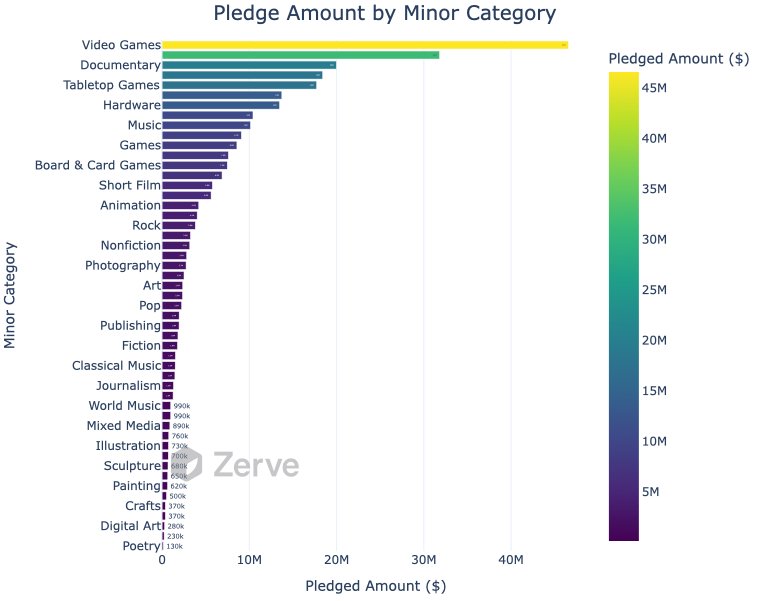
- Pledge Amount by Minor Category: Within the gaming world, Video Games are the undisputed heavyweight, earning more than double the next most successful sub-category (Documentaries). See Pledge Amount by Minor Category chart for more details.
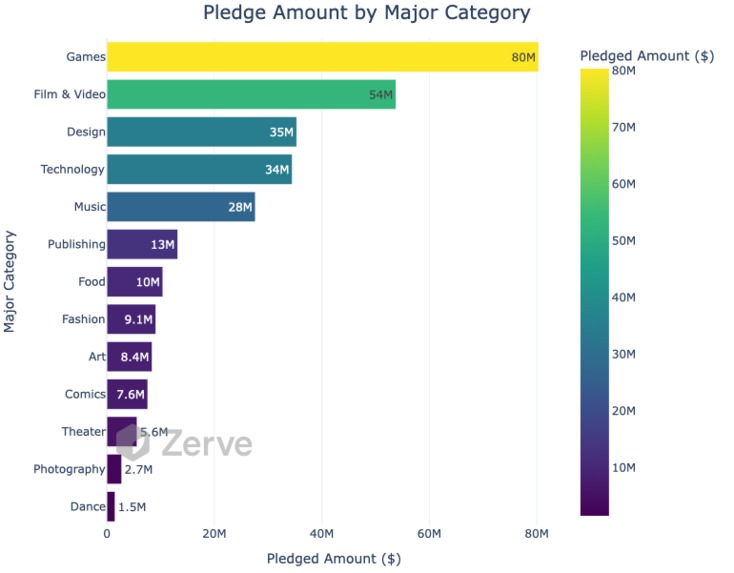
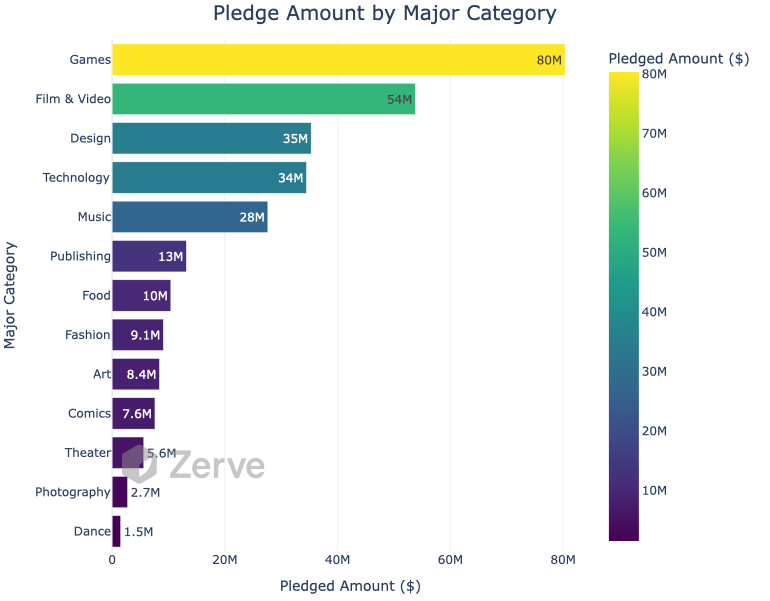
- Pledge Amount by Major Category: There is a "Top 5" elite group of categories (Games, Film, Design, Tech, Music) that captures the vast majority of all crowdfunding dollars. See Pledge Amount by Major Category chart for more details.
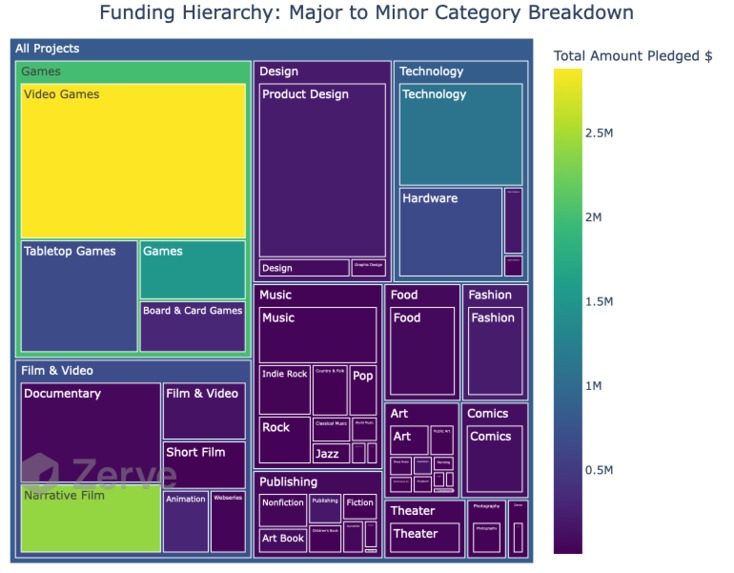
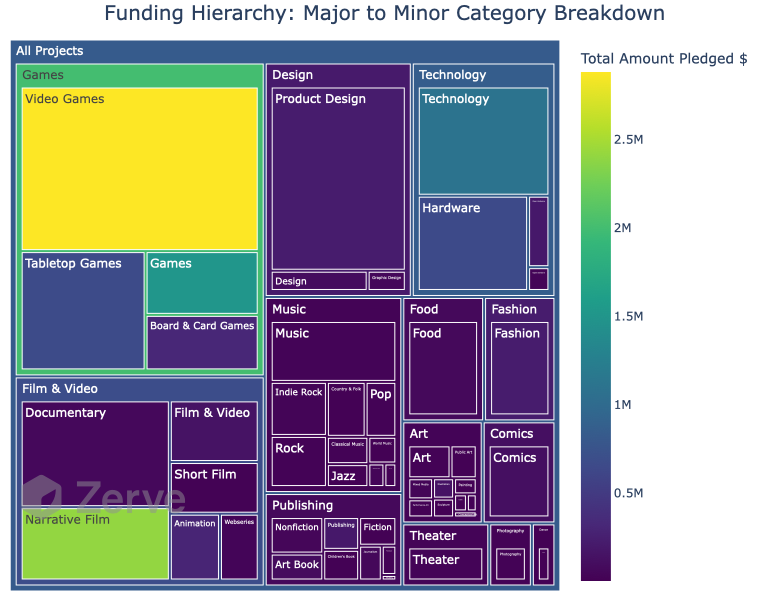
- Funding Hierarchy - Major to Minor Breakdown: Success in "Design" and "Technology" is extremely narrow; almost all the money goes to Product Design and Hardware, leaving very little for software or graphics. See Funding Hierarchy - Major to Minor Breakdown chart for more details.
Performance Trends and Comparison Insights
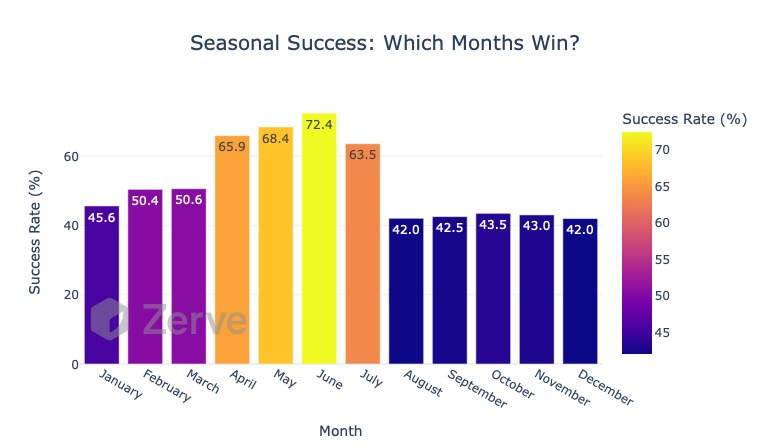
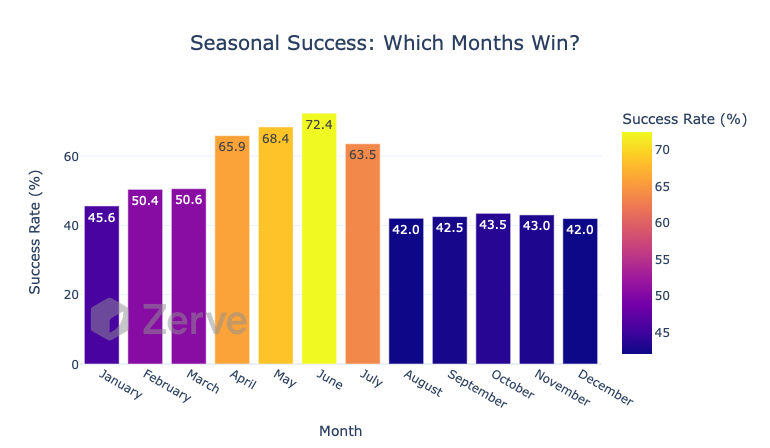
- Seasonal Success: Which Months Win?: There is a massive "Spring-Summer Peak" for crowdfunding success, while the end of the year is a graveyard for new projects. See Seasonal Success chart for more details.
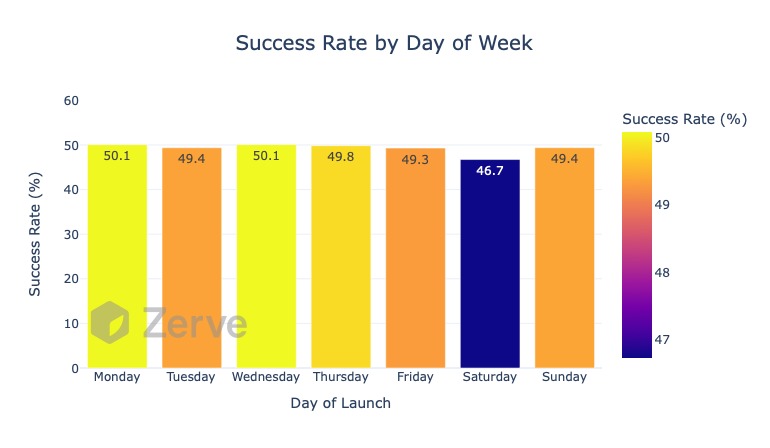
- Success Rate by Day of Week: The specific day you launch your project is surprisingly irrelevant—unless you launch on a Saturday. See Success Rate by Day of Week chart for more details.
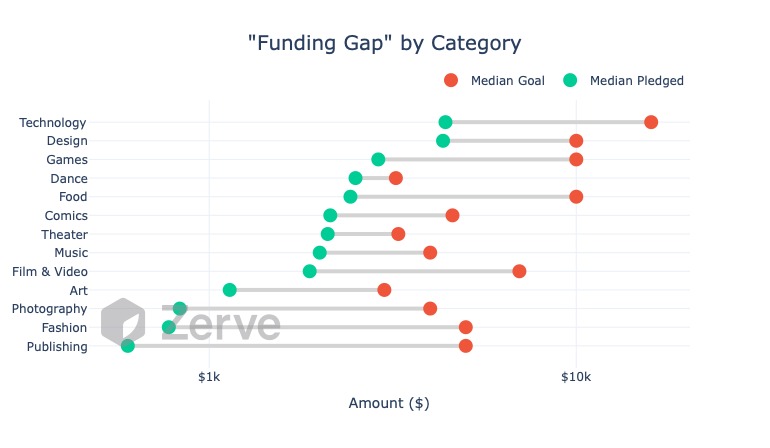
- "Funding Gap" by Category: Some industries are much more realistic about their value than others; Technology and Design creators set high goals but come closest to hitting them, while Publishing and Fashion projects are significantly over-ambitious. See Funding Gap by Category chart for more details.
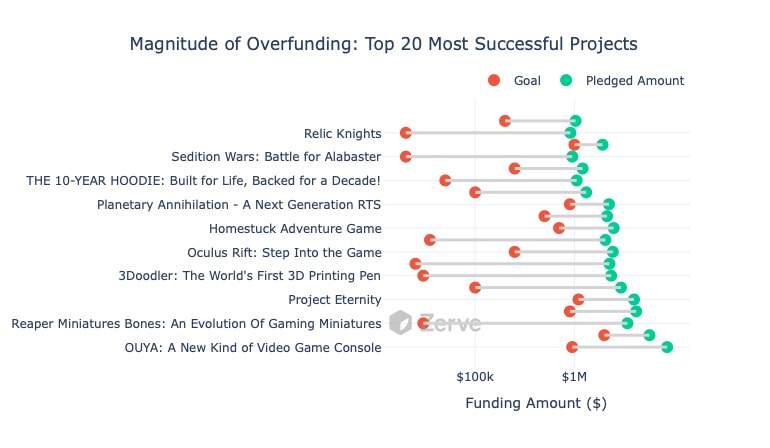
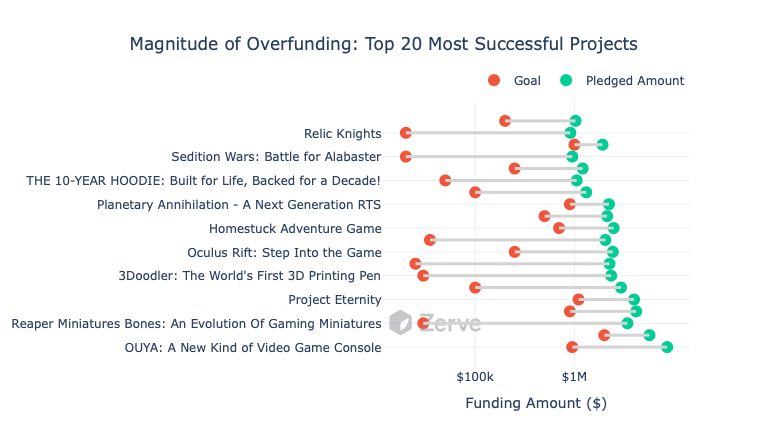
- Magnitude of Overfunding: Top 20 Most Successful Projects: The "Super-Successes" of crowdfunding (like Oculus Rift or OUYA) aren't just hitting their goals; they are often exceeding them by millions of dollars. See Magnitude of Overfunding chart for more details.
Flow and Distribution Insights
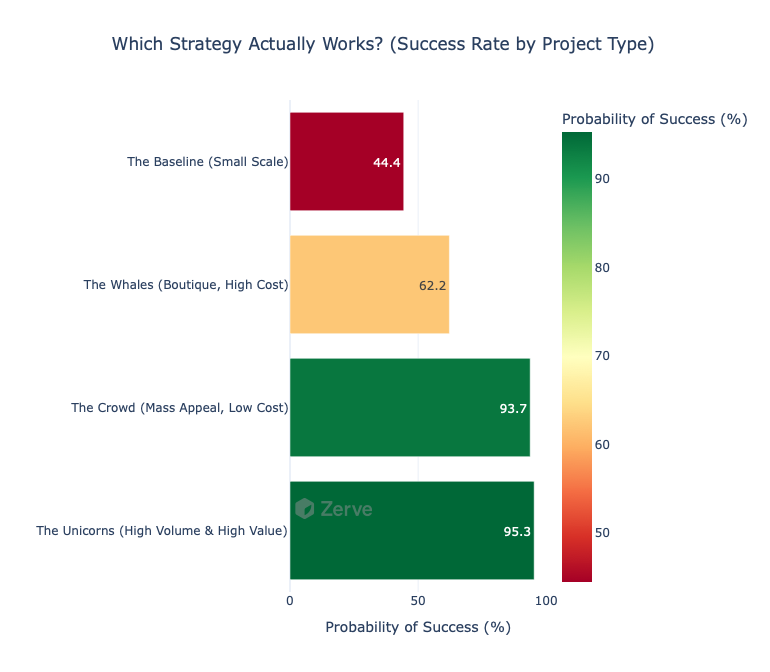
- Success Rate by Project Type: High volume is the strongest predictor of success, but mass appeal at a low cost is nearly as effective. See Success Rate by Project Type chart for more details.
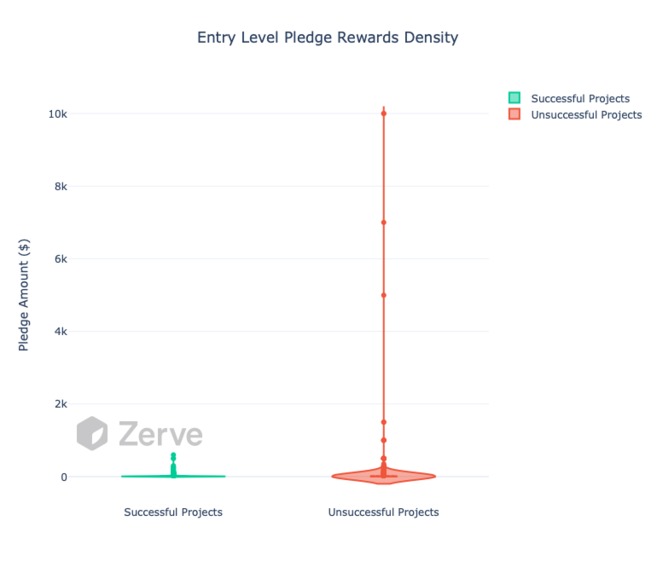
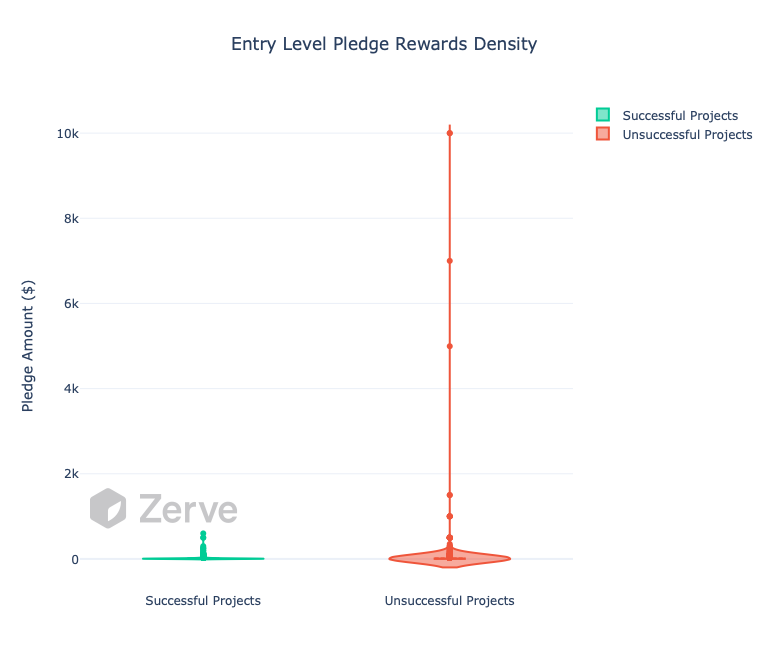
- Entry-Level Pledge Rewards Density: Successful projects keep their "buy-in" price low and focused, while failed projects often try to offer extremely expensive entry-level tiers. See Entry level reward pledge density chart for more details.
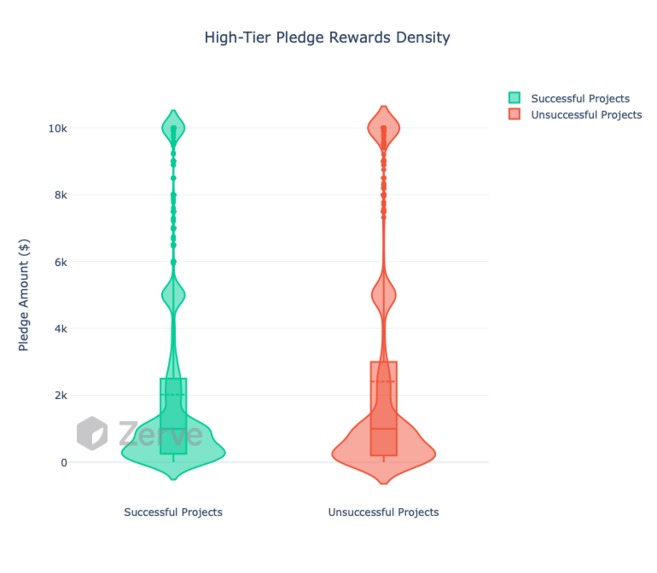
- High-Tier Pledge Rewards Density: Both successful and failed projects offer "VIP" rewards at the $10k mark, but successful projects have a much higher concentration of rewards in the $1k–$2k "sweet spot". See High tier reward pledge density chart for more details.
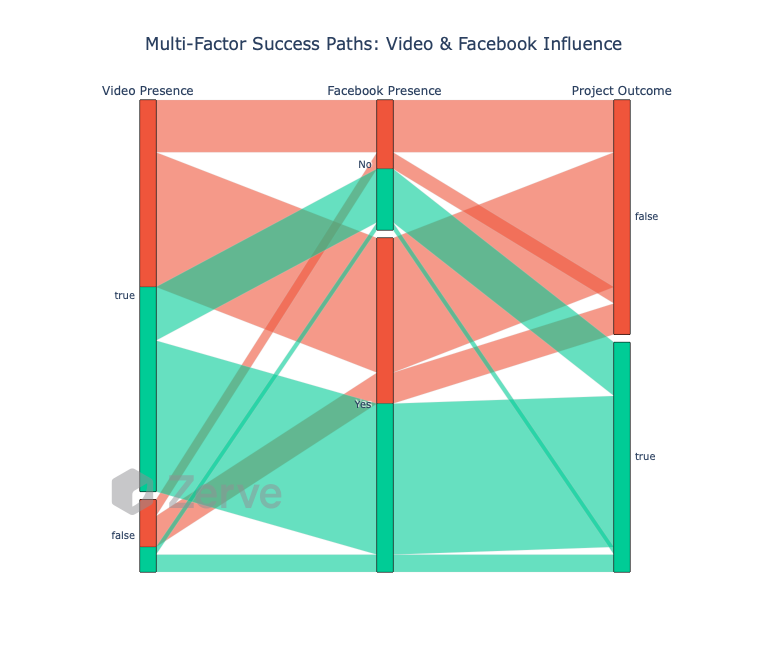
- Multi-Factor Success Paths: Video & Facebook: A video is a "must-have," but Facebook presence is the ultimate "deal-maker." See multi-factor success path chart for more details.
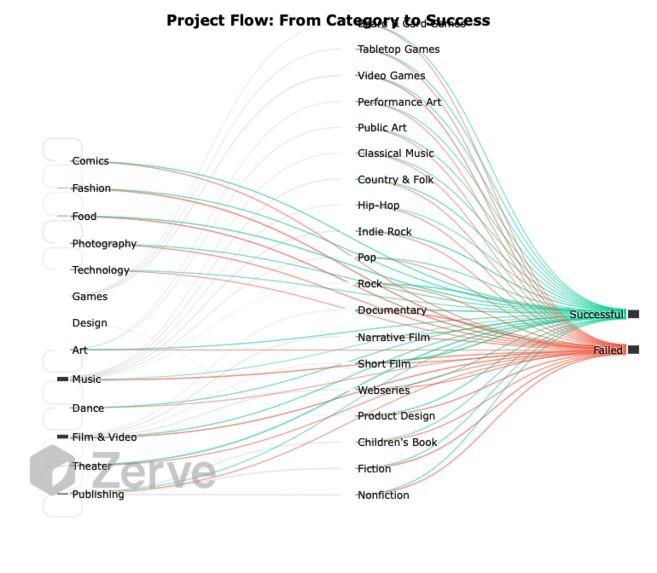
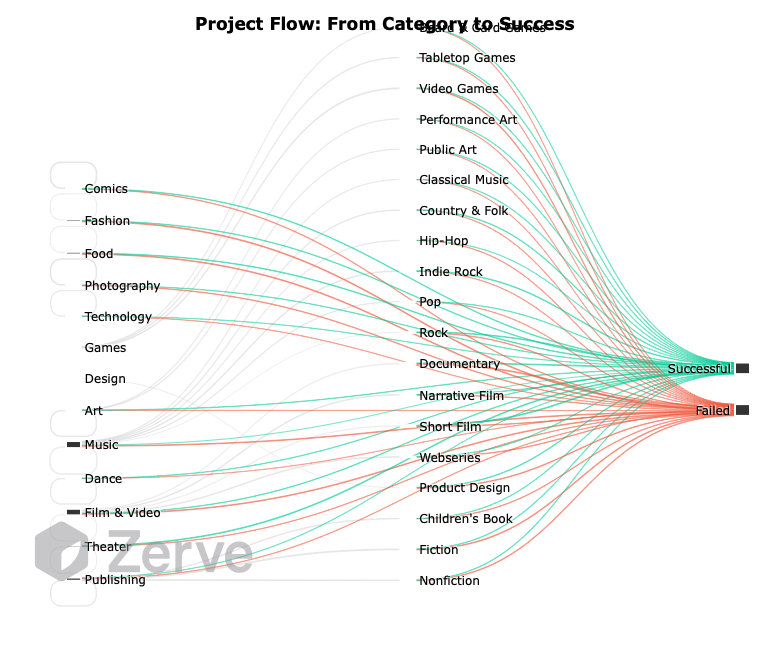
- Project Flow: From Category to Success: Creative "niche" categories like Dance, Theater, and Comics have a much higher flow toward "Successful" than broad categories like Technology or Publishing. See Project Flow from Category to Success chart for more details.
Success Drivers and Indicators Insights
- The ROI of Communication: Regular updates function as "social proof" and momentum builders. Each update triggers an email to backers, keeping the project top-of-mind and encouraging "viral" sharing. A lack of updates signals a dead or abandoned project to potential donors. See ROI of Communication chart for more details.
- Funding Lift: Impact of Video Assets: Crowdfunding is an exercise in trust. A video humanizes the creator and demonstrates a working prototype or a clear vision, reducing the "perceived risk" for the backer. This higher trust translates directly into a willingness to pledge larger amounts. See Funding Lift Impact of Video for more details
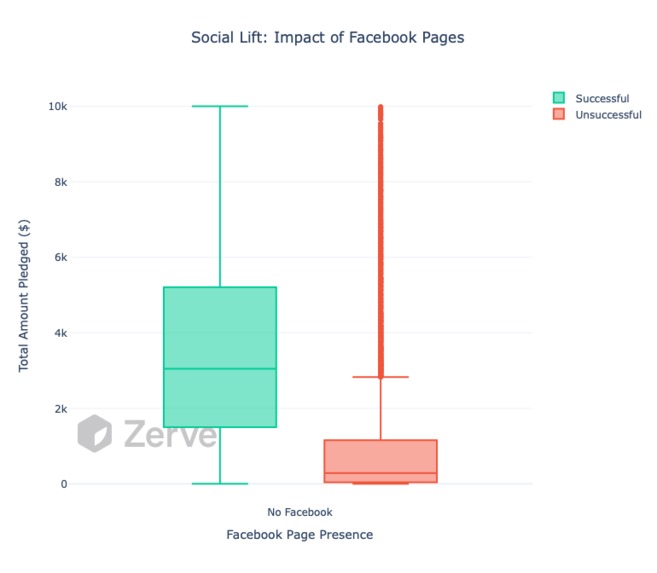
- Social Lift: Impact of Facebook Pages: Projects with a Facebook presence show a much tighter and higher distribution of success, while the "No Facebook" category has a median funding near zero. See Social Lift chart for more details.
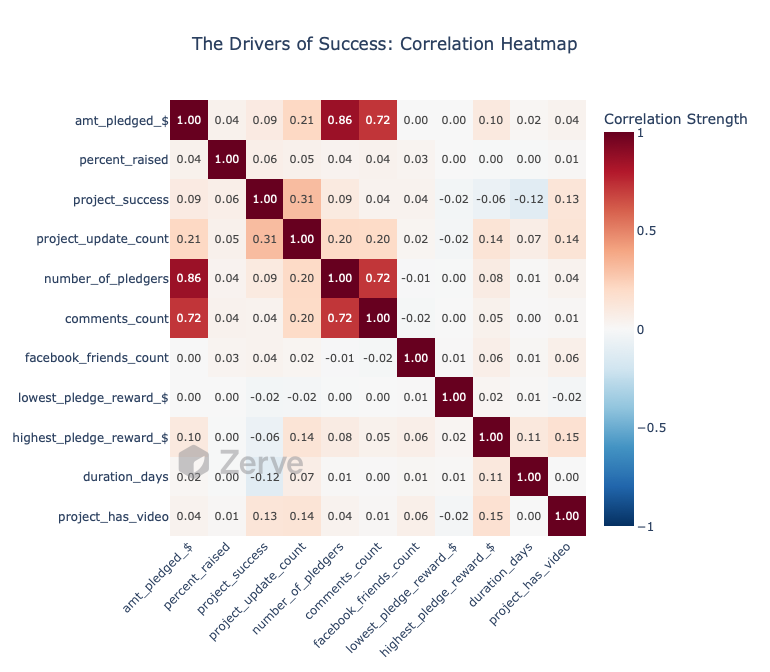
- The Drivers of Success: Success is driven by the size of the crowd rather than the length of the campaign. Adding more days to a campaign doesn't help if you aren't actively acquiring new backers; in fact, longer campaigns often lose momentum and urgency. The strongest positive correlation is between Amount Pledged $ and # of Pledgers is 86%, followed by comment counts 72%. Interestingly, Duration days has a negligible or slightly negative correlation with success -12%. See Drivers of success chart for more details.
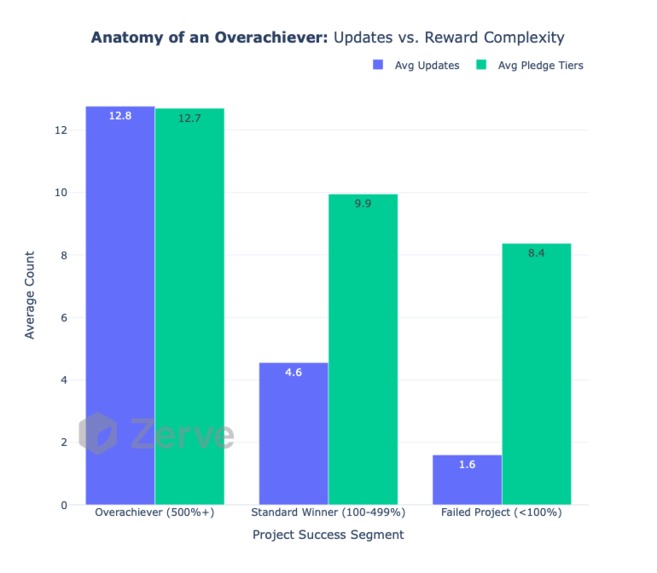
- Anatomy of an Overachiever: Updates vs. Reward Complexity: Overachievers (500%+) average 12.8 updates and 12.7 pledge tiers. Standard winners drop to 4.6 updates and 9.9 tiers. High-performing projects offer "something for everyone." By having more tiers, they capture different levels of disposable income. By having more updates, they maintain the "hype cycle" required to blow past their original goal. See Anatomy of an Overachiever chart for more details.
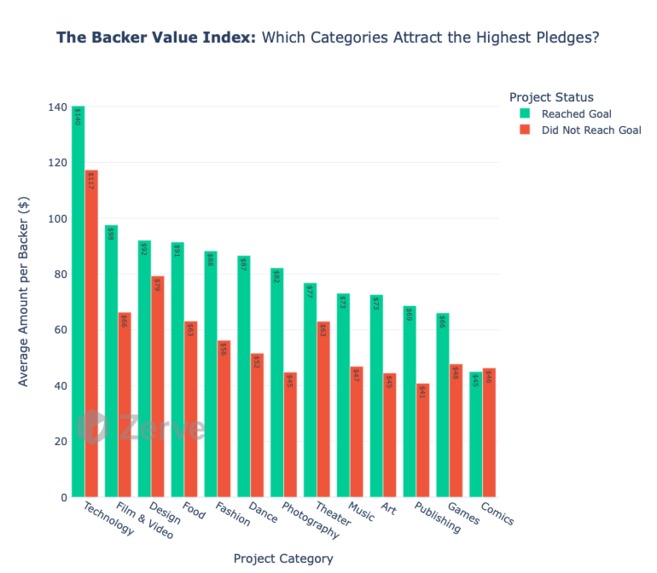
- The Backer Value Index: Category-Specific Pledges: Technology leads with an average pledge of $140 for successful projects, while Comics and Games sit at the bottom around $45–$46. This reflects the "unit price" of the industry. A new tech gadget costs more to produce and buy than a single comic book or a digital game download. Tech creators need fewer backers to hit a $10k goal than a comic creator does. See Backer Value Index chadt for more details.
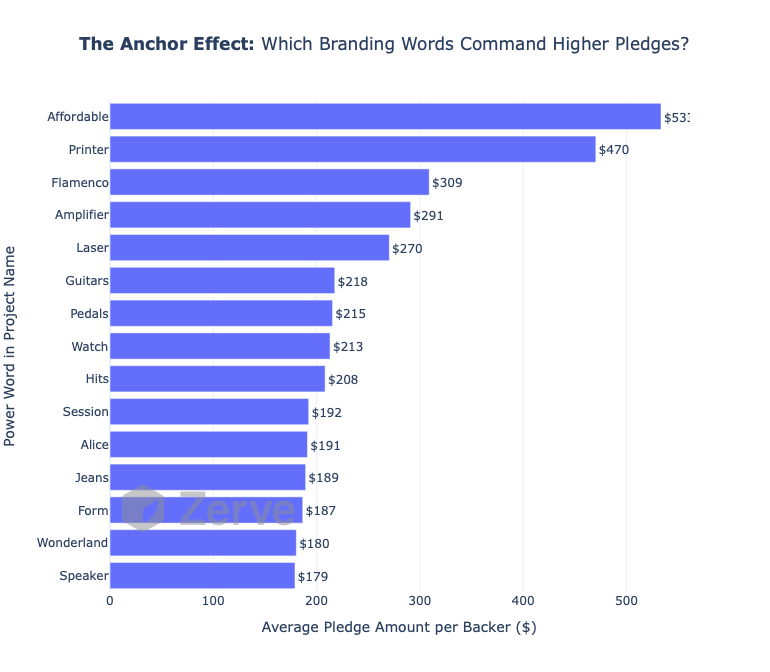
- The Anchor Effect: Power Words in Branding: Projects using the word "Affordable" command an average pledge of $533, while "Speaker" or "Wonderland" sit below $200. This is a psychological "anchor." Paradoxically, labeling something "affordable" often attracts high-value buyers looking for a "deal" on a premium item (like high-end audio or tech), leading to higher individual transaction values. See Anchor Effect chart for more details
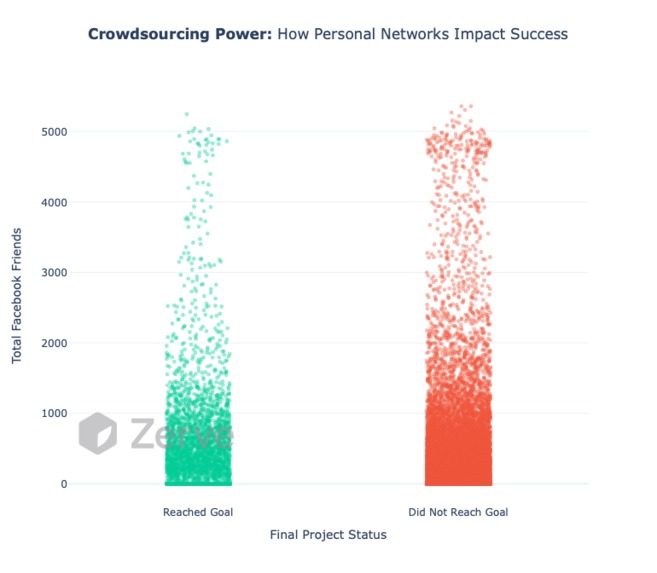
- Crowdsourcing Power: Personal Networks: The distribution of Facebook friends for those who "Reached Goal" vs. those who "Did Not" is nearly identical in density, with both groups clustering heavily under 1,000 friends. Successful creators convert strangers into backers through marketing, rather than just relying on friends and family. See Crowdsourcing power chart for more details.
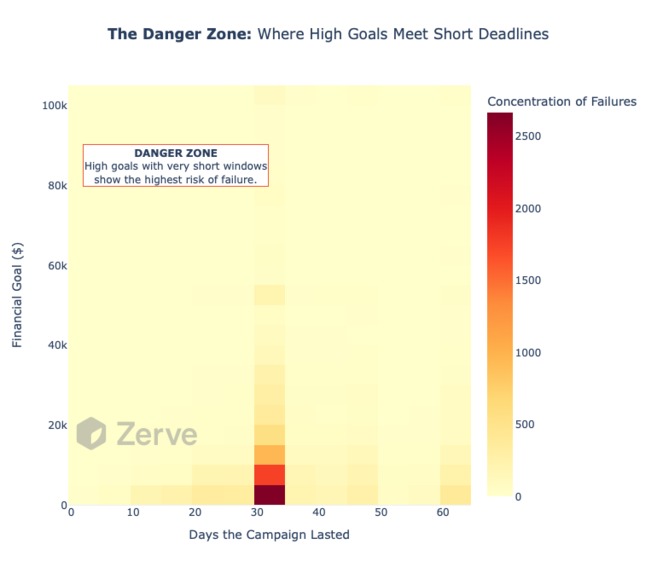
- The Danger Zone: Goals vs. Deadlines: The heat map shows a massive concentration of failures (dark red) at the 30-day mark for goals under $10,000. Many creators choose the 30-day default and a "modest" goal but fail because they lack the marketing assets (Video/Facebook) to fill that window. It’s the "zone" where lack of preparation meets the reality of platform competition. See Danger Zone chart for more details
- The Social Proof Signal: It shows a very low correlation (0.07 to 0.11) between Facebook metrics and the actual "Winning" outcome. This reinforces Facebook is a tool for communication, not a guarantee of funds. A project needs a Facebook presence to look legitimate, but the presence itself doesn't "force" people to spend money; the product and the updates do that. See Social Proof Signal chart for more details
Challenges
- The main challenge was understanding how the Zerve.ai platform worked. I noticed if I made to many block the app slowed down so had to reduce the number of blocks used.
Accomplishments
- The ability to learn about the Zerve.ai platform, do analysis and deploy an app using streamlit.
Next steps
- Next Best Pledge: Build Predictive model to Find the right Pledge Amount to ask for
- Category Intelligence: Give the users the ability to ask questions using an LLM so that they are better setup for success

Log in or sign up for Devpost to join the conversation.