Table 16
Inspiration
We wanted to learn more about IoT and its applications to the real world.
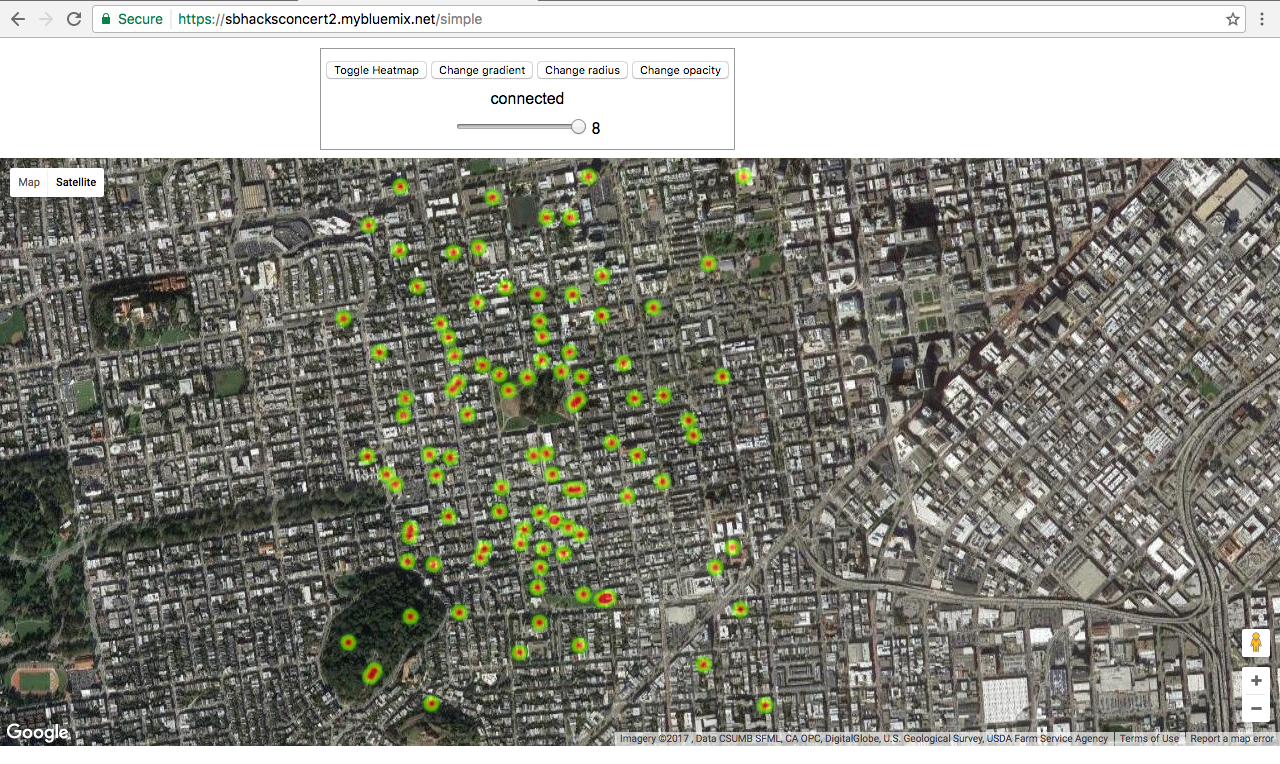
What it does
Gathers realtime location data of people at a large event. Allows event hosts to view a heat map of current and past foot traffic. Hosts can then use this data to:
- Determine and deal with high traffic spots and chokepoints
- Find out which stages or areas of the event were popular/unpopular at what times
- Use this data for future event planning:
- hire artists that attracted large crowds
- reduce risk by dealing with chokepoints in the future
How we built it
- Used IBM Watson IoT platform to gather data from simulated devices which was then stored in a Cloudant NoSQL database.
- Created a Cloud Foundry app using Node-RED and Google Maps API to serve up a visualization to users
Challenges we ran into
- Low memory limitations on free instances of bluemix led to crashes
- Integrating a third party api (Google Maps) into the Node-RED ecosystem.
- Correctly handling websocket messages
- Inconsistent real time arrival of data so maps don't have an equal number of points
- Lack of real world test data
Accomplishments that we're proud of
- Figuring out how to use Bluemix applications and services in synergy
What we learned
- Google Maps API
- Node-Red
- Bluemix
What's next for Crowd Track
- Optimize collection, storage, and retrieval of data to be able to handle thousands of devices concurrently
- Figure out how to collect data from actual devices that have an event app installed
- Display data points on an event map instead of on a bird's eye view of Earth
- Offer Crowd Track as a service and be able to handle multiple clients and events


Log in or sign up for Devpost to join the conversation.