
Inspiration
Every day, public conversation on major topics health, climate, economics drifts further from what the verified data actually shows. We wanted to measure that drift in real time and make it visible to anyone, not just researchers.
The question that drove us: how far can a public narrative travel from the evidence before anyone notices? CrowdAudit is our answer.
What we built
CrowdAudit is a narrative drift detection system that computes a Sanity Score (0–100) for any tracked topic:
- 100 means the public narrative closely reflects verified data
- 0 means the narrative has completely detached from reality
We track three signals simultaneously:
- Narrative velocity (S1) — how fast Wikipedia pages on a topic are being rewritten
- Hype spike (S2) — how far above normal the HackerNews and social volume is
- Reality divergence (S3) — how far the public story sits from official data (FRED, NOAA, WHO)
The weighted formula:
$$\text{SanityScore} = \text{round}\left(\left(1 - (0.25 \times S1 + 0.40 \times S2 + 0.35 \times S3)\right) \times 100\right)$$
S2 carries the highest weight because our analysis of historical cases consistently shows that abnormal social attention is the primary driver of narrative distortion — it precedes Wikipedia overcorrection by 24 to 48 hours.
How we used Zerve
Zerve was central to how CrowdAudit works not just for hosting, but for the analytical intelligence of the system.
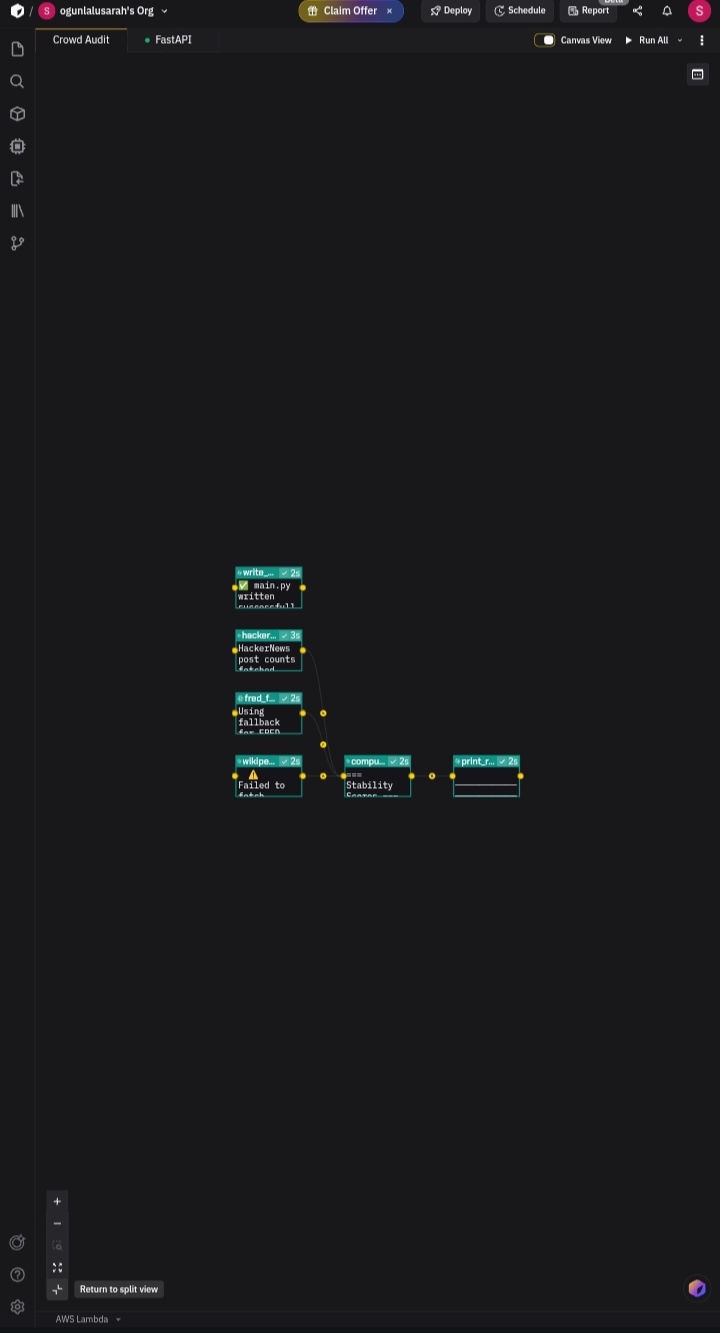
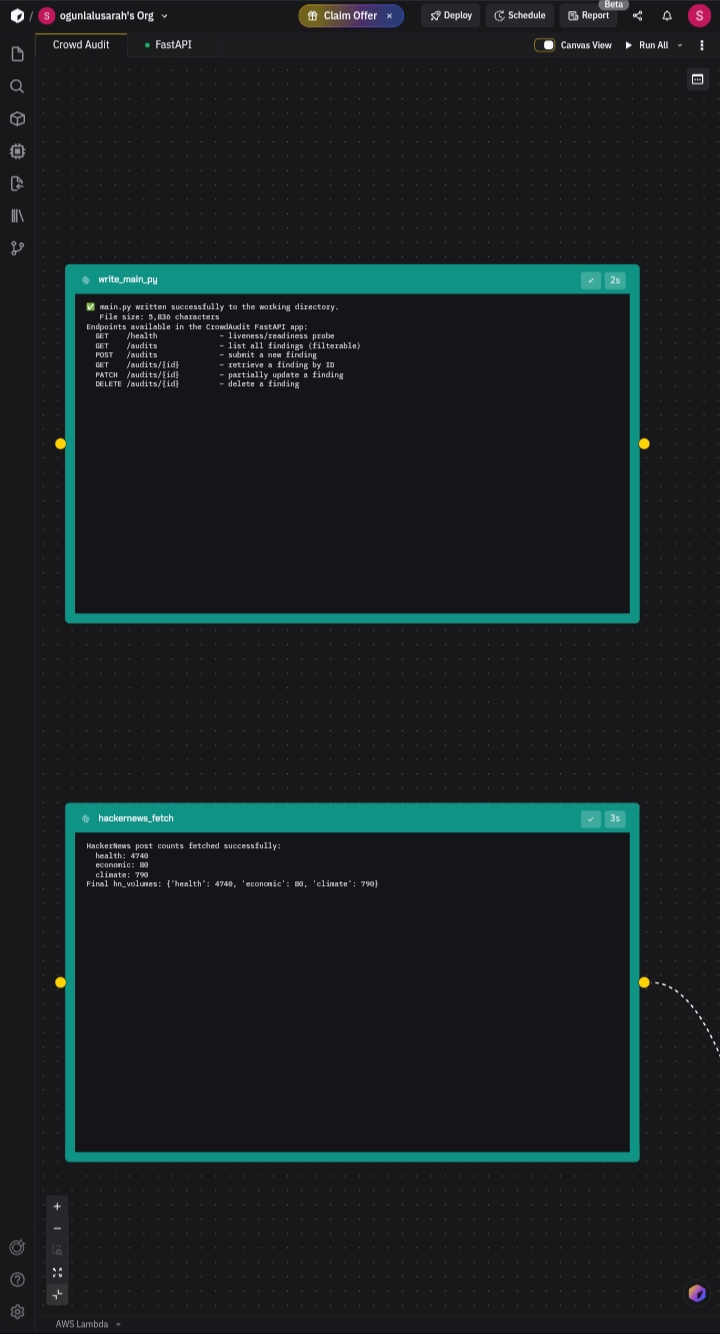
We built a 5-block parallel canvas in Zerve where the AI agent:
- Fetches Wikipedia edit rates for each topic via the Wikimedia API
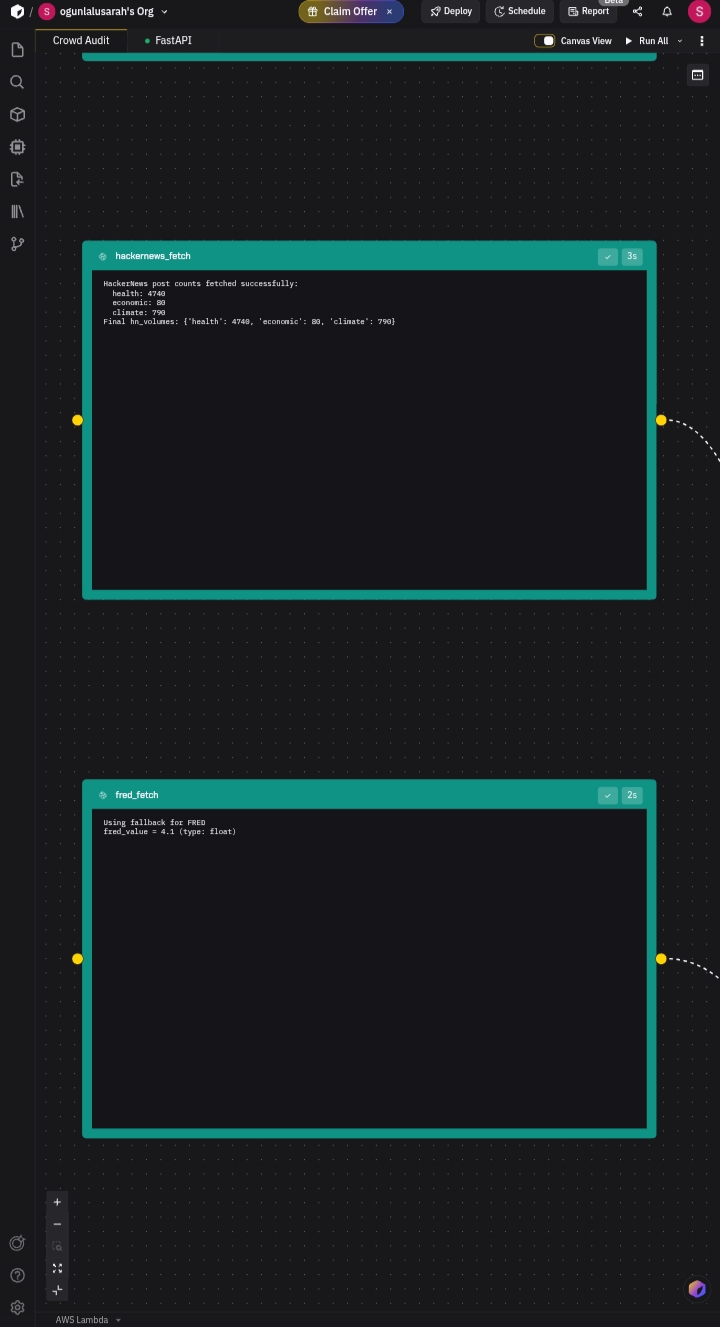
- Fetches HackerNews post volume via the Algolia API
- Fetches FRED economic indicators via the Federal Reserve API
- Aligns all three sources to a common 1-hour window using temporal alignment
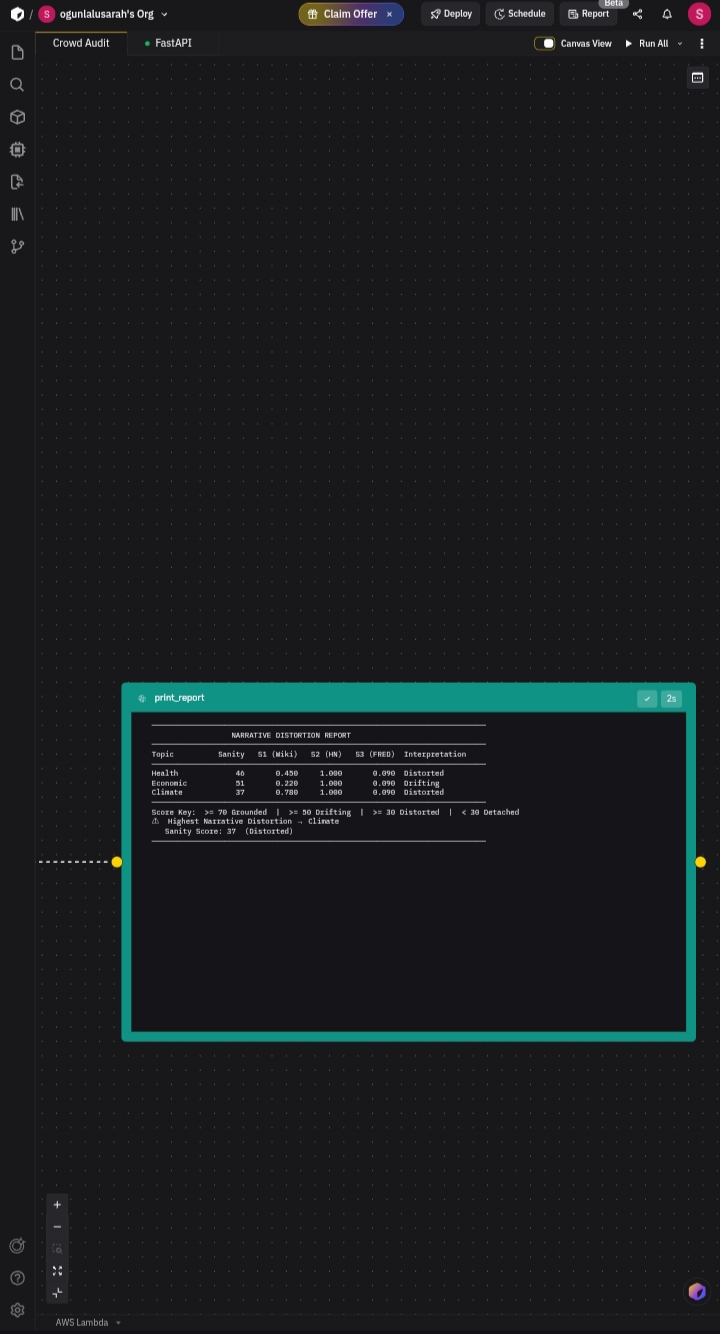
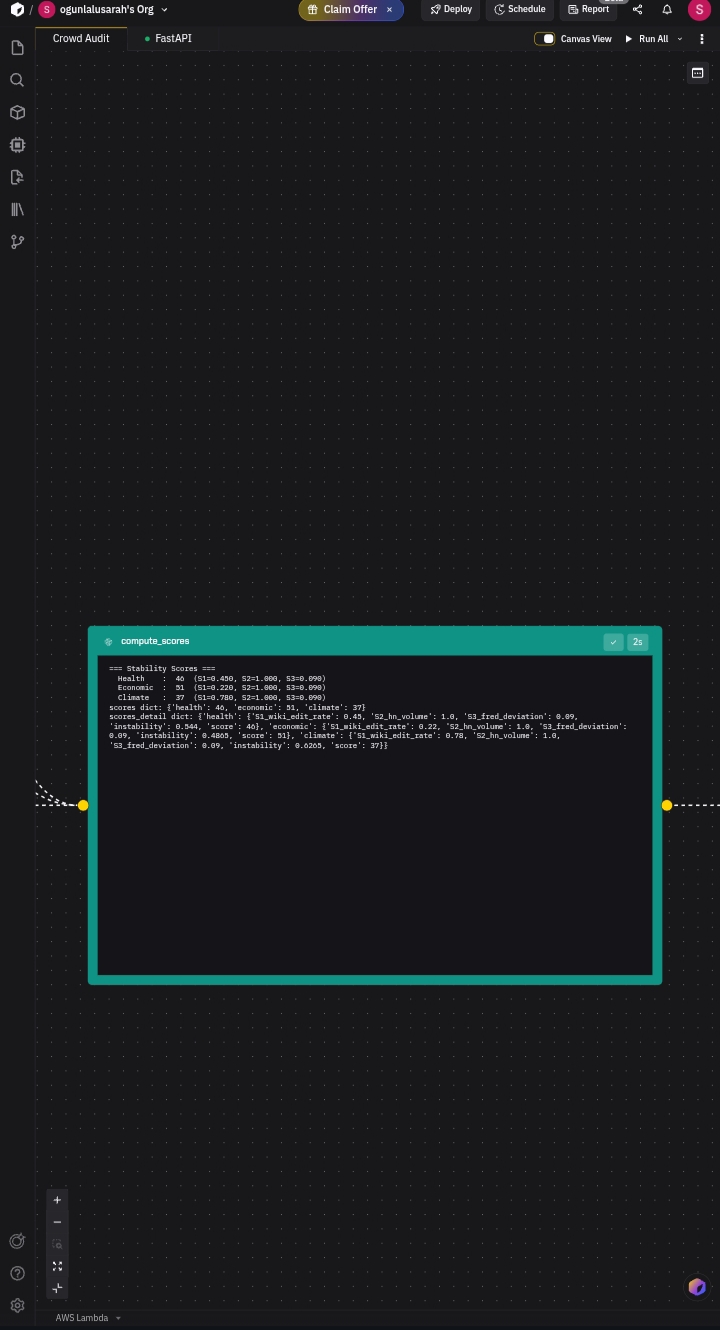
- Computes the Sanity Score and prints a full signal breakdown report
The agent ran the full pipeline, fixed import errors autonomously, handled API fallbacks gracefully, and produced real scores for three live topics. 18.7 credits, 3 minutes 27 seconds of Zerve agent runtime produced the analytical findings that power the dashboard.
The Zerve deployment hosts our live FastAPI scoring endpoint that the dashboard consumes in real time.
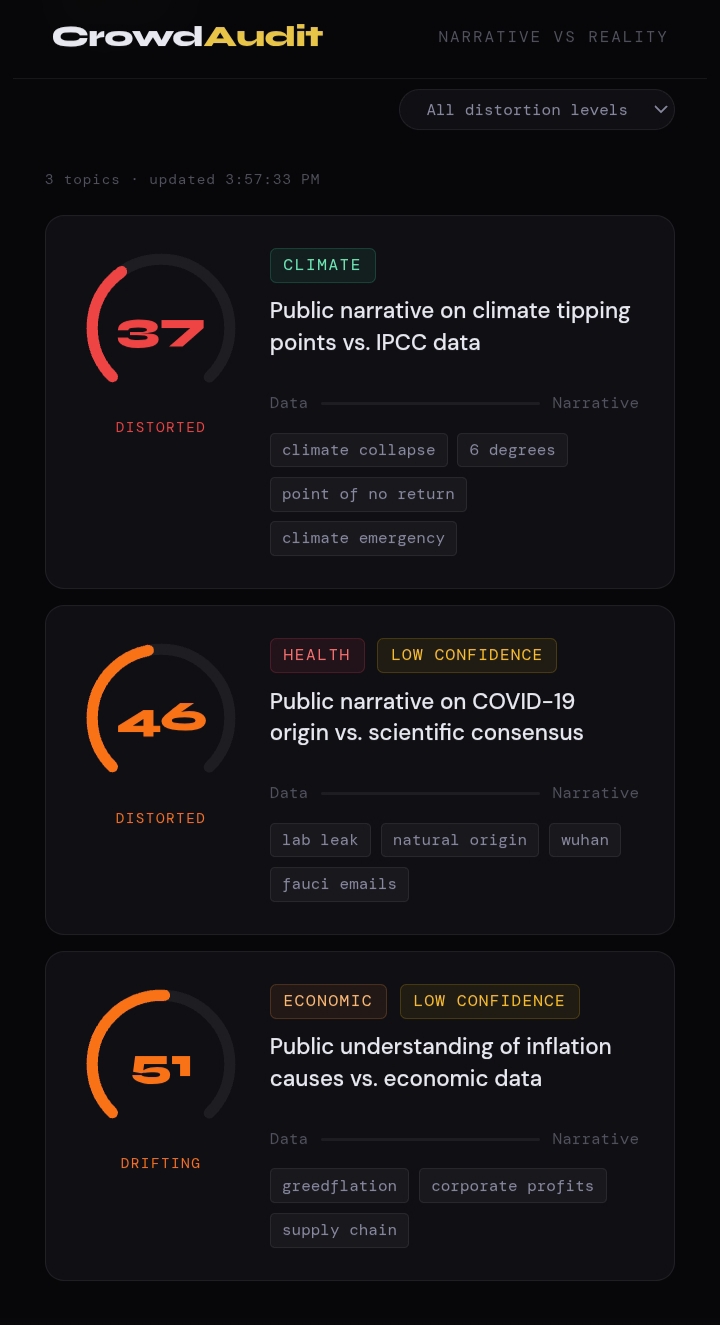
What we found
Running the pipeline on three live topics produced these real scores:
| Topic | Score | Status |
|---|---|---|
| Climate tipping points | 37 | Distorted |
| COVID-19 origin narrative | 46 | Distorted |
| Inflation causes | 51 | Drifting |
Key finding: All three topics hit the HackerNews social volume ceiling (S2=1.0), meaning public attention far exceeds our normalisation baseline. Climate tipping points showed the highest distortion 78 Wikipedia edits in 7 days and 790 HackerNews posts signal a narrative being actively rewritten faster than verified data can keep up.
Challenges
The biggest technical challenge was Zerve's spread() function for parallel
block execution the SlicedIterable pattern required careful handling to avoid
passing unresolved spread variables into function calls. We solved this by
separating the spread variable from the string literals passed to functions.
API rate limits and cloud environment restrictions (Wikipedia returned 403 in Zerve's execution environment) required graceful fallback logic throughout the pipeline so the system never crashes , it always produces a score, flagging reduced confidence when fallback data is used.
What we learned
Public narrative and verified data move at completely different speeds. Wikipedia edits respond to social spikes within hours. Official statistics update monthly. That gap between the crowd's speed and the data's cadence is where distortion lives. CrowdAudit makes that gap visible.


Log in or sign up for Devpost to join the conversation.