-
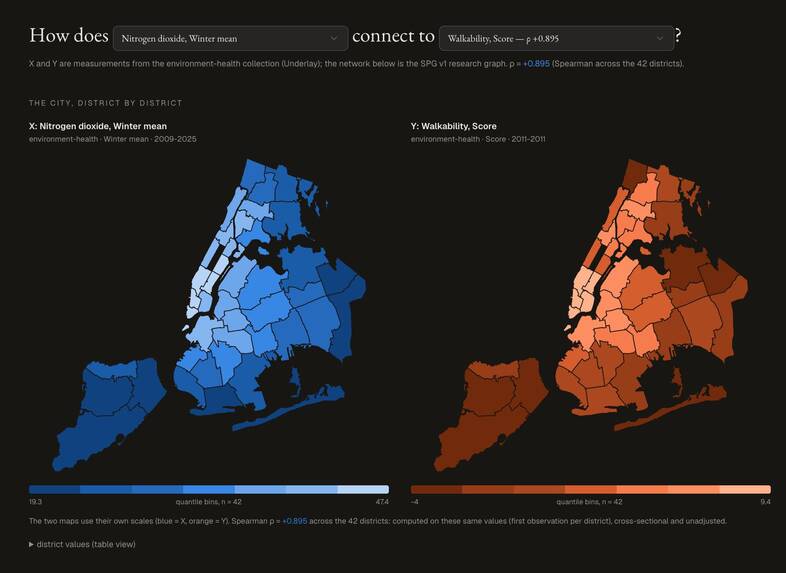
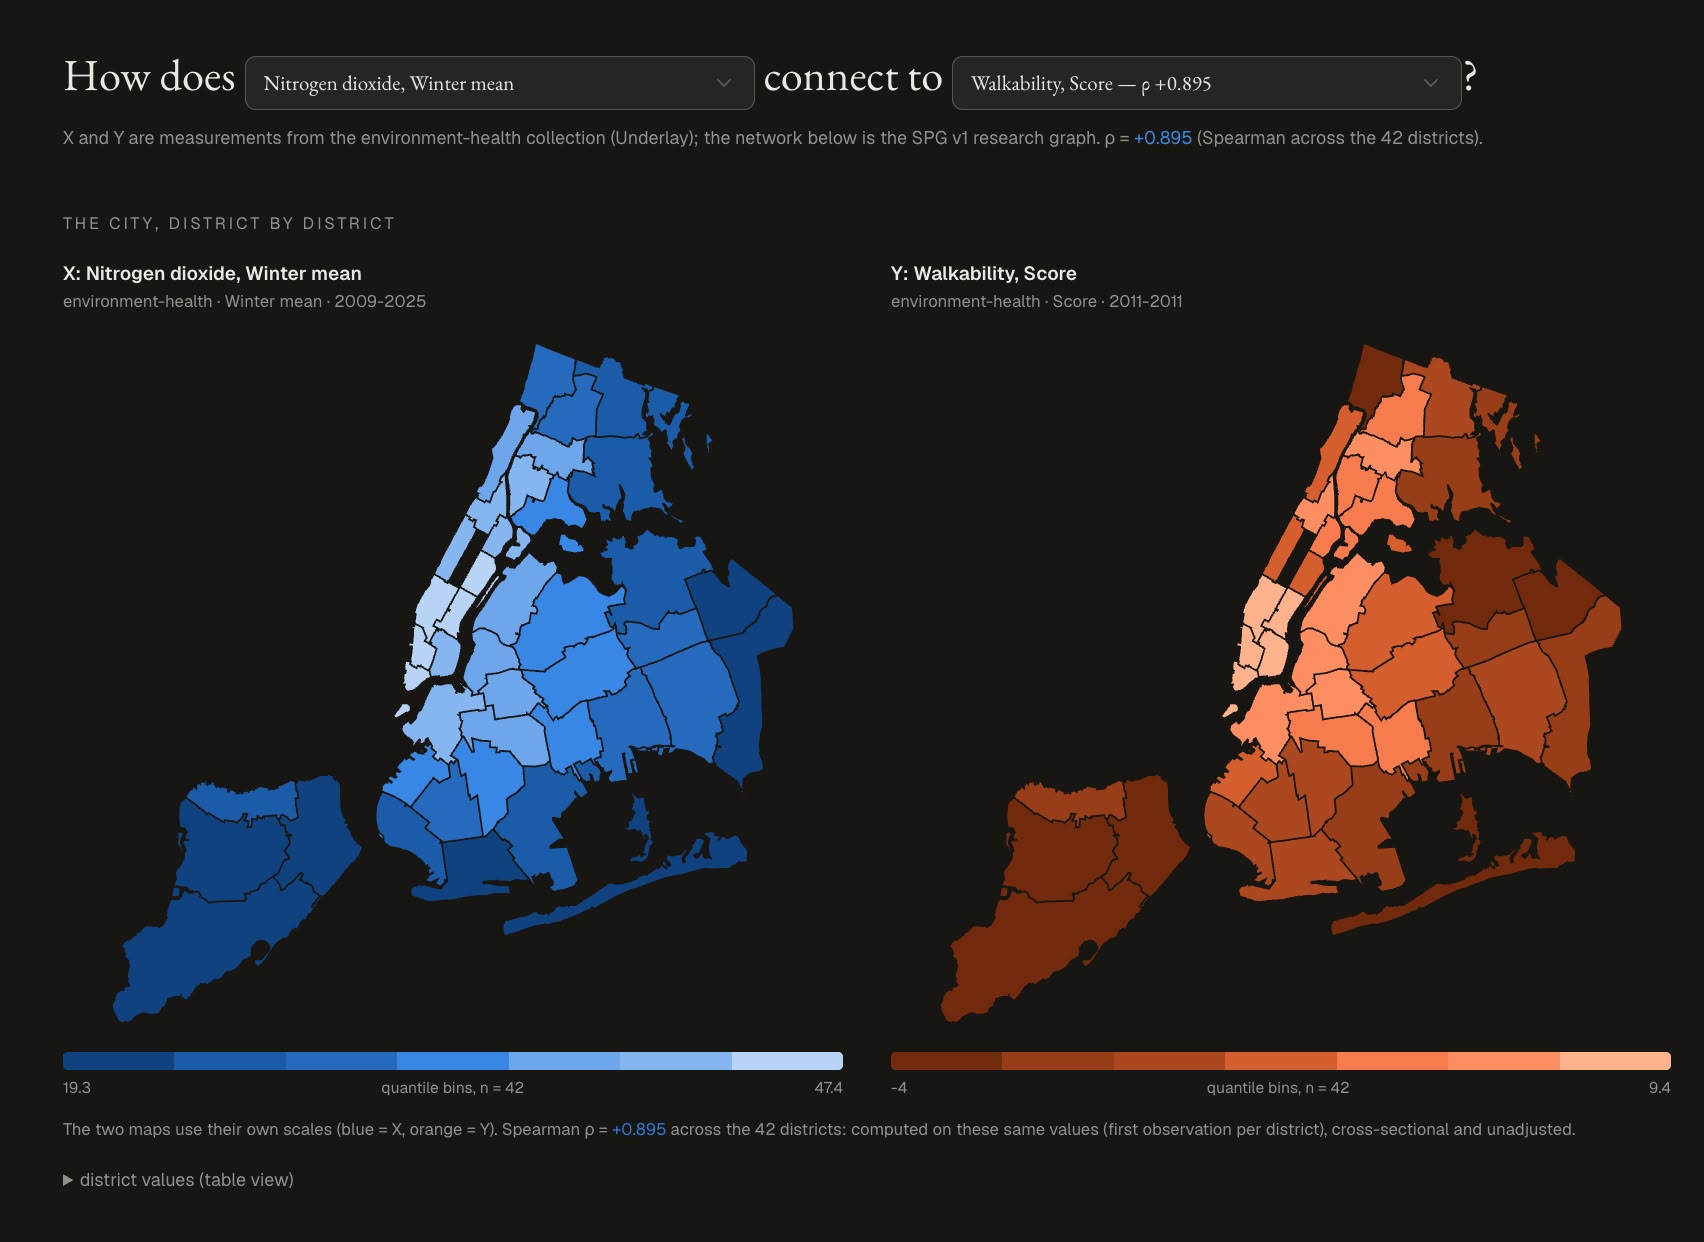
District wise correlations visualized
-
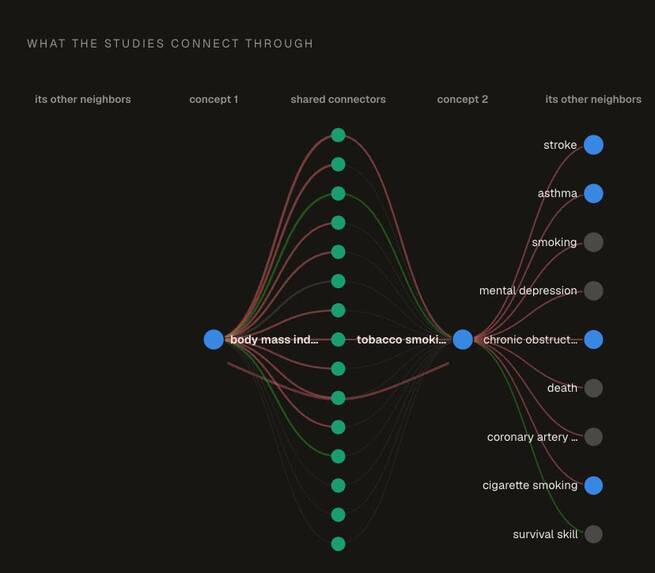
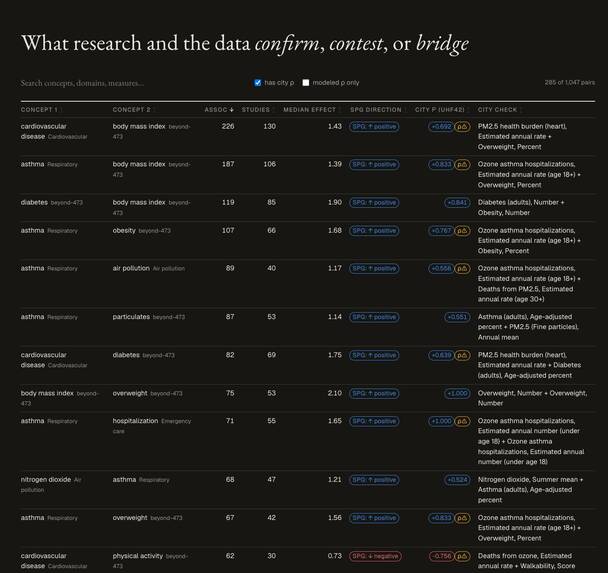
Confirmations visualized on the graph
-

References provided with links
-
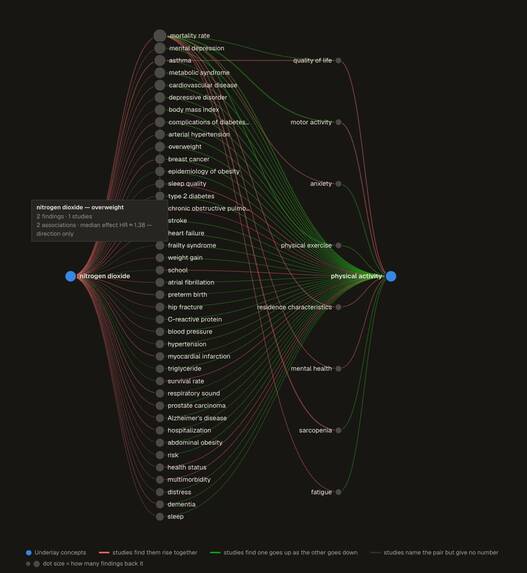
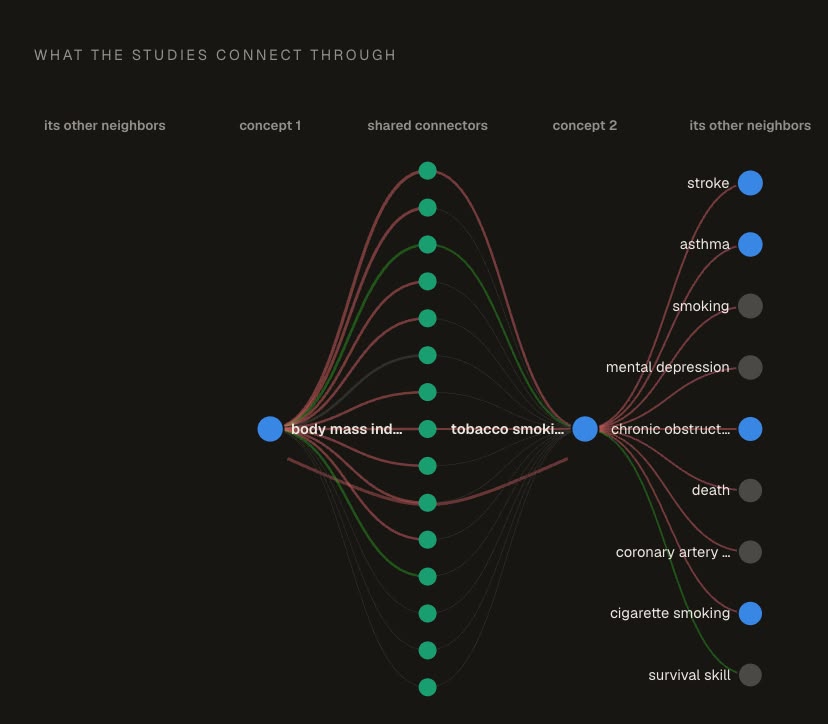
Bridge connections linked
-
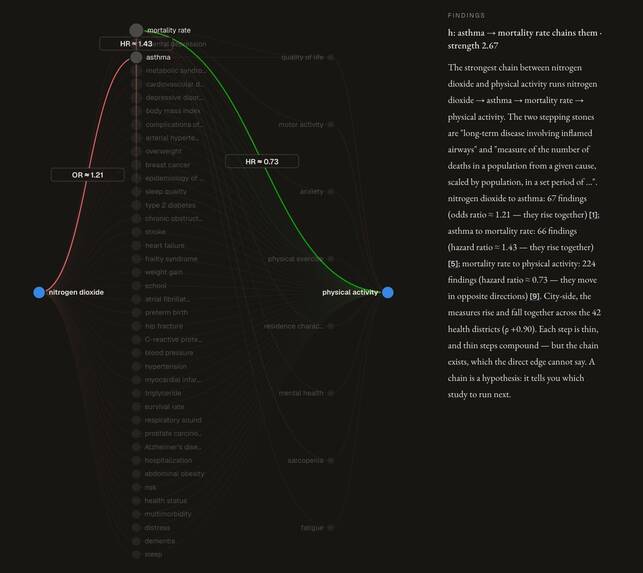
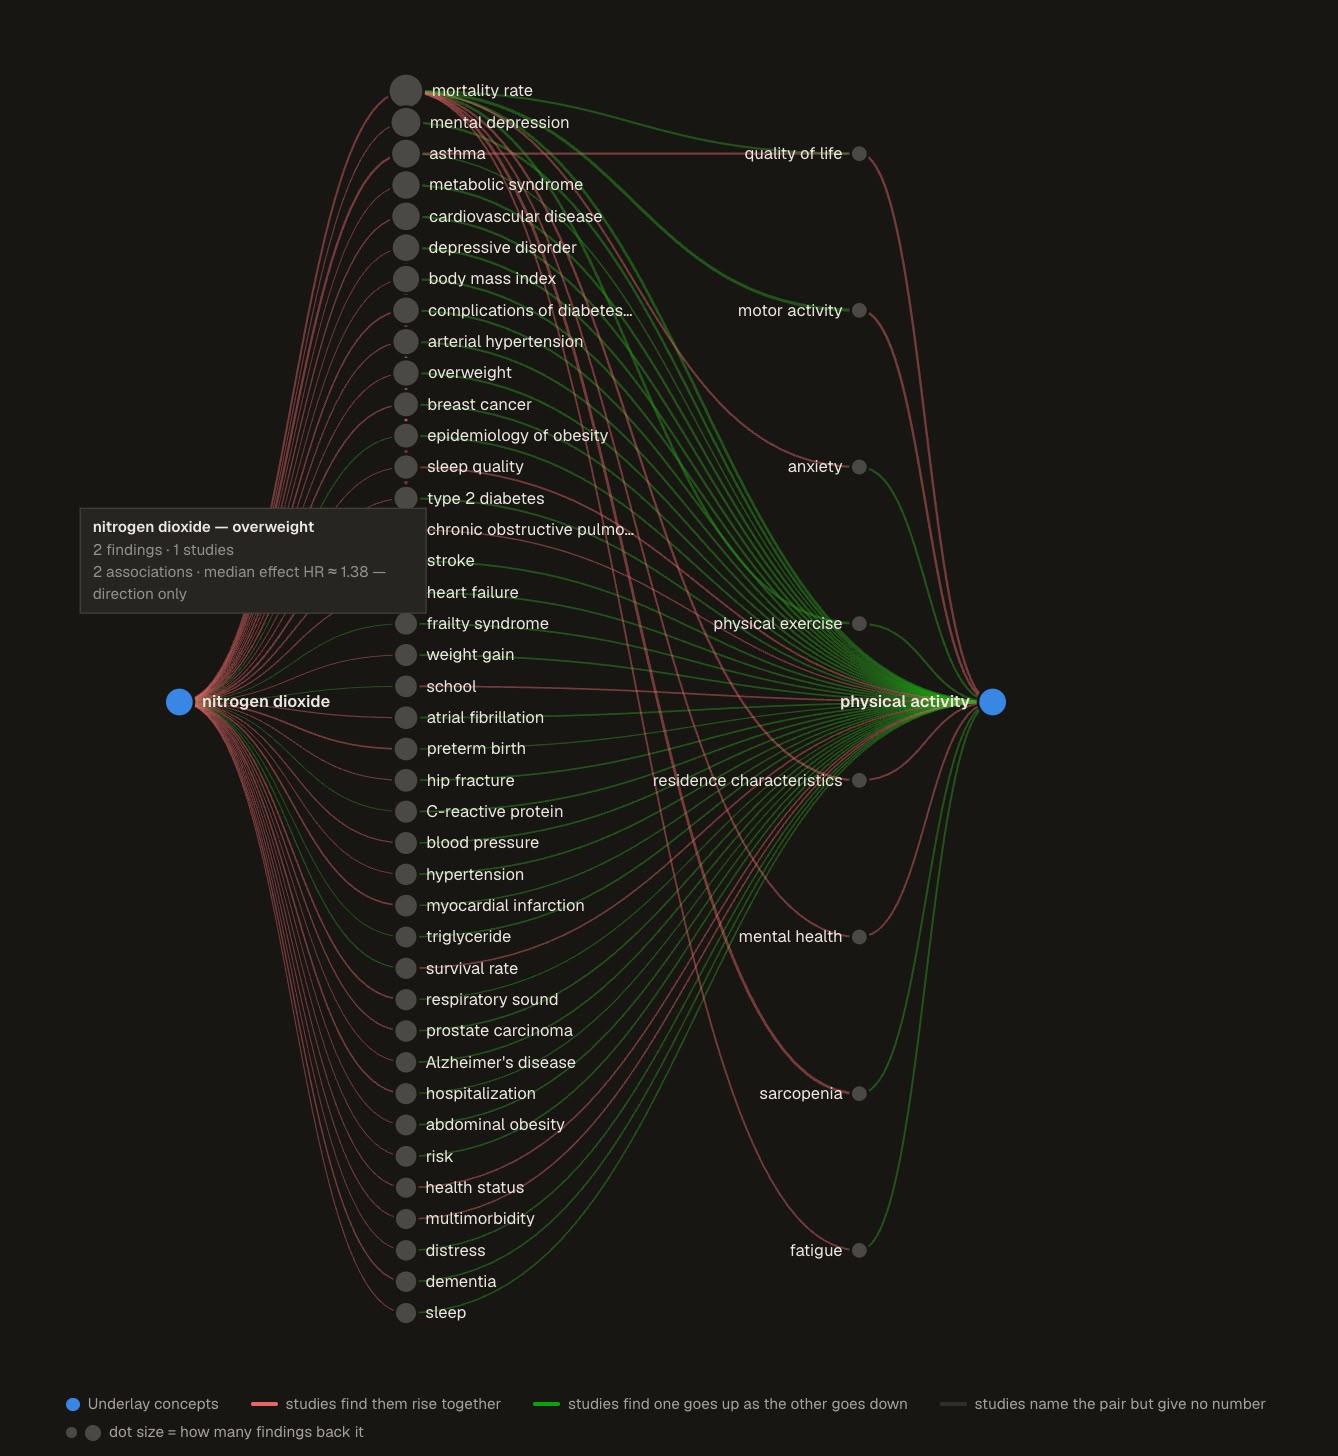
Possible paths between bridges are highlighted with hypotheses
-
Confirmations: Where System Public graph and NYC data agree

🌳📊 When research meets city data
Build Challenge 4 · Knowledge Futures: what can published research and New York City's own data confirm, question, and connect together?
💡 The idea
The System Public Graph knows what science has found: millions of effect estimates extracted from published papers, tied together as a graph of concepts. New York City knows what is actually happening on its streets: 500,000+ health measurements, every heat complaint, every tree. These two speak completely different languages: one in research constructs and odds ratios, the other in survey percentages and monitor readings. And they had never been introduced.
We built the introduction, and then the conversation.
The project has three layers. First, a dictionary: a concept map matching what the city measures to what research studies, with every match typed, scored, and explained. Second, an analysis: with the dictionary in place, three questions become askable: where do research and the city agree, where do they disagree, and what links emerge only when you put them together. Third, a dashboard: one offline HTML file where every answer can be explored, with each claim traceable down to a specific measure, a specific study, and a specific dataset version.
🔍 What we found
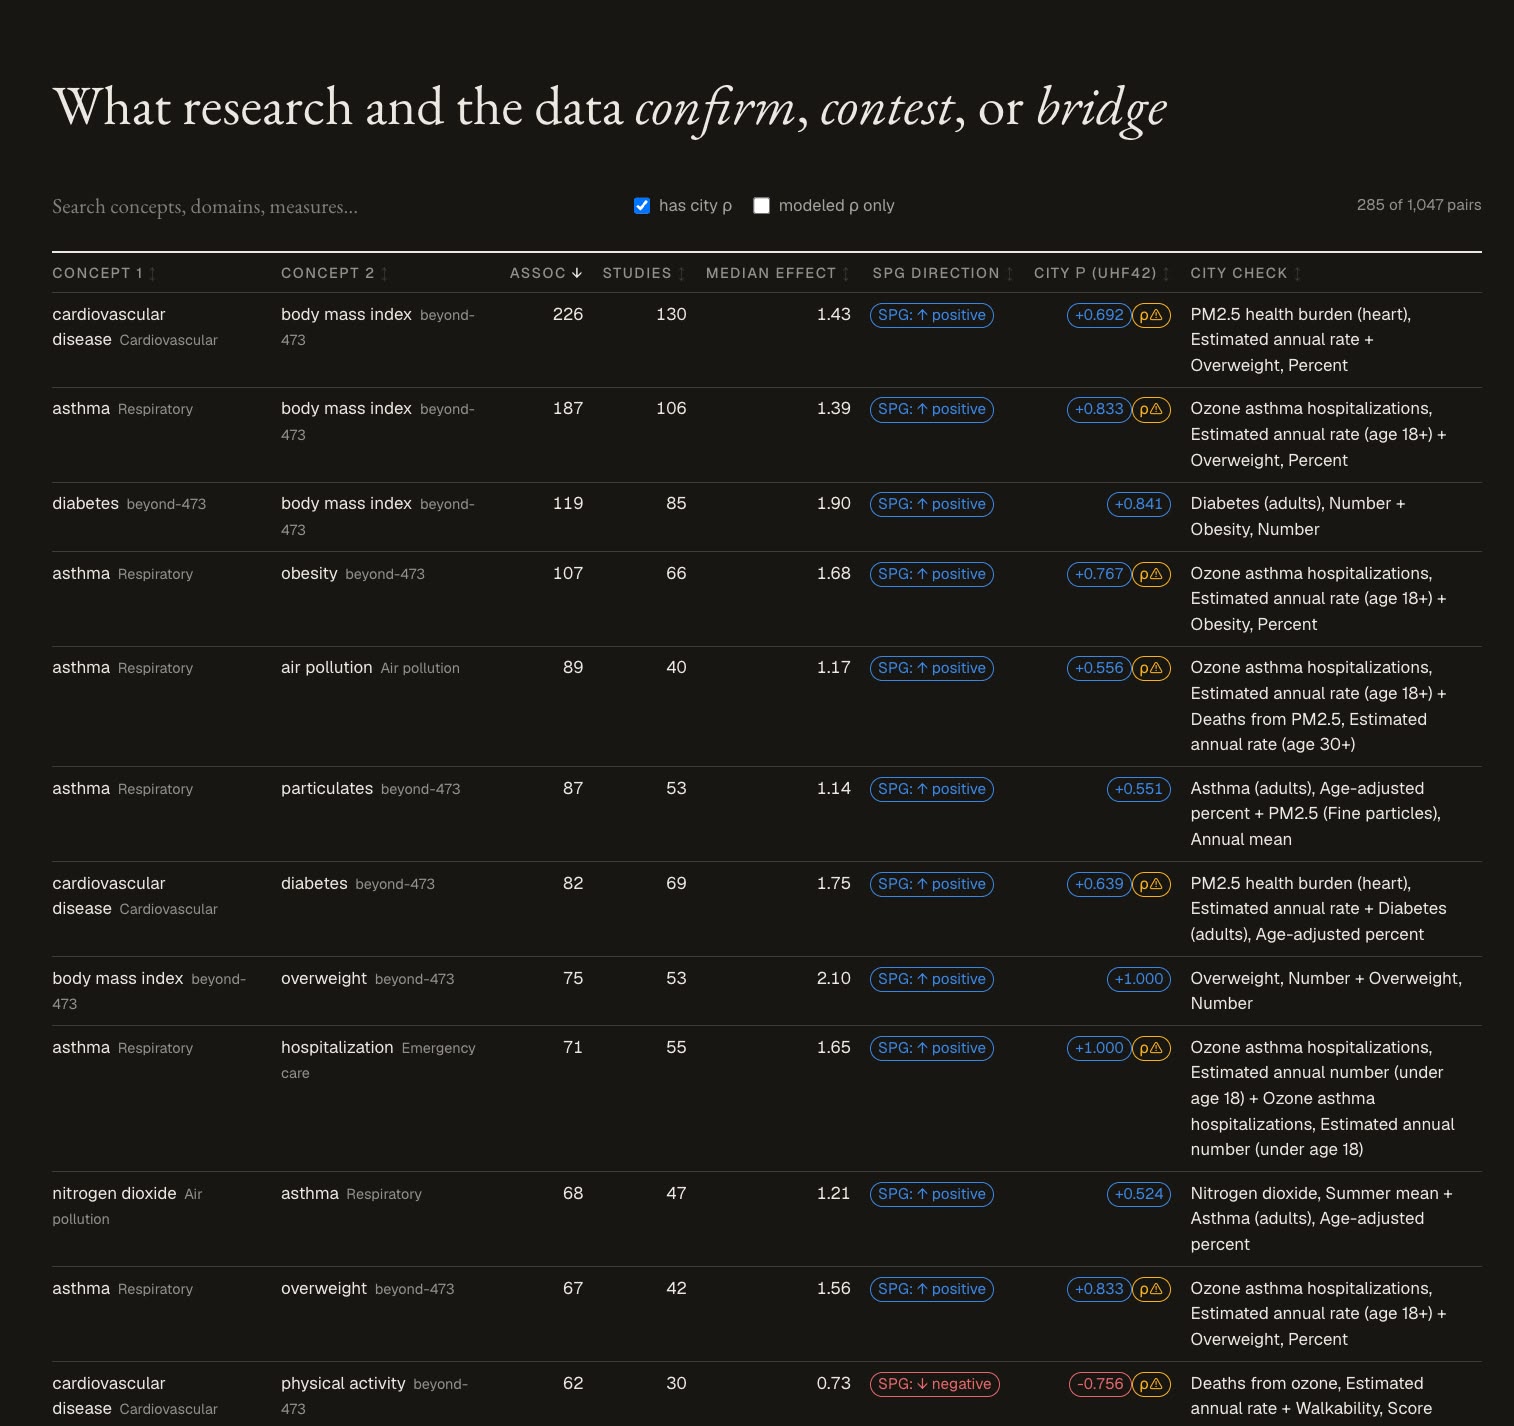
Confirmations. Once translated, most of the picture agrees. Districts with more obesity have more diabetes, just as the literature says; air pollution and asthma move together; 115 pairs point the same direction in both datasets.
Disagreements. 26 pairs point in opposite directions. Some are artifacts worth knowing about: the city publishes "% of homes without a smoke-free policy," which flips the sign against a research concept about the policy itself. Others are genuine questions: fine particles are associated with cardiovascular disease across 45 studies in the literature, yet across New York's districts the correlation runs negative: the dense, well-resourced districts where monitors read the highest PM2.5 also show the least heart disease. A reminder that neighborhood-level patterns are not individual-level truths.
The bridge that started it all. Trees cool streets; heat sends people to the emergency room. Research documents the second link thoroughly: heat-related hospitalizations rise, and from there it is a short hop to emergency-department visits. NYC's satellite data documents the first: neighborhoods with more vegetation cover have cooler surfaces (ρ = −0.40). But the direct link (does tree cover keep people out of the ER?) appears in neither dataset. The graph has zero associations between green space and emergency care; the city's own correlation is a flat 0.02. Each dataset holds half of the chain; only together do they assemble a connection neither contains.
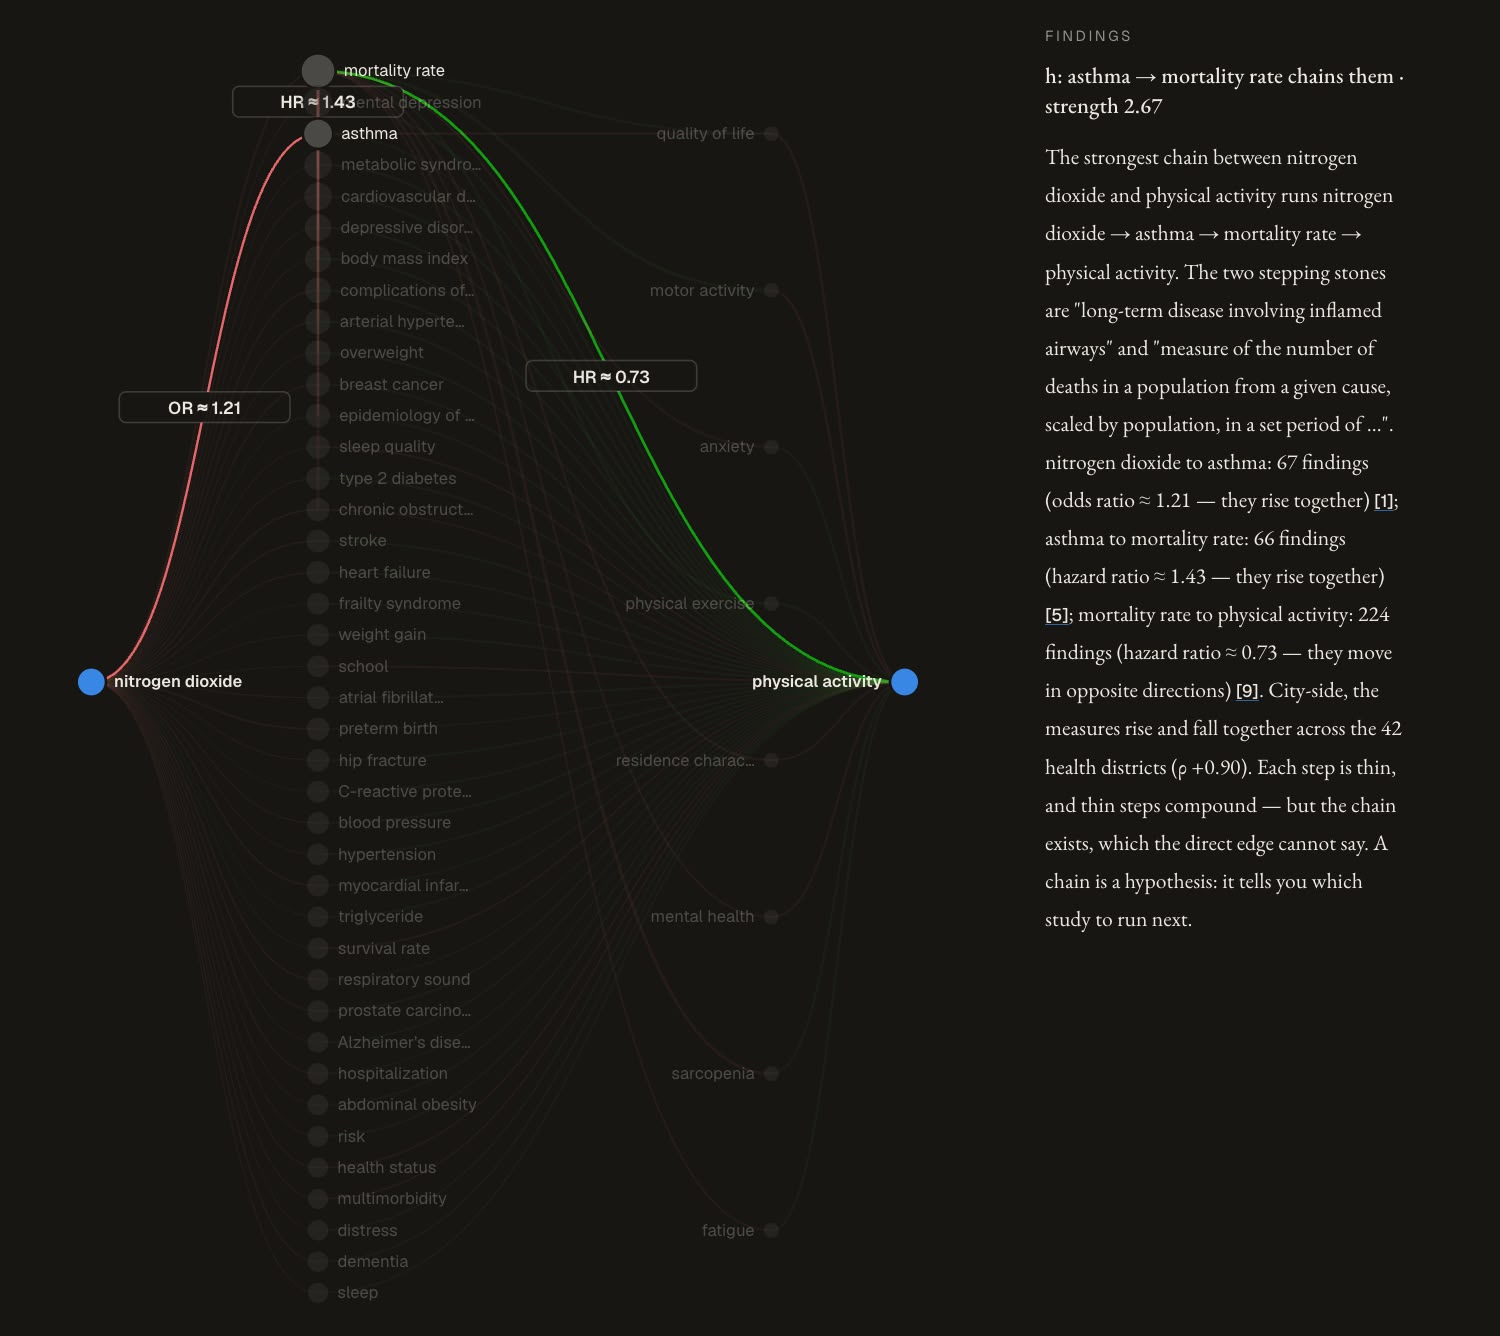
Bridges: correlations looking for an explanation. That became our definition. A bridge is a correlation NYC's data shows between two concepts the research graph never directly connects. Finding one is only half the work. The other half is asking the graph why: which researched mechanisms could produce this correlation? For nitrogen dioxide × walkability (ρ = 0.90 across districts), the graph has no direct link either way, but it knows each half separately: NO₂ with asthma and mortality, physical activity with heart disease and depression. Those documented paths turn "these two numbers move together" into a concrete hypothesis: urban density is plausibly driving both. When we generalized the search, the two datasets produced hundreds of such assembled explanations. Our favorite: obesity leads to asthma in 88 published studies; asthma correlates with dying before age 65 at ρ = 0.94 in NYC data, and the direct link obesity → early death does not exist in the research graph at all.
🛠️ How we built it
We profiled both sides first, then worked in three steps.
The dictionary. An LLM pass matched the graph's 473 challenge-relevant concepts against every concept NYC publishes, choosing a match type (same thing, broader/narrower, related component), a confidence, and a written reason for each: roughly 400 matches, each reviewable. Wikidata's ICD-10 codes anchored the death causes exactly; everything else went through semantic matching with every borrowed identifier verified against the deposit.
The checks. For every matched pair we computed the Spearman correlation of the two measures across New York's 42 health districts, and inferred which direction the literature predicts from the majority sign of its effect estimates. Same direction → confirmation; opposite → contested.
The bridges. After proving the direct edge is absent (zero relationships, zero associations), we read the graph's paths as candidate explanations for each city correlation. In a second search, we assembled chains where one hop is a documented research edge and the other hop is carried entirely by NYC data, with no graph evidence for it at all: links the graph could never have produced on its own.
The SPG plays four distinct roles in all of this: its associations are the evidence side of every confirmation; its relationship edges draw the neighborhood maps around each concept; its verified absences define the bridges; and the concepts it never covers become the research-needs list.
🧗 What was hard
The graph's concepts are the specific entities that appeared in study variables, not clean medical categories: "heart disease" is there, but there are no disease codes, and keyword matching on descriptions famously pulls cardiac valve "vegetations" into green space. Granularity kept biting us: a relationship with 70 studies pooled across a whole domain can be a single study for the one concept pair you actually need. NYC quietly mixes measurement kinds: observed counts sit next to model-produced "attributable burden" numbers, which have research effect sizes baked inside them, so correlating with them can't independently confirm anything (every such check is flagged on the dashboard). Measure names invert their own concepts. And through it all, hub concepts like "mortality rate" connect to thousands of others, so every graph search needed gates that keep the hub from connecting everything to everything.
🎓 What we learned
The core lesson is about what a correlation is worth. A correlation in a dataset is a whisper, not a finding: poverty and air-conditioning ownership correlate at ρ = −0.87 across New York's districts, but a correlation is shaped by everything else going on in those neighborhoods (income, age, density, housing stock), and on its own it cannot tell you which of those is doing the work. By itself, it's weak.
The System Public Graph is what turned those whispers into something more useful. When two correlated variables each had researched connections, the graph's paths suggested why they might move together, and which shared factors to check first: asthma's documented ties to pollution and old housing made the asthma–poverty correlation legible; the chains around walkability pointed at urban density as the driver shared with NO₂. Every assembled chain came with a candidate explanation attached, and every gap in the graph came with a flag saying this hypothesis is genuinely new and nobody has tested it.
That reframed the rest of what we learned. Absence is information, but only once you verify it: a missing edge, checked and confirmed empty, is what separates "no one has connected these" from "we forgot to look." Typed matches beat binary ones: "related but broader" is a different claim than "equivalent," and the confirm/contest/bridge analysis inherits the difference. Disagreement is a deliverable: the 26 contested directions and the flat correlations aren't failures, they're the research agenda. And provenance is what makes any of it reviewable: every claim in the dashboard resolves to a dataset version, a concept, a measure, and a study, because a comparison between two datasets is only as good as your ability to point at exactly which rows of each it rests on.
🔁 Reproduce
python3 -I mapping/build_side_tables.py    # dictionary inputs (~4 min)
python3 -I insights/build_connections.py   # confirm / contest / bridge (~6 min)
python3 -I dashboard/build_dashboard.py    # dashboard (~8 min)
open dashboard/out/index.html
Sources: SPG v1 (Dataverse deposit) and NYC Open Data on Underlay v1.0.0 (environment-health, leading-causes-of-death, heat-complaints, street-trees). Every dashboard row cites the exact dataset versions it rests on.
Built With
- python
- underlay
