-
-

Enabling Search for SDGs - SDGs
-

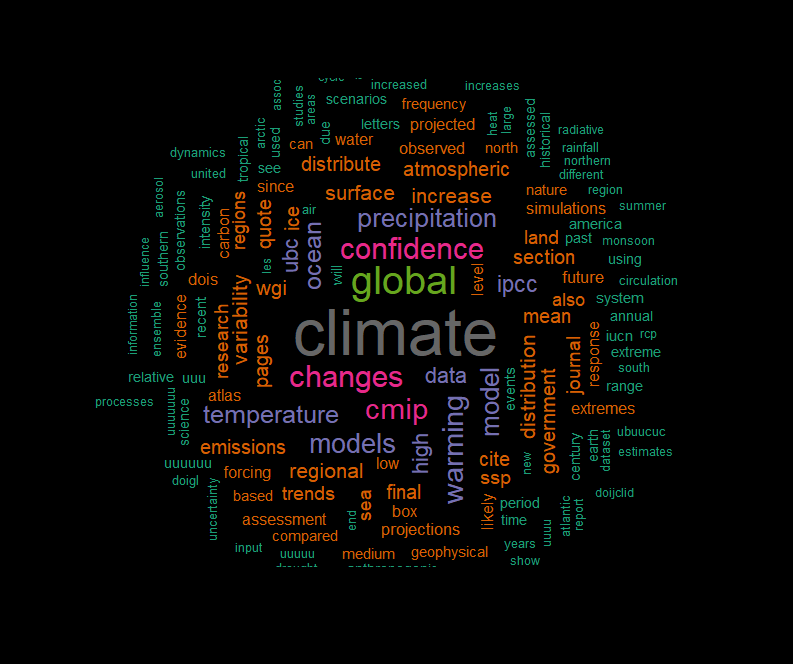
Enabling Search for SDGs - Word Cloud
-

Enabling Search for SDGs - Schema
-

Enabling Search for SDGs - SDG Word Count
-

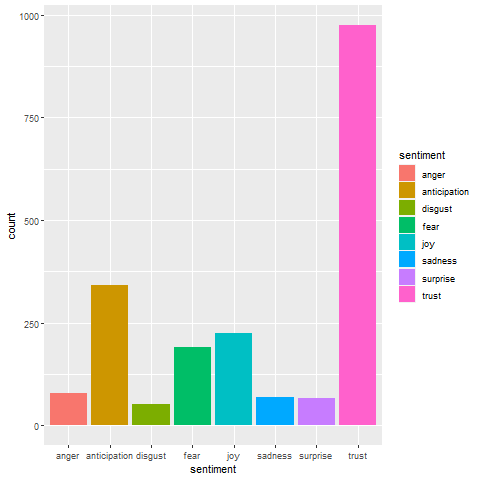
Enabling Search for SDGs - Sentiment Analysis


Enabling Enabling “Smart” Search for SDGs
Inspiration
UN Sustainable Development Goals are very broad: across domain, region, timeline, and audience. Information reporting about them is equally broad, with sources being wide and disparate, and often in pdf format. Being able to find actionable insights (and getting it to the right people) is a challenge that technology (data/text mining, natural language processing, graph database, graph-based search) can help with. With end-users being policy makers, investors, researchers, and also concerned citizenry, the inspiration for this project is to make complex and often overwhelming information easier to understand, use, and act upon.
What it does
The general workflow demonstrated by this project is:
- Data Collection (pdf reports)
- Data Structuring & Pre-Processing (R/Python pdf scraping)
- Feature Extraction (R/Python text mining, sentiment analysis, NLP)
- Graph Schema Design & Data Association (Tigergraph Studio)
- Graph-Based Query & Search (Tigergraph/GSQL/pytigergraph Tools)
How we built it
Phase 1 - Initially, a manual process was involved in this project - downloading a variety of pdf reports from a variety of organizations, and creating an index of these documents.
Phase 2A - Once a data "store" of these documents is created, a few R/Python scripts automate the process of scraping, structuring, and extracting useful information from the documents. Demonstrated in this project are the extraction of SDG, country, continent, and sentiment specific content; although other customizable type of feature extraction could easily be employed.
Phase 2B - The graph schema design phase relies upon the desired features being extracting - the primary nodes are the raw content and index of the documents, and SDG, country, continent, and sentiment counts and statistics, and the primary edges are the relationships between these features across the docuemnts.
Phase 3 - Output csv files are generated from 2A, which are then associated to the nodes/edges of 2B, using the Tigergraph Studio tool.
Phase 4 - Finally, pytigergraph and GSQL scripting is used to develop and install useful queries. Visualizations of the structured data features and graph queries are available in the R, Python, and Tigergraph Studio environments.
Challenges we ran into
The project was planned with a phased approach - first focusing on what the end-user(s) would like to be able to search within the documents, and building upon that through each aspect of the above workflow. The main challenges were:
A) structuring "unstructured" text data from the pdf documents B) ensuring the feature extraction results would be compatible with a graph based schema, without losing any valuable information.
An iterative approach was taken to overcome these challenges always keeping the end-user in mind, being able to start small, and eventually scaling fast.
Accomplishments that we're proud of
A soup-to-nuts solution is presented here that addresses the problem statement. The solution is both extensible AND scalable. While complex behind the scenes, the end-user experience is clear, simple, and reliable. The solution is also modular, allowing for future customizations.
What we learned
We learned about the advantages of graph databases, the capabilities of Tigergraph environment and toolset, and the power of the GSQL language. We also learned quite a bit about NLP techniques and working with unstructured or semi-structured data.
What's next for Crosstalk
Actively addressing UN SDGs are an important part of the future of this world, and this solution supports a the deployment of a tech solution that can increase positive impact at a faster rate. We hope to extend this solution approach by getting feedback from potential users, add new desired features and capabilities, and further enhancing our graph schema, queries, and visualizations for improved actionable insights.


Log in or sign up for Devpost to join the conversation.