Inspiration
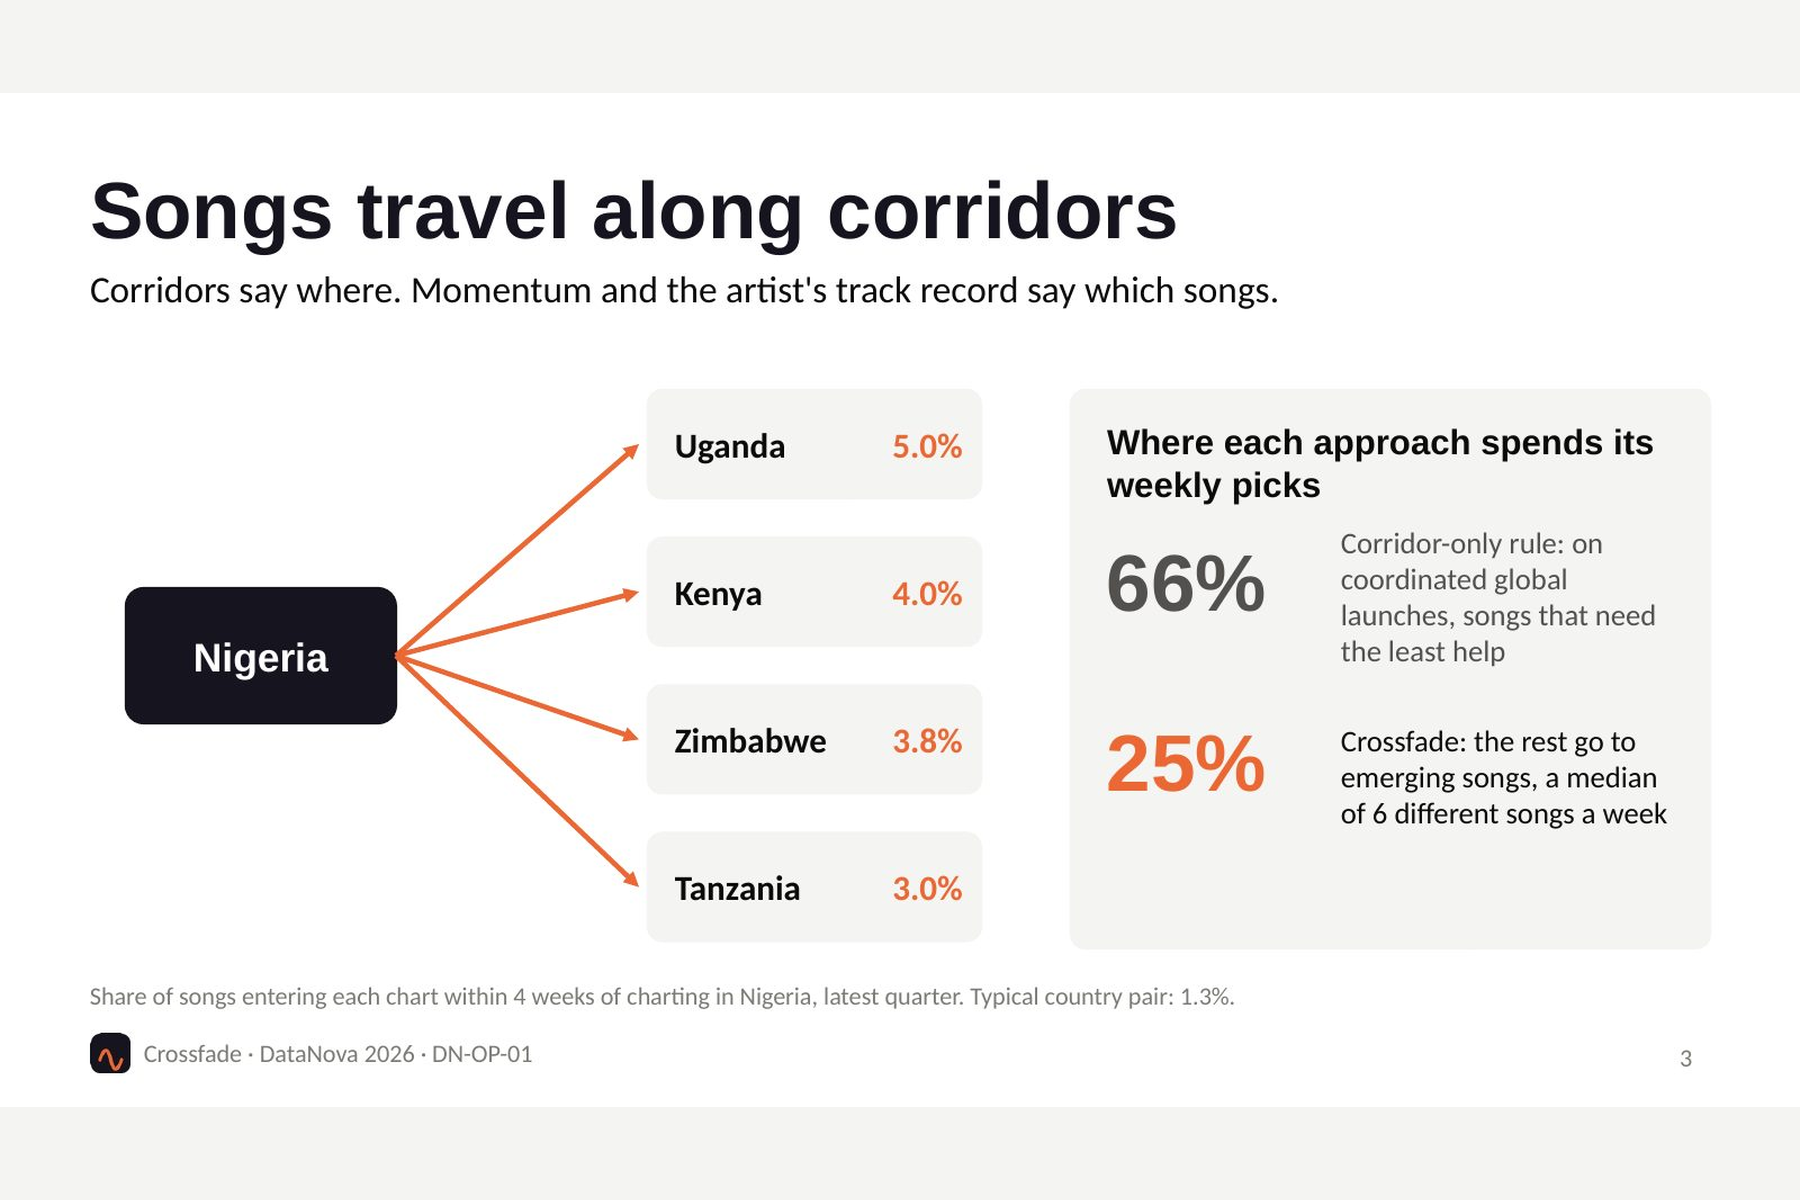
Afrobeats and amapiano hits don't spread at random. A song that breaks in Nigeria often turns up in Uganda, Kenya or Tanzania weeks later. But the teams deciding where to push a song (distributors, labels, managers) can only work a handful of markets a week, out of 43 national charts, and they mostly choose by gut feel. I wanted to see whether eight years of public chart history could tell them where each rising song is heading next, and how sure to be.
What it does
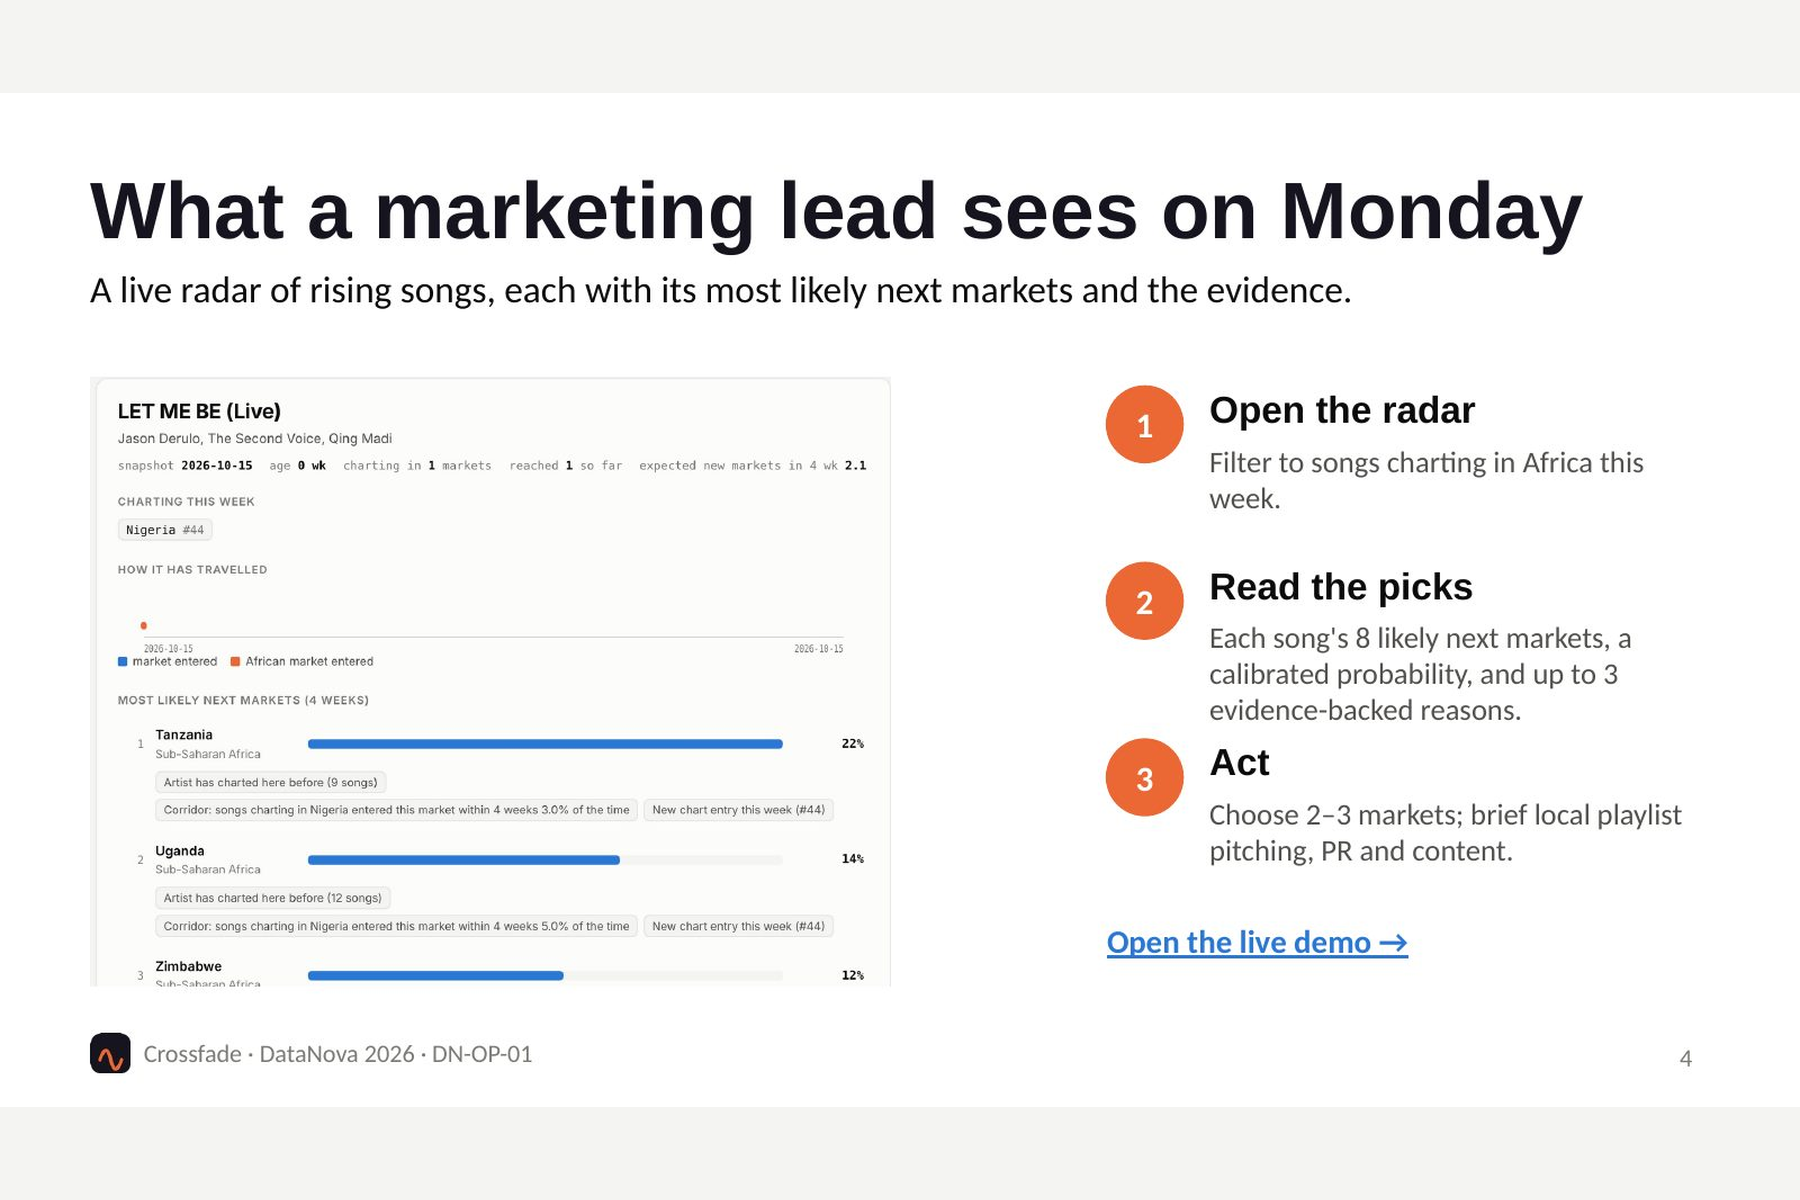
Crossfade is a weekly next-market radar for African labels and distributors (problem statement DN-OP-01, Open Innovation). For every rising song it ranks the countries the song is most likely to chart in over the next four weeks. Each pick has a calibrated probability and up to three plain-language reasons, such as "Corridor: songs charting in Nigeria entered this market within 4 weeks 3.0% of the time" or "Artist has charted here before (9 songs)". Users can then aim local playlist pitching, PR and content where momentum is already heading.
The demo has four views: a live radar for the 15 Oct 2026 chart week, a backtest that puts predictions next to what actually happened, a corridor explorer, and a model-and-method page.
How I built it
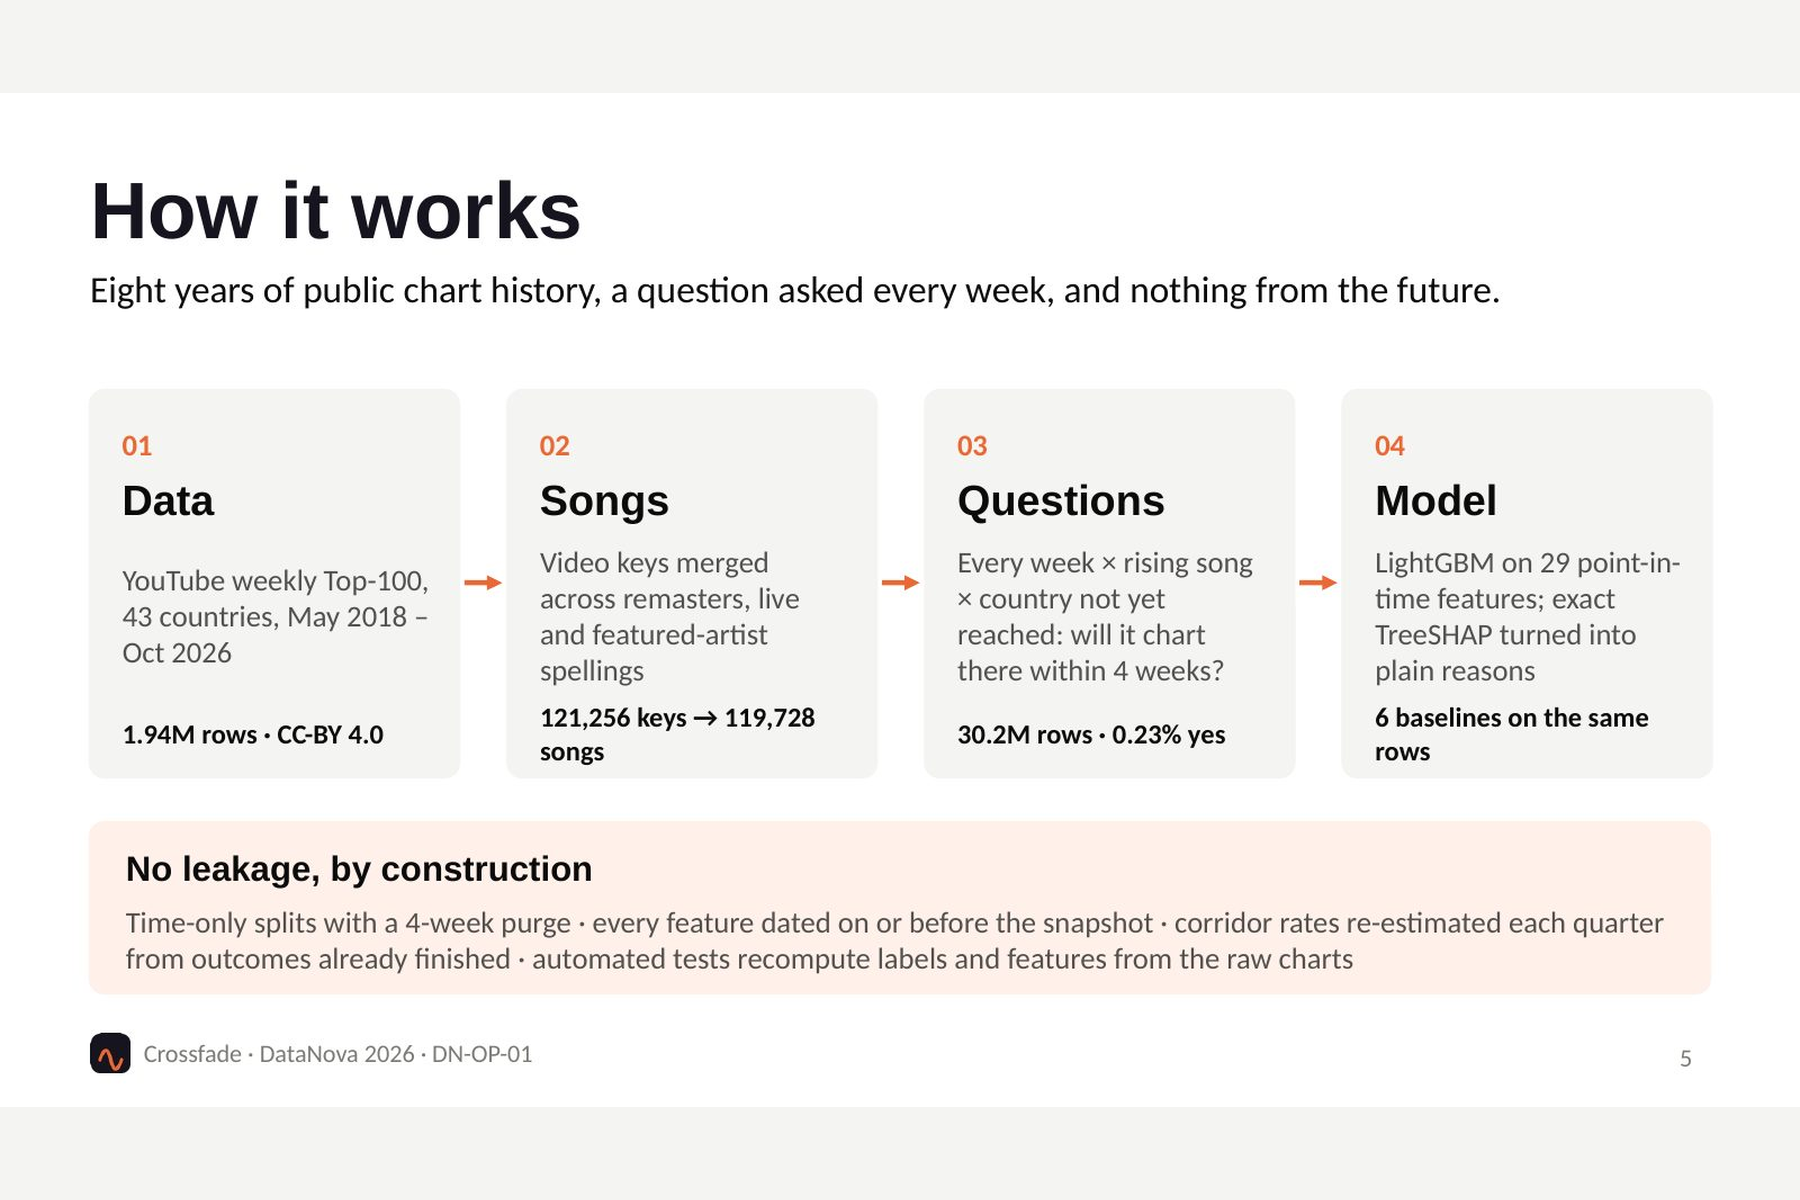
- Data: YouTube weekly Top-100 charts for 43 countries, May 2018 to Oct 2026. That's 1.94M rows from Zenodo record 23644526 (CC-BY 4.0), checked against MD5 checksums and audited for gaps and duplicates.
- Song identity: 121,256 video keys normalised into 119,728 songs, merging remasters, live versions and featured-artist spellings.
- The question: for every week, every rising song (at most 26 weeks old) and every country it hasn't reached, will it enter that chart within 4 weeks? That's 30.2M candidates, of which 0.23% are yes.
- No leakage:
- Every feature uses only data dated on or before the snapshot week.
- Country-to-country corridor rates are re-estimated each quarter, using only outcomes that had already finished.
- Automated tests recompute labels and features from the raw charts.
- Model: LightGBM on 29 features (song momentum, corridor strength, regional and language proximity, how open the market is to imports, the artist's track record there). Explanations come from exact TreeSHAP.
- Evaluation:
- Walk-forward validation on 2022, 2023 and 2024.
- A final test on Jan 2025 to Sep 2026, scored once.
- Six baselines scored on exactly the same rows.
- Stack: Python, DuckDB, pandas, scikit-learn, pytest, and a single-file HTML/JS demo, all on free tools.
Results (held-out Jan 2025 to Sep 2026)
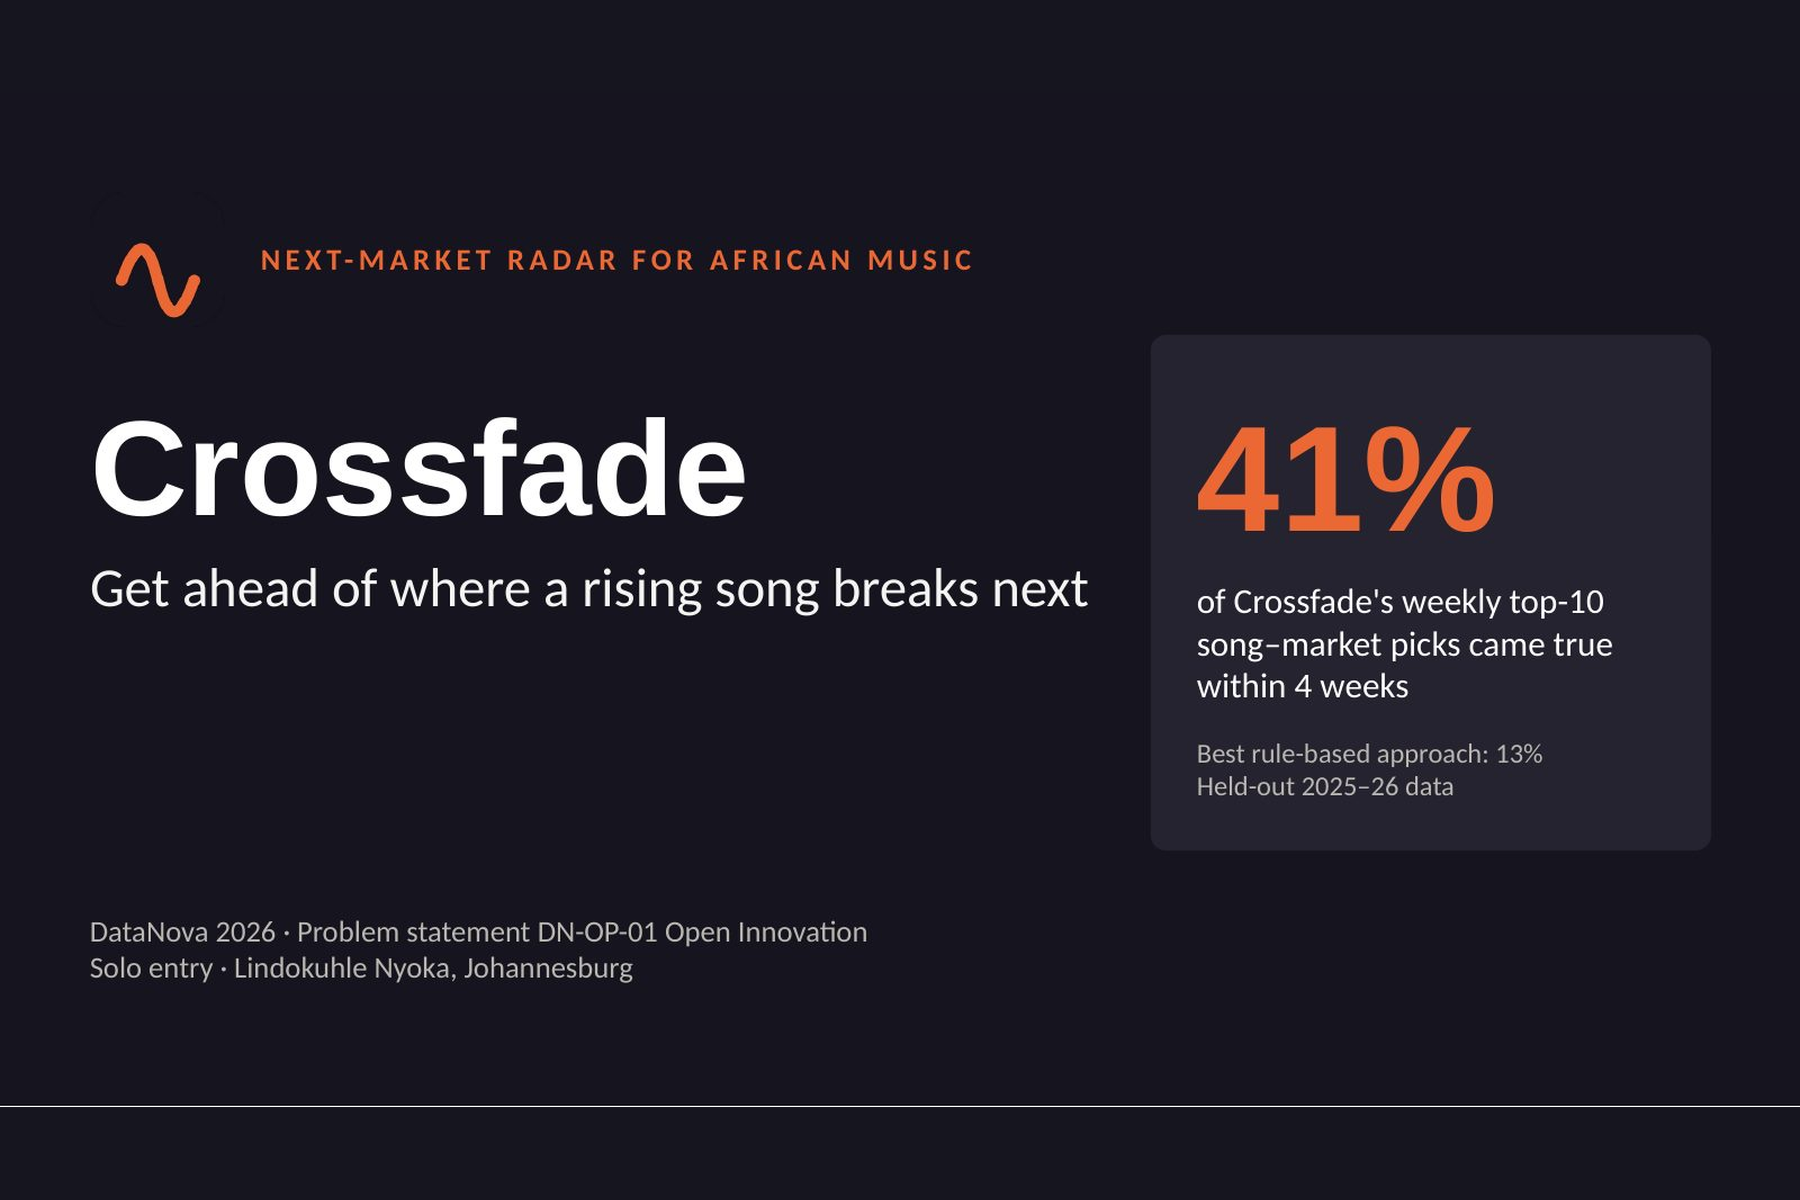
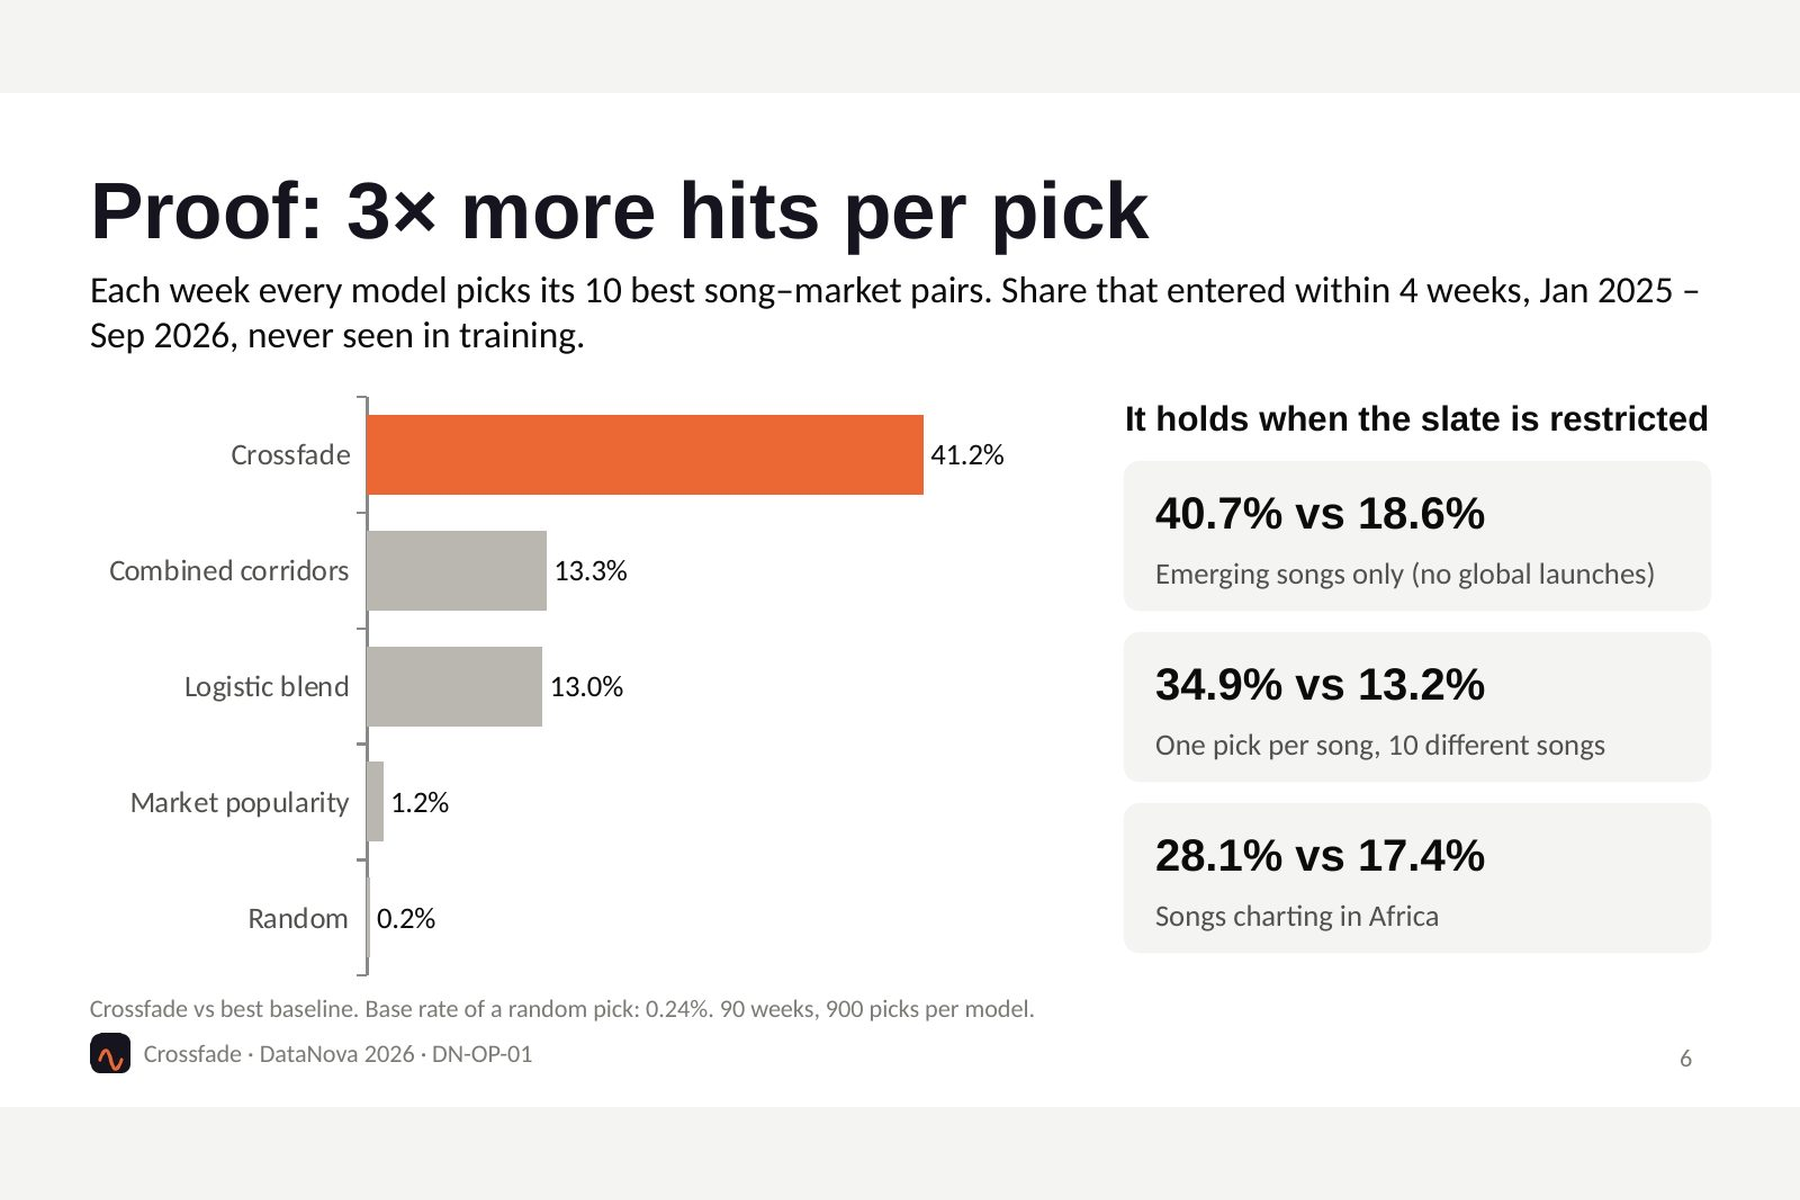
- Weekly slate: of each week's top-10 song-market picks, 41.2% entered within 4 weeks, against 13.3% for the best baseline. A random pick has a 0.24% chance.
- Restricted slates still hold:
- Emerging songs only: 40.7% vs 18.6%.
- One pick per song: 34.9% vs 13.2%.
- Songs charting in Africa: 28.1% vs 17.4%.
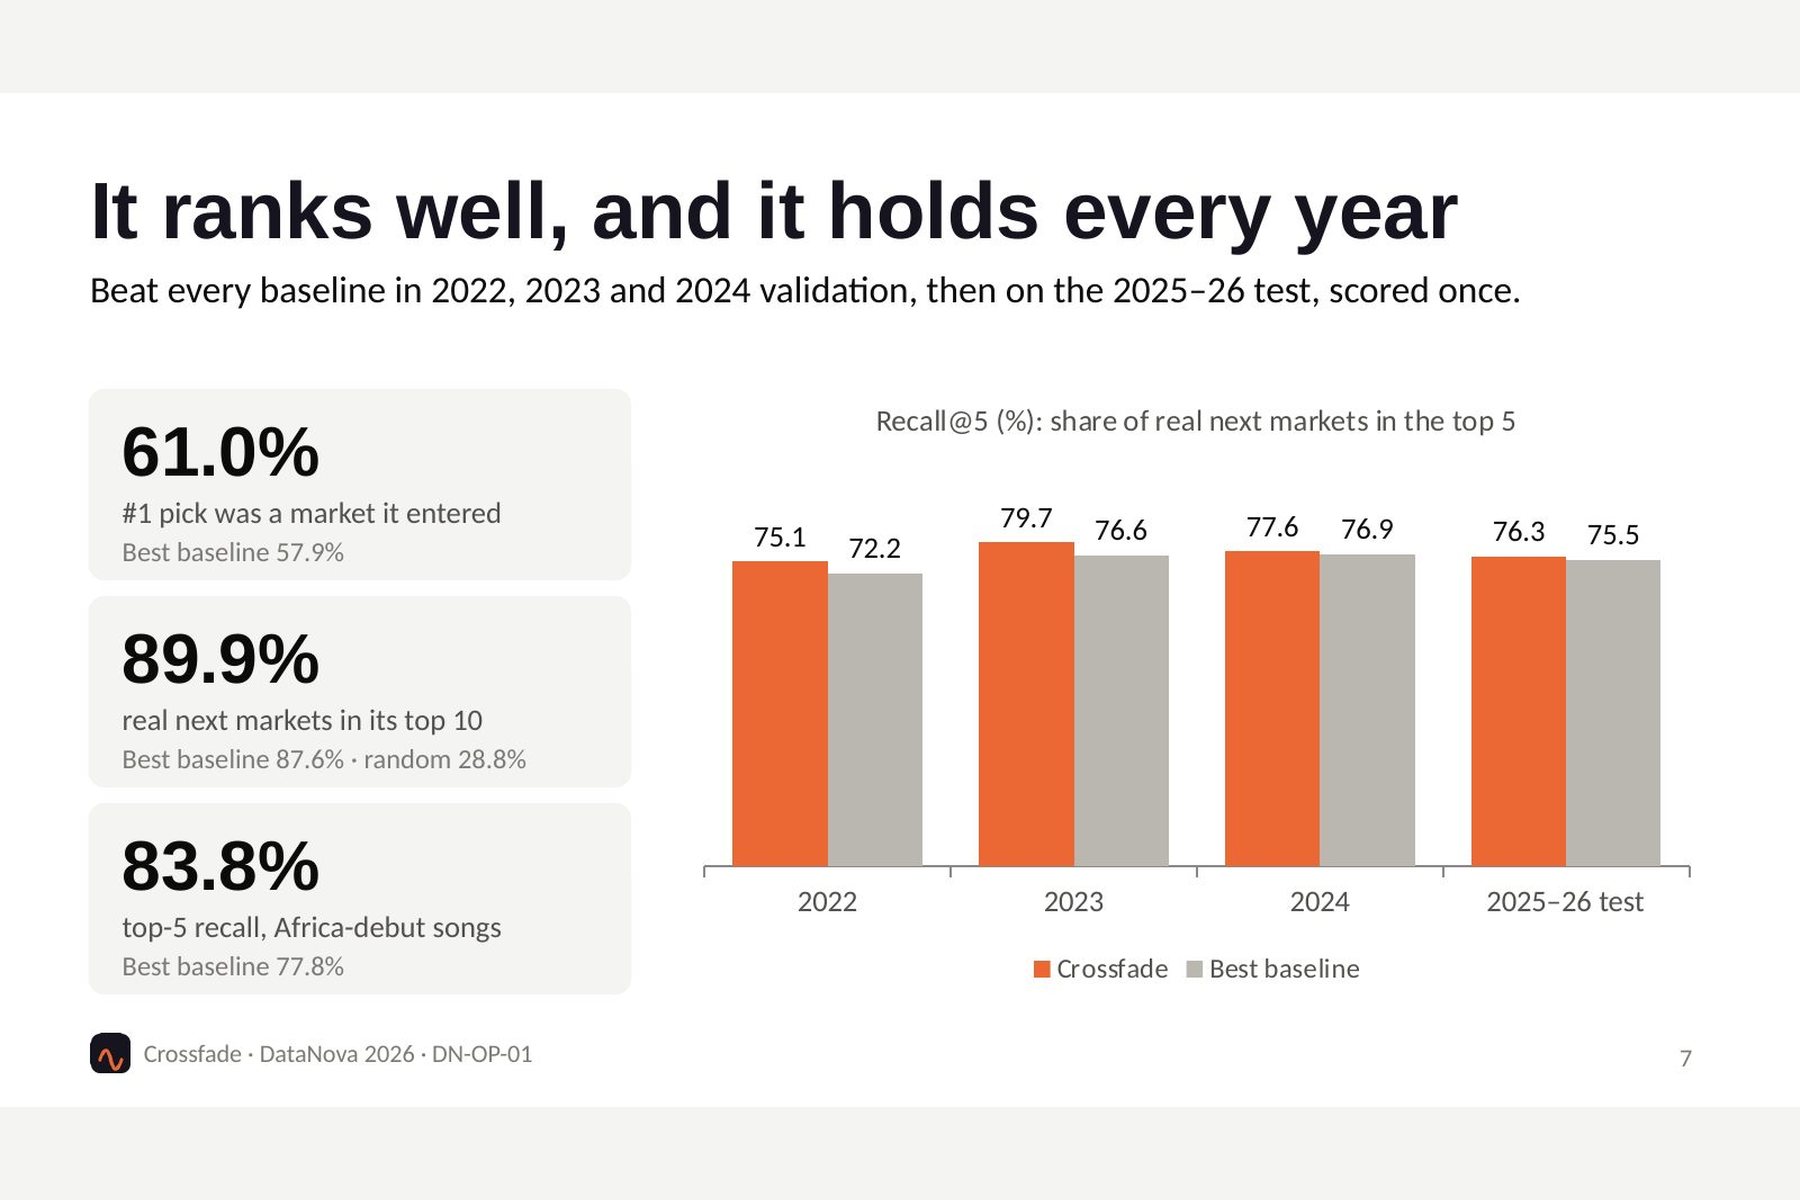
- Ranking each song's markets: the #1 pick was right 61.0% of the time (best baseline 57.9%), and 89.9% of real next markets were in its top 10 of 43.
- Songs that debuted in Africa: top-5 recall of 83.8% vs 77.8%.
- Calibration: expected calibration error of 0.019 percentage points, so a 20% really means about 20%.
- Consistency: it beat every baseline in all three validation years.
Challenges
- A misleading first result: an early version reported an 8.58% positive rate and an 85% headline accuracy. Both came from bugs: counting entries that had already happened, and scoring a different question than the one I'd defined. Rebuilding the candidate set properly brought the true rate down to 0.23%.
- Leakage: keeping every feature point-in-time across 30M rows took care, especially the corridor rates, which have to be re-estimated each quarter from outcomes already observed.
- Memory: the data didn't fit in RAM, so I used DuckDB for the heavy joins and sampled negatives (with weights) for training.
- Honest explanations: raw SHAP values can make a feature look important even when its value is zero. Each reason is now shown only when the underlying value actually supports it.
What I learned
- The simple corridor rule is a strong baseline. The model's real gain isn't in ranking one song's markets (+3 points). It's in choosing which songs and markets to work each week, where it's about 3x better.
- Evaluating the decision a user actually makes matters more than a single accuracy number.
- Stating limits builds more trust than hiding them.
Limits
- YouTube charts only, covering 43 countries.
- It forecasts organic spread, not what promotion adds.
- A chart entry shows visibility, not a lasting audience.
What's next
Talk to 10 distributor marketing leads, give 3 design partners a free weekly email of the top-10 picks, then run a randomised test with one partner to measure how much promotion in predicted markets actually adds.
Team contributions
Solo entry by Lindokuhle Nyoka (Johannesburg). I did the problem framing, data audit, pipeline, modelling, evaluation, demo and documentation, built with AI coding assistants (Antigravity, Claude).
Built With
- duckdb
- html
- javascript
- lightgbm
- numpy
- pandas
- pyarrow
- pytest
- python
- scikit-learn
