Inspiration
“Clean air knows no borders. With technology, neither should our solutions.” Air pollution is a global crisis, but its impact is especially severe in border regions where pollution doesn’t respect national boundaries. Living in South Asia, I’ve witnessed firsthand how transboundary air pollution can endanger millions, with little coordination between neighboring countries. This inspired me to build a system that not only monitors air quality in real time but also fosters cross-border collaboration and rapid emergency response.
What Makes This Project Unique
- Transnational Focus: Most AQI dashboards are city- or country-specific. This project is designed for cross-border impact, protecting millions in multiple countries.
- Real-Time, Actionable Insights: The system not only visualizes data but also enables rapid, automated emergency response and coordination.
- Cloud-Native & Scalable: Built with best practices for cloud deployment, making it easy to scale and adapt to new regions. ## What it does
How we built it
Backend:
- Built with FastAPI (Python) for high-performance, asynchronous APIs.
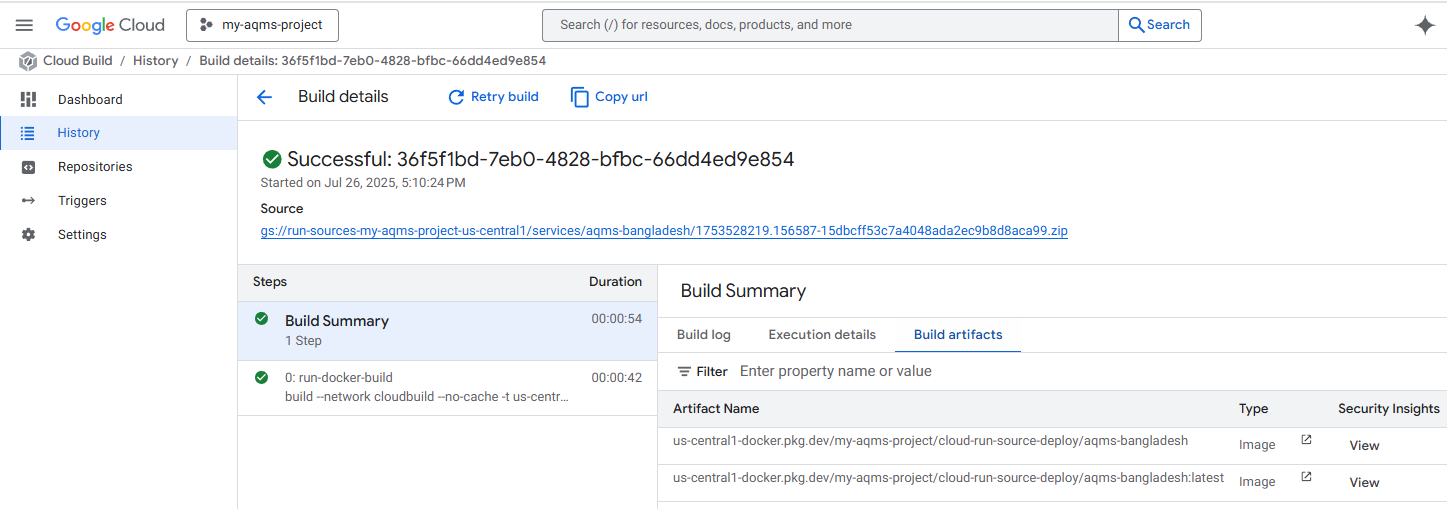
- Deployed on Google Cloud Run using a multi-stage Docker build for portability and scalability.
- Real-time AQI data is fetched, processed, and served via REST endpoints.
- Environment variables and
.envfiles are used for secure API key management.
Frontend:
- HTML, CSS, JavaScript for a modern, responsive UI.
- Chart.js for real-time gauge visualizations of PM2.5 and AQI.
- Google Maps JavaScript API for interactive, color-coded markers and info windows.
- Accessibility and mobile responsiveness are prioritized.
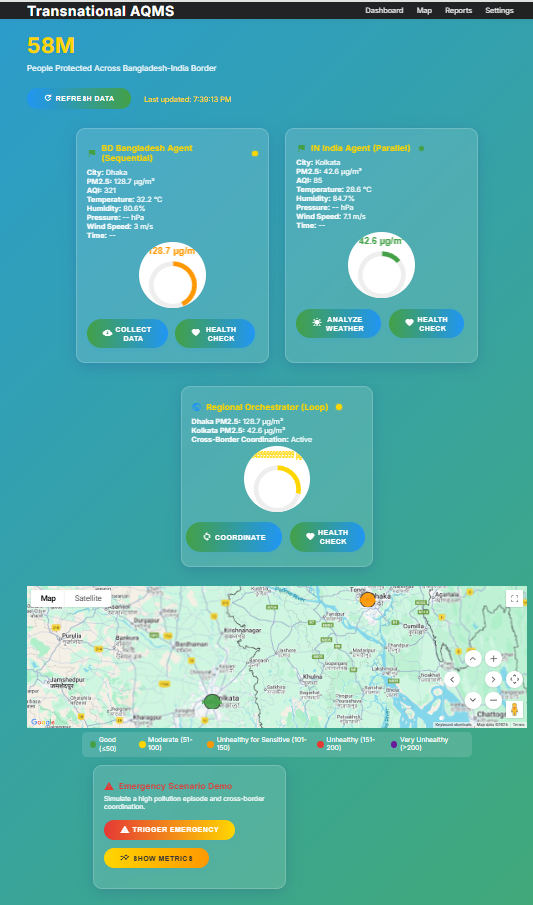
Orchestration & Emergency Response:
- A regional orchestrator agent coordinates data collection and emergency alerts across borders.
- Simulated emergency scenarios demonstrate rapid, automated cross-border coordination.
Challenges we ran into
- API Key Security: Ensuring the Google Maps API key was securely injected and never exposed in the frontend required careful backend logic and environment management.
- Asynchronous Data Loading: Handling the timing between Google Maps API loading and data fetching was tricky, especially with async JavaScript and Cloud Run deployments.
- Cross-Border Data Modeling: Designing a system that could easily scale to multiple countries and handle different data sources required flexible, modular code.
- Debugging in Production: Diagnosing issues like missing map markers or API key errors on a live Cloud Run deployment taught me the value of robust logging and step-by-step debugging. ## Accomplishments that we're proud of
- Transnational Focus: Most AQI dashboards are city- or country-specific. This project is designed for cross-border impact, protecting millions in multiple countries.
- Real-Time, Actionable Insights: The system not only visualizes data but also enables rapid, automated emergency response and coordination.
- Cloud-Native & Scalable: Built with best practices for cloud deployment, making it easy to scale and adapt to new regions.
What we learned
- Cloud-Native Technologies: Leveraging Docker and Google Cloud Run taught me how to build scalable, portable, and production-ready APIs.
- API Integration: Integrating Google Maps Platform and real-time AQI data sources deepened my understanding of asynchronous data flows and secure API key management.
- Visualization: I learned how to create intuitive, actionable dashboards using Chart.js and Google Maps, making complex data accessible to everyone.
- Collaboration: Building for cross-border use cases highlighted the importance of interoperability, open standards, and clear communication between systems.
What's next for Cross-Border Air Quality Management System
Our vision is to create a world where clean air is a fundamental right, protected by technology that transcends borders and unites communities in environmental stewardship.
Built With
- agents
- cloud
- google-maps


Log in or sign up for Devpost to join the conversation.