-
-
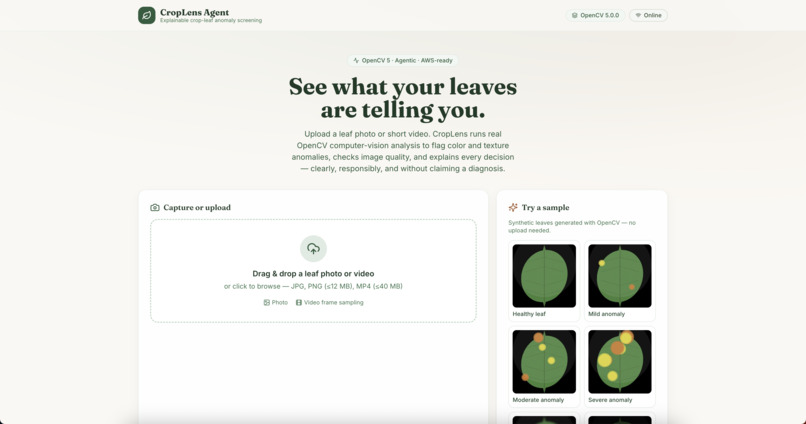
Main Analysis
-
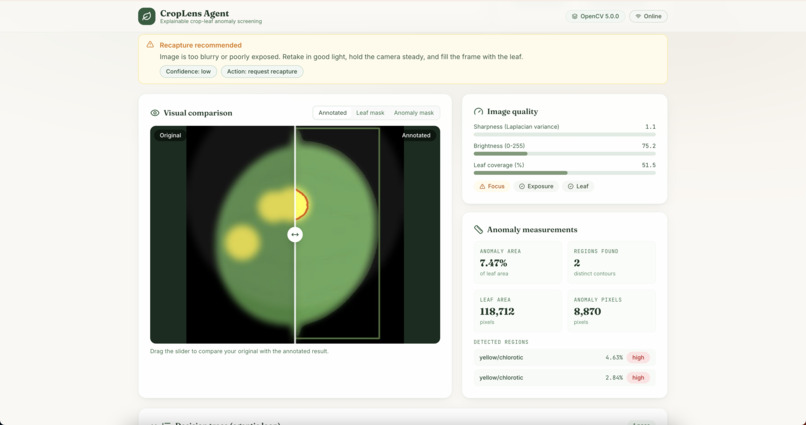
Quality-Aware Decisions
-
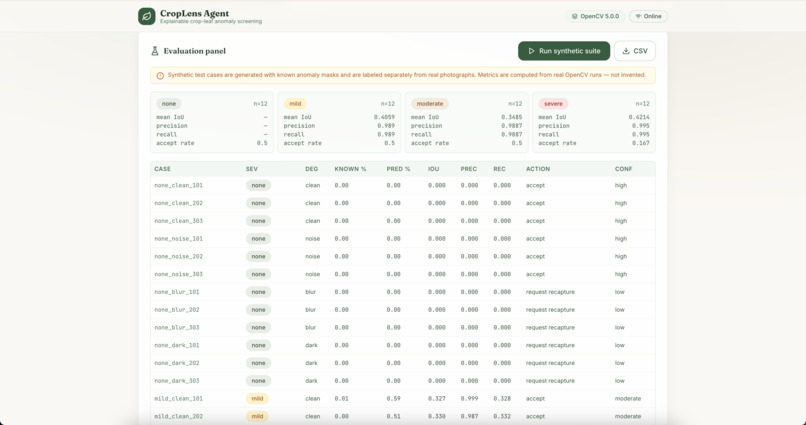
Evaluation
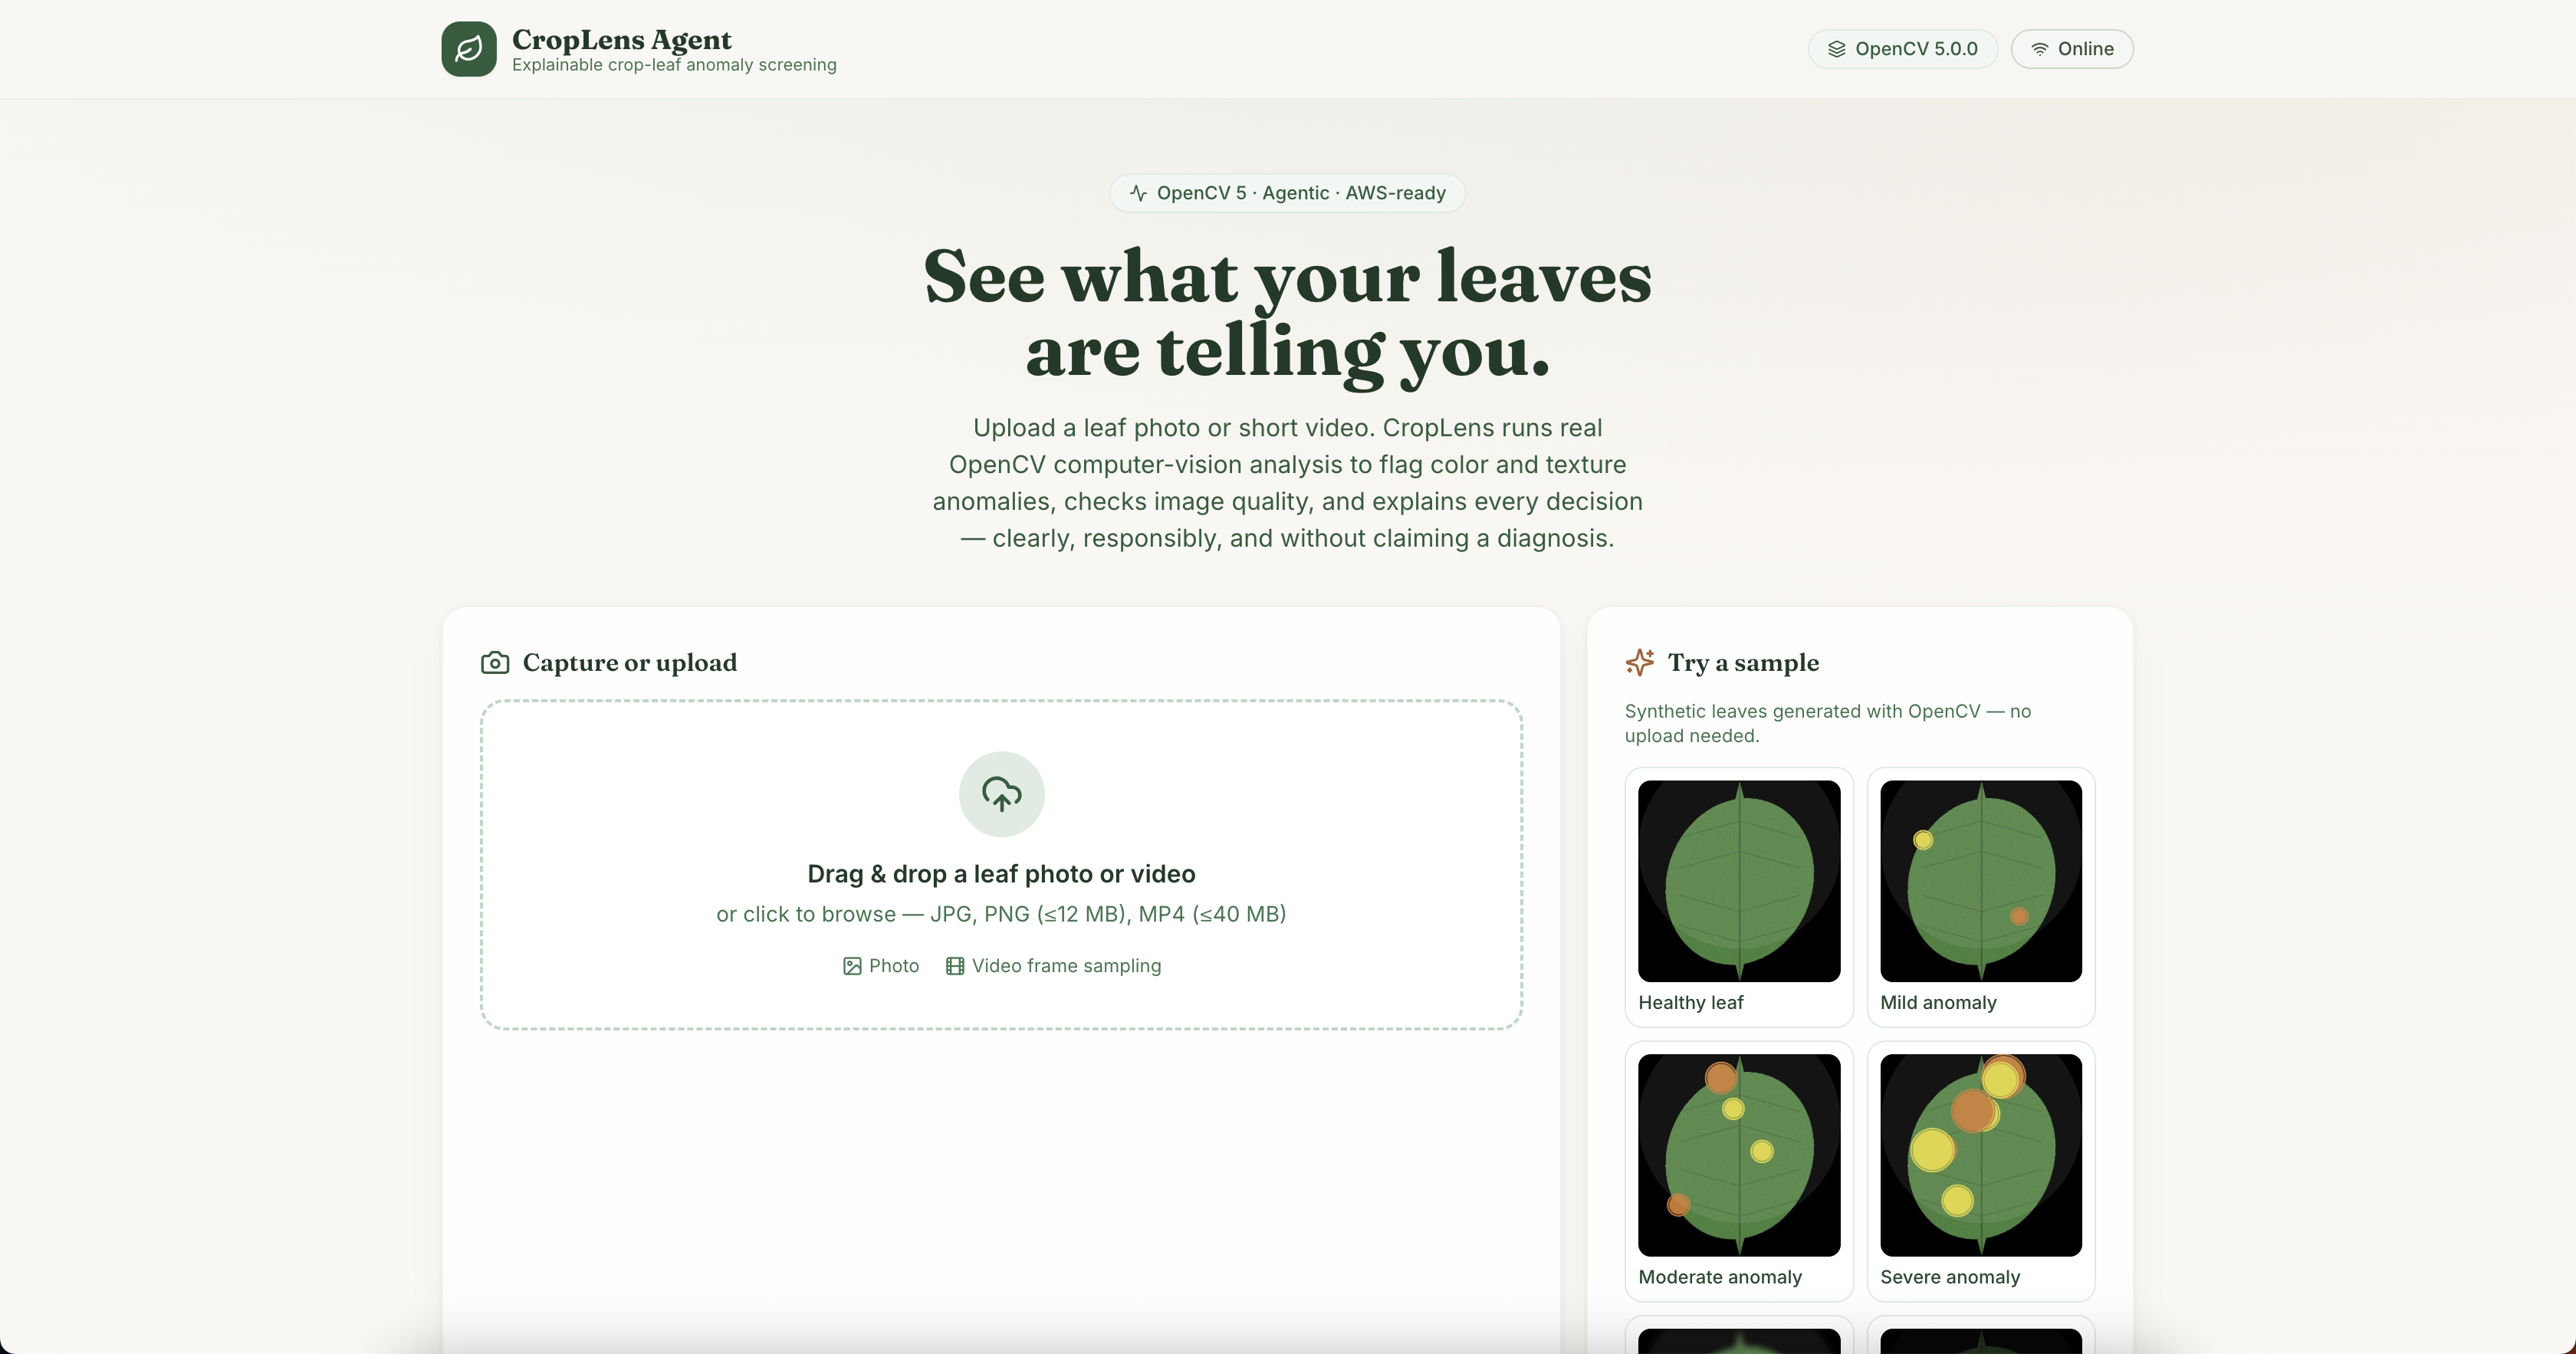
CropLens Agent: Explainable Crop-Leaf Anomaly Screening
Inspiration
Farmers, growers, and agricultural field workers may need to inspect many leaf photographs without immediately knowing which ones deserve closer attention. Poor focus, bad lighting, and ambiguous discoloration can make visual assessment difficult.
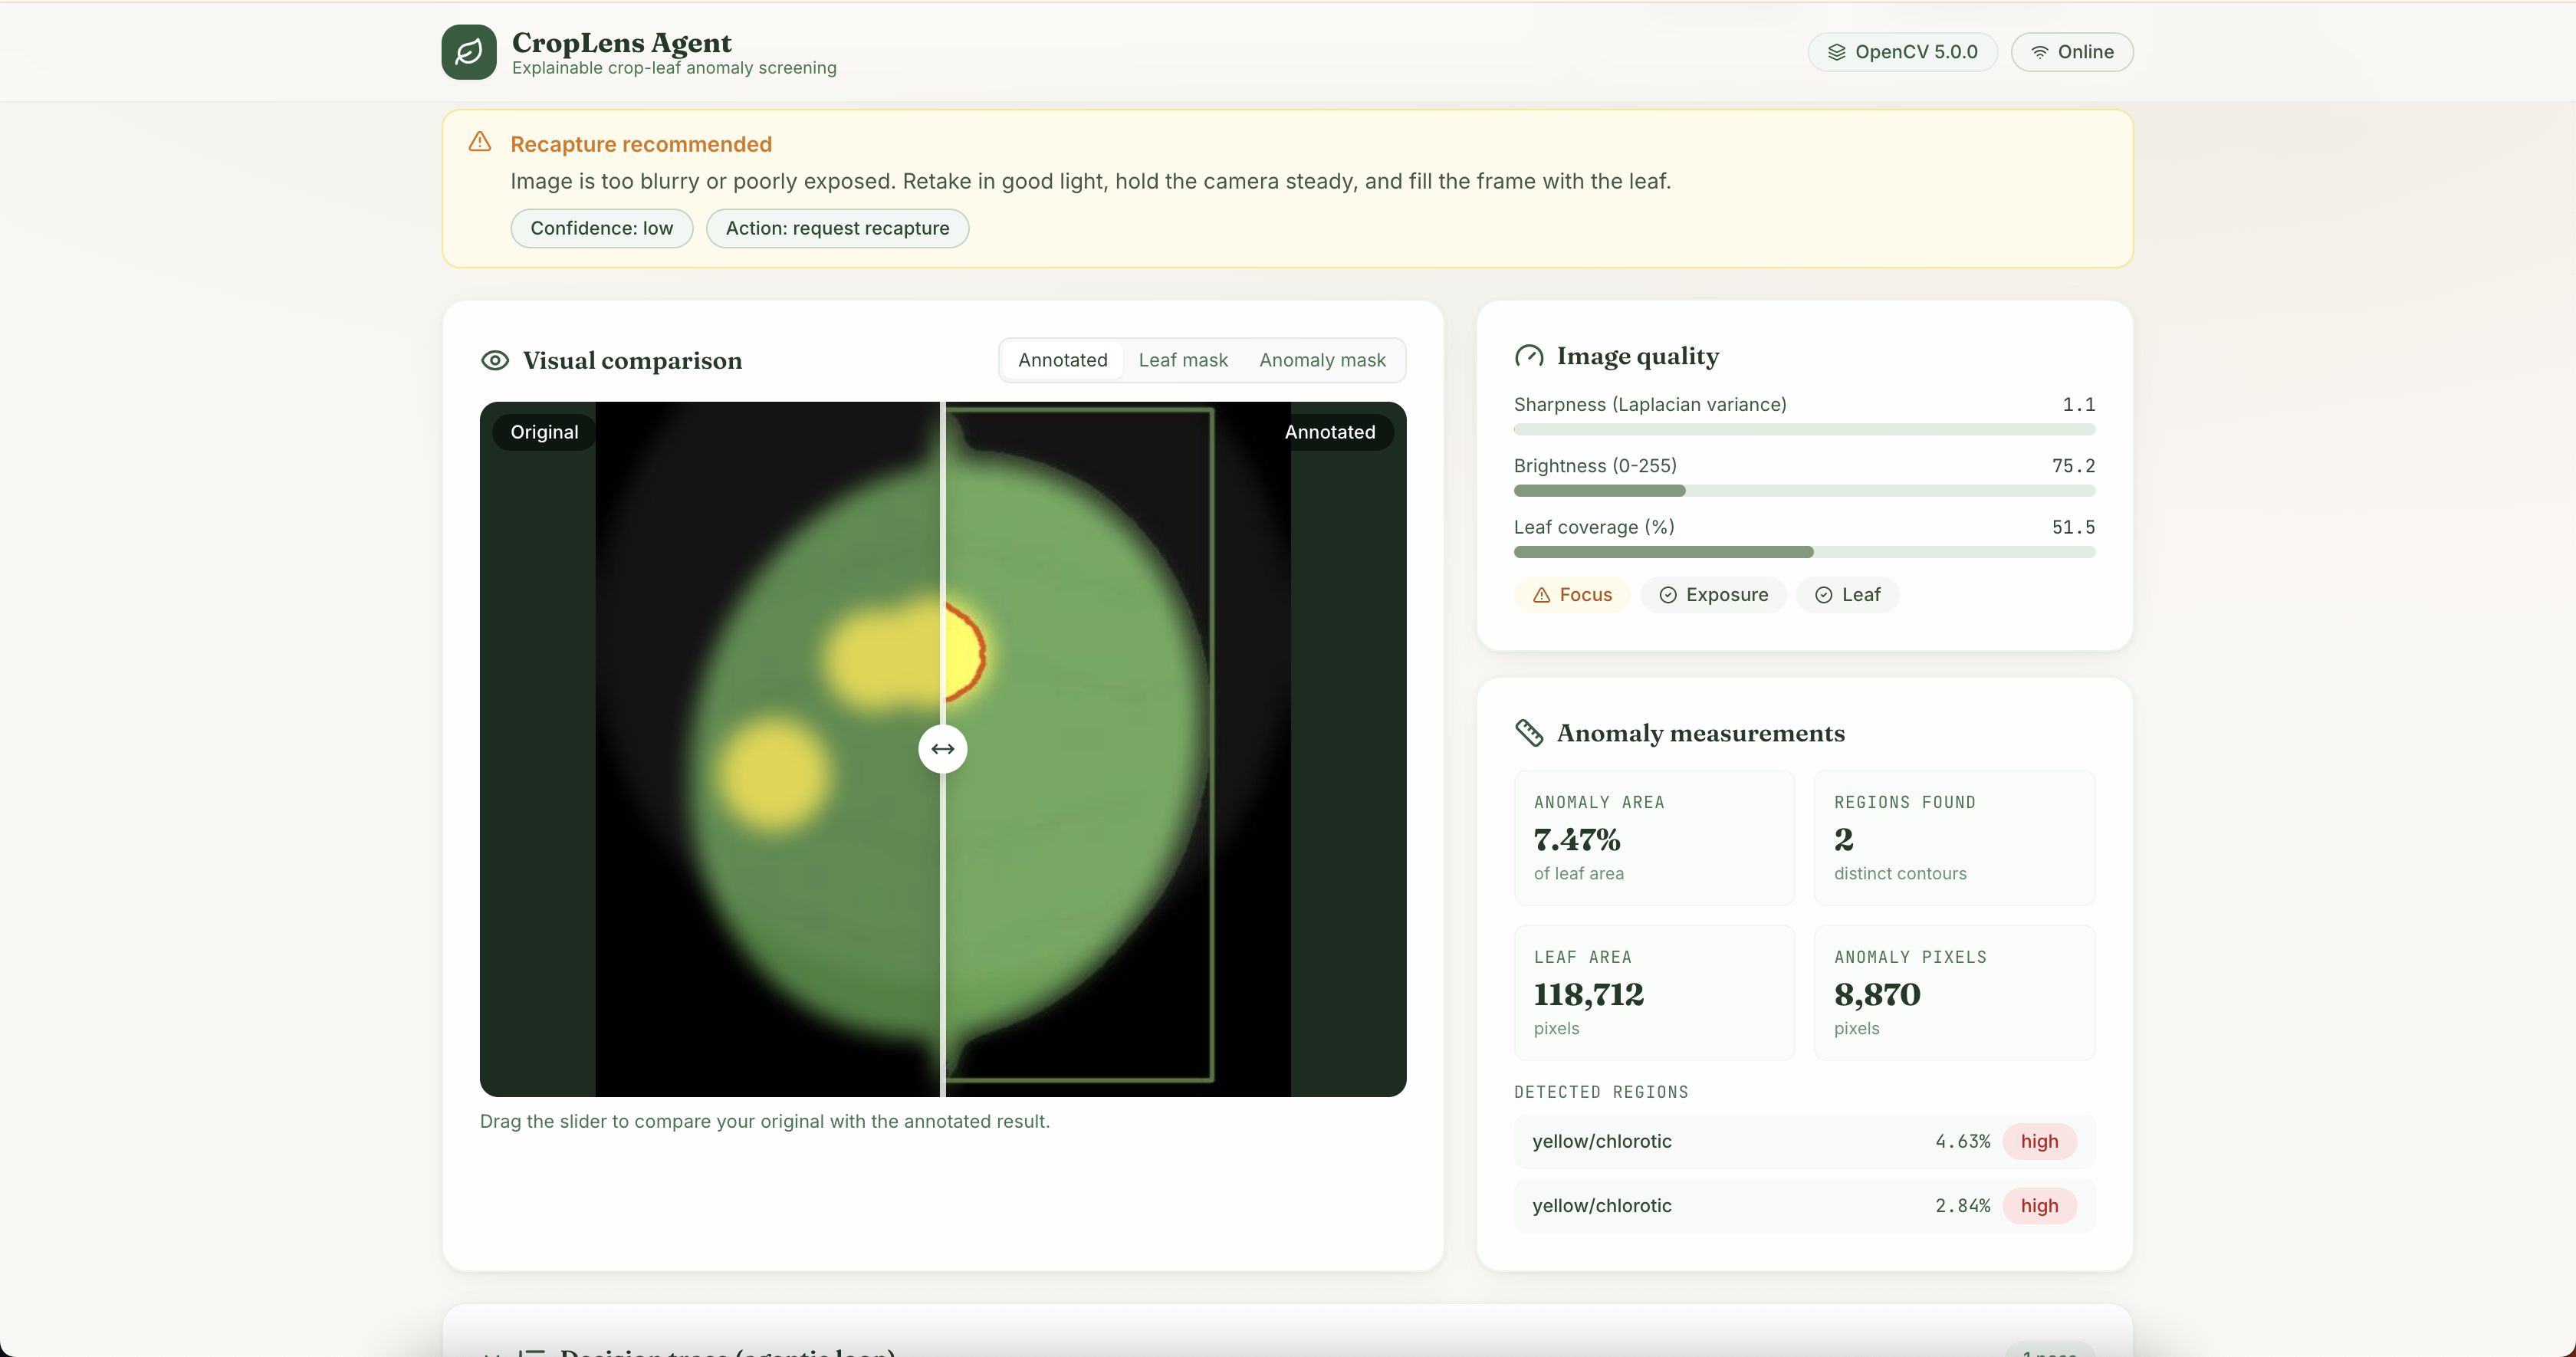
CropLens Agent explores a practical first step: use computer vision to flag visible leaf anomalies, assess whether an image is suitable for screening, and explain the next recommended action. It is designed as a decision-support tool for growers and agronomists, not a replacement for expert inspection or laboratory diagnosis.
What it does
CropLens Agent accepts leaf photographs and short videos. It measures image quality, estimates leaf coverage, detects candidate yellow or brown regions, and returns annotated visual results alongside a transparent decision trace.
The application can:
- Recommend recapturing an image when focus or exposure is inadequate.
- Run a conditional second analysis pass when the initial measurements indicate uncertainty.
- Flag sufficiently large anomaly areas for human review.
- Display anomaly regions, area measurements, quality metrics, masks, and the reasoning behind its next action.
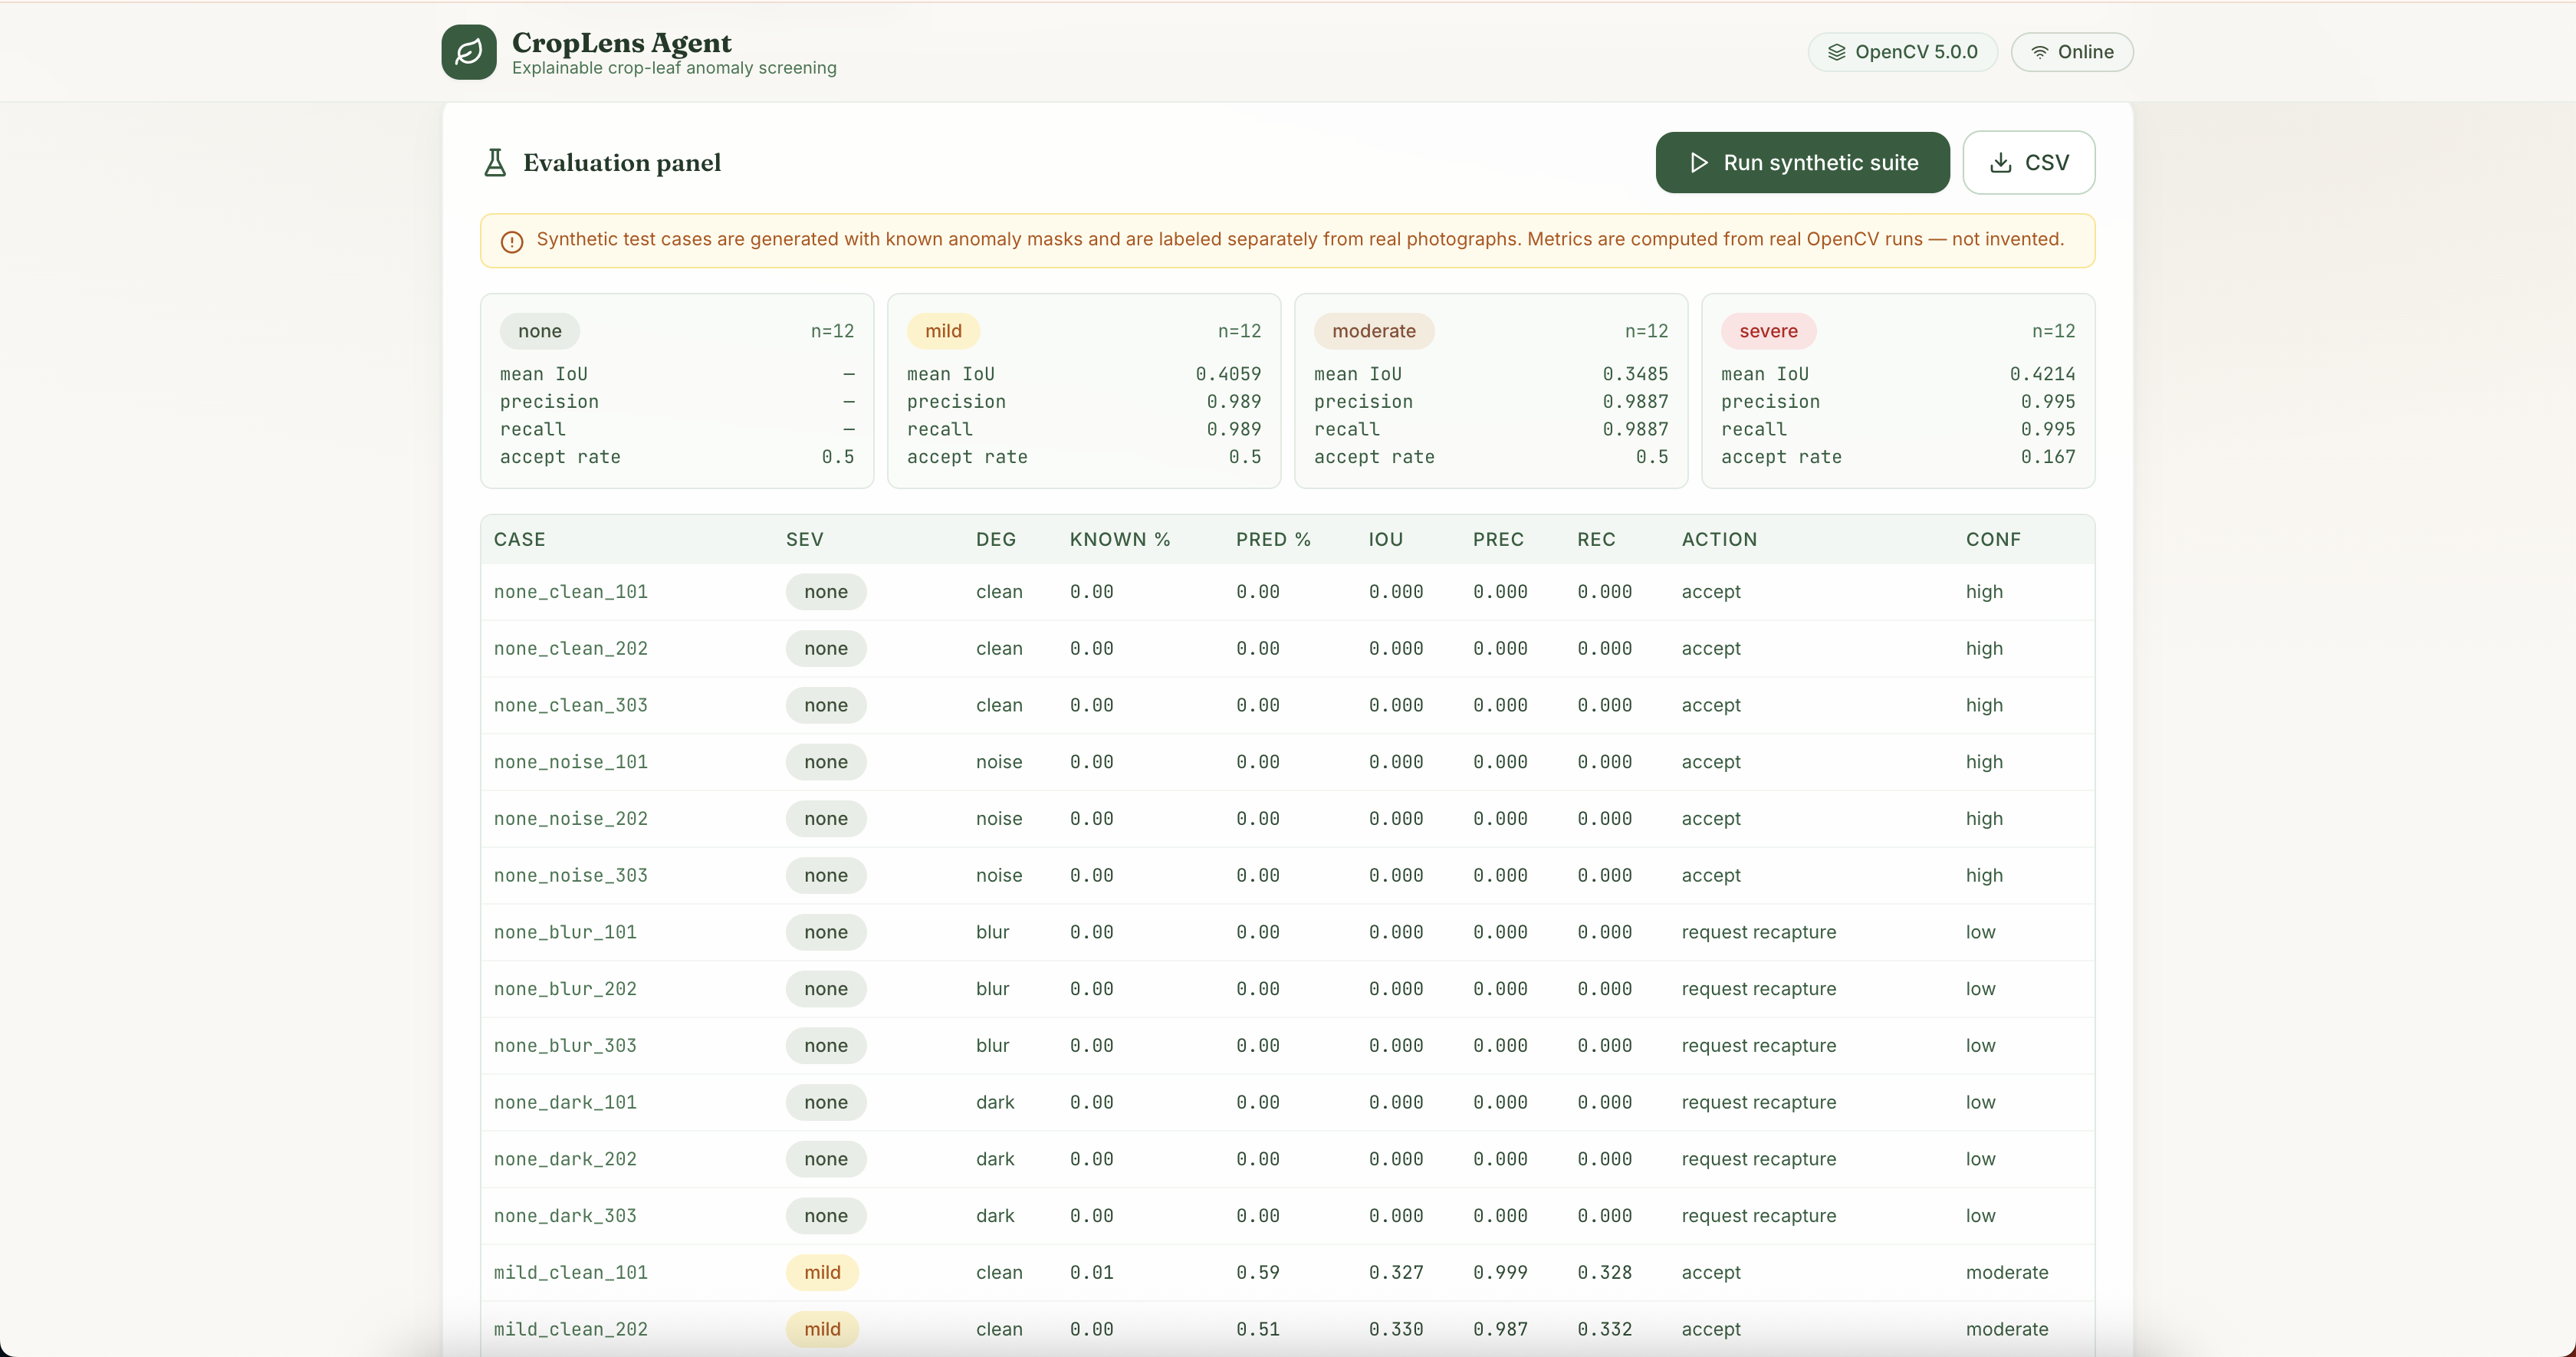
- Run a synthetic evaluation suite with known anomaly masks and export results for inspection.
How we built it
The frontend uses React, TypeScript, Vite, and Tailwind CSS. The backend uses Python, FastAPI, and OpenCV 5. The analysis pipeline uses Laplacian variance for sharpness, brightness measurements, HSV-based leaf and anomaly masks, morphological operations, connected components, and contours to measure visible regions.
The agent is implemented as a deterministic, inspectable state machine. Image measurements determine whether analysis stops, a better capture is requested, a second pass is run, or human review is recommended. The second pass can apply CLAHE illumination normalization and adjusted thresholds; its result is selected based on measured leaf-coverage improvement.
The backend is deployed as an AWS Lambda container image stored in Amazon ECR and exposed through a Lambda Function URL. The published browser application is configured to call the live AWS endpoint. The health endpoint reports the actual OpenCV version and runtime environment so the deployment can be verified.
Evaluation and testing
The synthetic evaluation suite creates procedural leaf images with known anomaly masks across none, mild, moderate, and severe categories, with clean, noisy, blurry, and dark variants. The system calculates metrics from its actual OpenCV outputs rather than displaying hardcoded example results.
The reported mean Intersection over Union (IoU) for the tested anomaly categories is:
- Mild: 0.4059
- Moderate: 0.3485
- Severe: 0.4214
The no-anomaly category reports IoU as N/A because there are no anomaly pixels to measure. These are results from synthetic test cases, not claims of diagnostic accuracy on real agricultural photographs.
The latest verification completed with 14 backend tests passing, a clean frontend typecheck, and a successful production build. The live AWS health endpoint returned HTTP 200 and reported OpenCV 5.0.0. The built-in sample catalog and severe-anomaly analysis endpoint were also tested successfully.
Challenges and lessons learned
An important challenge was separating image-quality problems from possible visual anomalies. A blurry or poorly exposed image can produce misleading results, so the agent must consider capture quality before accepting an analysis. Another challenge was making the evaluation summary calculate precision and recall independently; a regression test now checks that summary metrics match the underlying per-case data.
This project reinforced the value of measurable computer-vision outputs, explicit failure handling, reproducible evaluation, and decision traces that allow a reviewer to understand why the system took an action.
Limitations and responsible use
CropLens Agent screens visible color and texture anomalies only. Yellow or brown regions can have multiple causes, including disease, nutrient stress, senescence, water damage, or image-capture artifacts. The current synthetic evaluation does not establish performance on a representative, expert-labelled real-world dataset.
The application does not identify pathogens or recommend treatment. Results should not be the sole basis for crop-management decisions; important findings should be confirmed by a qualified agronomist or other appropriate expert. The backend is designed not to store uploaded images permanently by default.
Links
- Live application: https://croplens-agent-3w3s.bolt.host
- Source repository: https://github.com/nomailcharlie/CropLens
- AWS health endpoint: https://hy3yj4ugerh6jryvz4hjxp2v2i0ikmsn.lambda-url.ap-southeast-2.on.aws/health
Built With
- agentic-ai
- agriculture
- amazon-ecr
- amazon-web-services
- aws-lambda
- computer-vision
- fastapi
- image-processing
- mangum
- opencv
- opencv-5
- python
- react
- serverless
- tailwind-css
- typescript
- vite

Log in or sign up for Devpost to join the conversation.