-
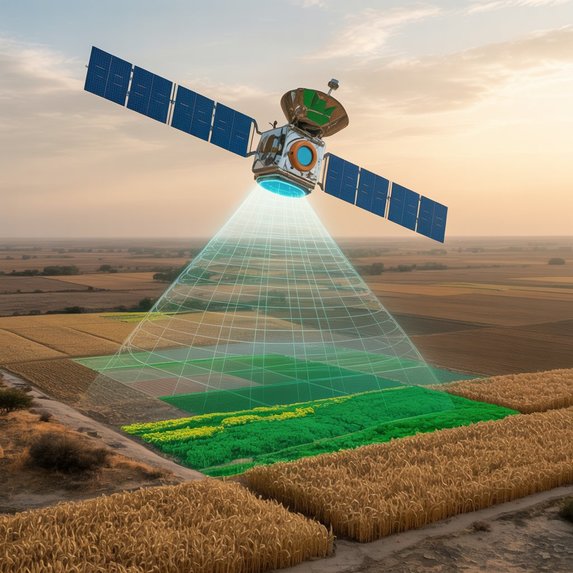
Crop Vision :- AI-Powered Satellite-Based Crop Identification

Crop Vision: AI-Powered Satellite-Based Crop Identification
Inspiration
Rajasthan’s harsh climate with only 480–750 mm of annual rainfall, which is highly erratic, creates chronic drought stress and sparse vegetation cover.
In the state’s arid and hyper-arid zones, few crops can be reliably grown, leaving large areas fallow or degraded.
These conditions undermine food security and climate resilience. Compounding this, official crop statistics are often coarse or inconsistent, so farmers and planners lack timely, field-level crop information.
Yet accurate crop maps are essential for effective planning: governments and agribusinesses rely on them to assess production potential, plan logistics, evaluate impacts, and shape policy.
In short: Our academic curiosity about deep learning met a pressing real-world need — to leverage open satellite data and advanced AI for better crop intelligence in Rajasthan’s challenging environment.
What It Does
Crop Vision identifies crop types at the field level by learning from seasonal satellite time series.
- Ingests Sentinel-2 and Landsat-8 imagery
- Uses 13 spectral bands from Sentinel-2 with 5-day revisit frequency
- Builds dense spatio-temporal image time series (SITS)
Computes vegetation indices:
- Normalized Difference Vegetation Index (NDVI):
$$ NDVI = \frac{NIR - Red}{NIR + Red} $$ - Enhanced Vegetation Index (EVI):
$$ EVI = 2.5 \cdot \frac{NIR - Red}{NIR + 6 \cdot Red - 7.5 \cdot Blue + 1} $$ - Normalized Difference Red-Edge (NDRE)
- Normalized Difference Water Index (NDWI)
- Normalized Difference Vegetation Index (NDVI):
Feeds indices into a temporal deep-learning model (Transformer or 1D-CNN)
Learns phenology signatures: greening, peak biomass, and senescence
Generates georeferenced crop-type maps ready for visualization.
How We Built It
1. Data Acquisition
- Fetched multi-year Sentinel-2 and Landsat-8 imagery using:
- Google Earth Engine (GEE)
- SpatioTemporal Asset Catalogs (STAC API)
- Covered both Kharif and Rabi seasons.
2. Preprocessing
- Removed clouds and shadows using Sen2Cor or s2cloudless.
- Generated monthly composites and phenology-phase composites.
- Created clear-sky median stacks during critical growth phases.
3. Feature Engineering
- Computed time-series for vegetation indices: NDVI, NDRE, EVI, NDWI.
- Captured phenology curves to differentiate crops effectively.
4. Model Training
- Used deep sequence models: TempCNN, LSTMs, and Transformers.
- Tackled class imbalance using weighted losses and oversampling.
- Applied semi-supervised learning:
- Spectral-temporal clustering → pseudo-label generation
- Fine-tuned with iterative supervised training.
5. Output & Visualization
- Produced GeoTIFF maps of predicted crop types.
- Built an interactive dashboard using Folium/Leaflet for:
- Map visualization
- Field-level crop queries.
- Map visualization
Challenges We Faced
- Persistent Cloud Cover
> Peak monsoon months had >90% cloud cover → incomplete phenology curves. - Rainfall Variability
> Rajasthan’s rainfall swings from 0–2400 mm between years. - Smallholder Fields > Fragmented farms → mixed pixels → harder classification.
- Limited Ground Truth
> Few labeled datasets → combined field surveys, weak labels, and clustering.
Accomplishments We’re Proud Of
- Innovative AI Pipeline → Robust multi-temporal deep learning framework.
- Unique Dataset Integration → Fused Sentinel-2, Landsat-8, and Sentinel-1 SAR.
- High-Resolution Mapping → Produced 10m resolution crop-type maps.
- Hybrid Semi-Supervised Learning → Clustering + pseudo-labeling = better accuracy.
- Scalability Proof → Workflow tested on a pilot region, extensible state-wide.
- Open-Source Contribution → Pipeline scripts are documented and reusable.
What We Learned
- Temporal Resolution Matters
Sentinel-2’s 5-day revisit improved classification accuracy significantly. - Phenology ≠ Pixel Size
Higher spatial resolution isn’t always better if revisit frequency drops. - Transferability Challenges
Drought years produce out-of-distribution patterns → models need exposure to diverse conditions. - Transformers & LSTMs Excel
Attention mechanisms effectively captured key phenology stages like flowering peaks.
What’s Next for CropVision
1. Integrate SAR (Sentinel-1)
- Fuse radar backscatter for all-weather mapping.
- Mitigates monsoon cloud cover problems.
2. Active Learning for Labels
- Models will flag uncertain fields.
- Surveyors focus on collecting ground truth only where needed.
3. Phenology-Based Yield Prediction
- Calculate yield proxies by integrating NDVI curves: $$ Y_{proxy} = \int_{t_1}^{t_2} NDVI(t) \, dt $$
- Extend CropVision into an early-warning system.
Repository Structure
CropVision/
├── src/
│   ├── data_ingestion.py
│   ├── preprocessing.py
│   ├── feature_engineering.py
│   ├── model.py
│   ├── train.py
│   └── visualize.py
├── notebooks/
│   └── demo_notebook.ipynb
├── data/
│   └── sample_dataset/
├── outputs/
│   └── crop_maps/
├── README.md
├── requirements.txt
└── LICENSE
