-
-

CritMin Compass — Critical Minerals Intelligence Engine
Inspiration
The global battery and EV supply chain is a \$200B+ market sitting on top of a handful of critical minerals — lithium, nickel, cobalt, manganese — that are concentrated in a few countries and subject to rapidly shifting trade policy. In the last three years alone we've seen lithium carbonate swing from \$8/kg to \$80/kg and back, a nickel market collapse triggered by a single producer, and a wave of new regulation rewriting the rules of who can source what from where.
The people making real decisions in this space — supply chain managers, finance teams, policy analysts, investors — are stuck stitching together macro data from FRED, commodity spot prices, SEC filings, and regulatory calendars by hand. Hours of analyst work that's stale by the time it's delivered. Meanwhile, the regulatory landscape keeps accelerating: IRA production credits, FEOC procurement restrictions, EU Critical Raw Materials Act due diligence requirements, escalating tariffs and export controls.
Most commodity intelligence tools are backward-looking dashboards built for traders. They tell you what happened. They don't tell you what's likely to happen next, or how confident you should be in that forecast.
I wanted to build the tool that's missing: a live intelligence engine that connects macro signals, commodity pricing, and regulatory catalysts — and outputs a decision-useful risk score with honest uncertainty bounds, not false-precision point estimates. Something that answers the questions decision-makers actually ask: "What's the probability of a lithium supply disruption in the next 90 days?" or "How does the FEOC timeline change the risk profile for my sourcing strategy?"
The ZerveHack was the forcing function to ship it.
What it does
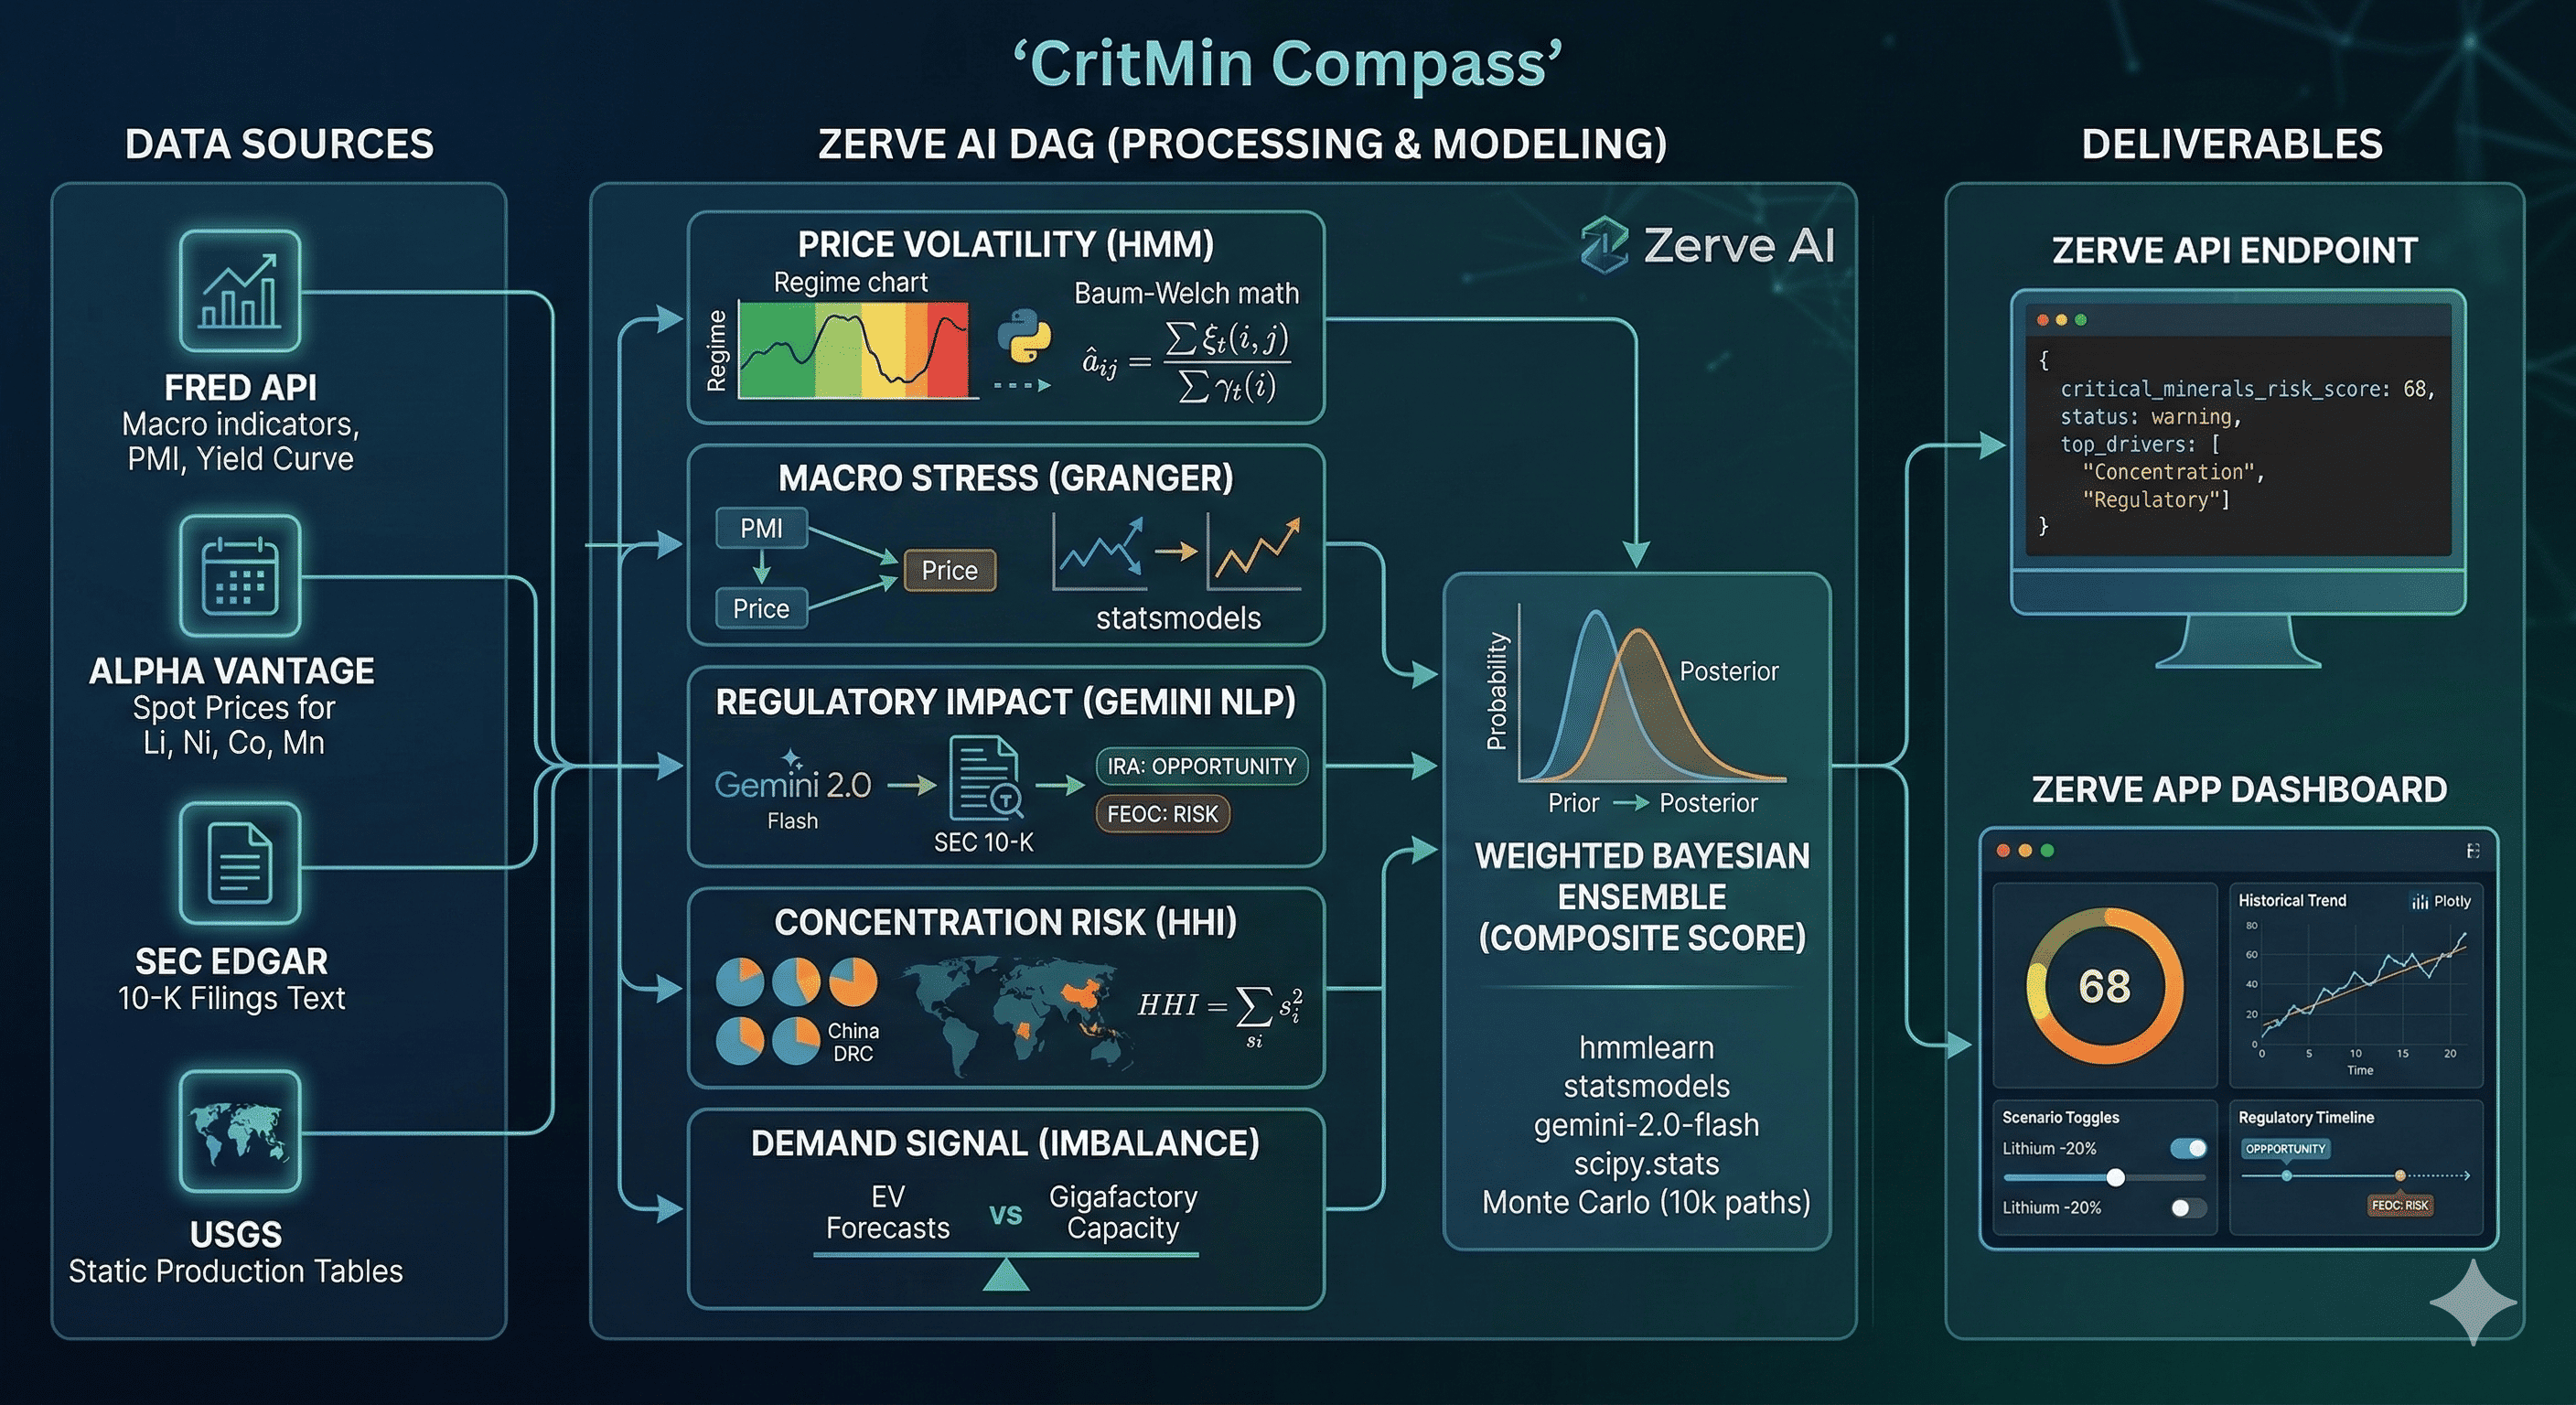
CritMin Compass generates a composite Critical Minerals Risk Score (0–100) for battery materials (lithium, nickel, cobalt, manganese), updated on every run, with confidence intervals and scenario modeling.
It scores supply chain disruption probability across five dimensions:
- Price Volatility Risk — Hidden Markov Model regime detection (low-vol / trending / crisis) on rolling 60-day commodity price windows. The transition probability matrix is estimated via Baum-Welch:
$$\hat{a}{ij} = \frac{\sum{t=1}^{T-1} \xi_t(i,j)}{\sum_{t=1}^{T-1} \gamma_t(i)}$$
Macro Stress Signal — Granger causality tests linking leading indicators (yield curve spread, PMI, industrial production index) to 30/60/90-day commodity price movements
Regulatory Impact — Google Gemini API classifies SEC 10-K filing paragraphs by regulatory relevance (FEOC, IRA, CRMA) and sentiment (risk / opportunity / neutral), producing a regulatory exposure score per company
Concentration Risk — Herfindahl-Hirschman Index (HHI) scoring geographic supply concentration:
$$HHI = \sum_{i=1}^{N} s_i^2$$
where $s_i$ is country $i$'s share of global production (China ~65% lithium refining, Indonesia ~50% nickel, DRC ~70% cobalt)
- Demand Signal — EV production forecasts vs. announced battery gigafactory capacity, flagging supply-demand imbalance windows
The composite score uses a weighted Bayesian ensemble. Priors are set from historical disruption base rates (~2.3 major supply events per decade per mineral), posteriors update with each new data pull:
$$P(\theta \mid D) \propto P(D \mid \theta) \cdot P(\theta)$$
Deliverables:
- Zerve API endpoint — returns current risk score, component breakdowns, top 3 risk drivers, and confidence interval for any queried mineral
- Zerve App dashboard — interactive risk gauge, historical trend chart, scenario toggles ("What if lithium drops 20%?"), and a regulatory countdown timeline
How we built it
Platform: Zerve AI — leveraging the agent for iterative code generation, Python + SQL interoperability, and direct notebook-to-production deployment.
Data pipeline (Python blocks in Zerve DAG):
| Source | Data | Frequency |
|---|---|---|
| FRED API | PPI metals, industrial production, PMI, yield curve spread | Monthly |
| Alpha Vantage API | Lithium carbonate, nickel sulfate, cobalt hydroxide spot prices | Daily |
| SEC EDGAR API | 10-K/10-Q filings text — top 20 battery/EV companies | Quarterly |
| USGS static tables | Country-level mineral production shares | Annual (reference) |
| Regulatory calendar | FEOC, IRA, CRMA milestone dates | Static + manual updates |
Modeling stack:
- Regime detection:
hmmlearnGaussianHMM with 3 hidden states, fitted on log-returns - Macro correlation:
statsmodelsGranger causality with AIC-optimal lag selection - Regulatory NLP: Google Gemini 2.0 Flash (
gemini-2.0-flash) — few-shot prompted to classify filing paragraphs into regulatory categories and sentiment, batched with retry logic - Composite scoring:
scipy.statsBeta distribution priors, updated via conjugate Bayesian updates - Scenario engine: Monte Carlo simulation (10,000 paths) using empirical return distributions with user-defined shock overlays
- Visualization:
plotlyfor interactive charts, deployed via Zerve App output blocks
Zerve workflow DAG:
[FRED Pull] → [Alpha Vantage Pull] → [EDGAR Pull] → [Feature Engineering] →
    ↓                ↓                      ↓
[Macro Granger] ← [HMM Regime] → [Gemini NLP Classification] →
    ↓                ↓                      ↓
    └────────→ [Composite Bayesian Scorer] ←┘
                        ↓
              [Monte Carlo Scenarios]
                        ↓
              [Zerve App + API Deploy]
The Zerve agent was instrumental throughout — generating initial API integration code, debugging data alignment issues between monthly/daily/quarterly sources, and configuring the deployment. Total context switches to external tools: zero.
Challenges we ran into
1. Temporal alignment across mixed-frequency data. FRED publishes monthly. Commodity prices are daily. SEC filings are quarterly. Fusing these into a single feature matrix required careful forward-fill and interpolation logic. Naive alignment introduced look-ahead bias — the Zerve agent helped us iterate through alignment strategies and validate that no future data leaked into historical scores.
2. Gemini API rate limits on bulk filing classification. Processing thousands of 10-K paragraphs hit rate limits quickly. We implemented a chunking + exponential backoff strategy and used Zerve's parallel block execution to process multiple company filings simultaneously across separate blocks in the DAG.
3. Calibrating with sparse ground truth. There are only ~15 major battery mineral supply disruptions in the historical record (2018 cobalt crisis, 2021–22 lithium spike, 2024 nickel collapse). Purely data-driven weight optimization would overfit. We used informative Bayesian priors from domain expertise and cross-validated against held-out disruption events rather than chasing $R^2$ on a tiny sample.
4. Translating statistical output into decision language. The hardest design challenge wasn't technical — it was UX. A risk score of "73" means nothing without context. We added confidence intervals, natural-language risk driver summaries (generated via Gemini), and scenario comparison toggles so the output answers business questions, not just statistical questions.
Accomplishments that we're proud of
Full pipeline in Zerve, zero infrastructure. From raw API calls to deployed app and live API endpoint — no Docker, no YAML, no CI/CD pipeline. The notebook is the deployment artifact.
Gemini-powered regulatory intelligence that's genuinely novel. Most commodity risk tools completely ignore the regulatory dimension. Using LLM classification to score SEC filings for FEOC/IRA/CRMA exposure language — and feeding that into a quantitative risk model — bridges a real gap between legal/policy analysis and quantitative finance.
Honest uncertainty throughout. Every risk score ships with a credible interval. The Bayesian framework forces us to declare priors explicitly — every assumption is visible, auditable, and challengeable. No black boxes.
Real business utility on day one. The scenario engine directly answers the questions that supply chain teams, finance leaders, and investors actually ask. This isn't a demo — it's a tool built for production use in sourcing decisions, investor due diligence, and strategic planning.
What we learned
Zerve's agent compresses iteration cycles dramatically. Debugging data pipeline mismatches — the kind that normally eat hours — became minutes of agent-assisted troubleshooting with full data context awareness. The agent understood our schemas, our column names, and our intent.
Domain expertise is the real moat. The model architecture (HMM + Granger + Bayesian ensemble) is well-established. The value is in knowing which signals matter, which regulatory dates are catalytic, and how supply chain actors actually respond to shocks. AI handles execution; domain knowledge sets direction.
Bayesian thinking forces intellectual honesty. When you have to specify $P(\theta)$ explicitly, you can't hide behind "the model says so." We caught two instances where our initial priors were anchored on recency bias (overweighting the 2022 lithium spike) — the framework surfaced this naturally.
Mixed-frequency data fusion is an underserved problem. Most tutorials assume clean, aligned datasets. Real-world decision intelligence requires combining data that arrives at fundamentally different cadences — and getting the alignment wrong silently corrupts every downstream result.
Deploying from notebook to API in Zerve is genuinely frictionless. The gap between "this analysis works" and "this analysis is a product" — which normally requires an engineering handoff — collapsed to a configuration step within the same workspace.
What's next for CritMin Compass
Scheduled daily refresh — Zerve scheduled jobs for automated data pulls and risk score recalculation, with alert triggers when scores cross predefined thresholds
Expanded mineral coverage — add rare earths (neodymium, dysprosium) and natural graphite, critical for EV motors and battery anodes
Trade flow integration — UN Comtrade API for real-time import/export shift detection, specifically monitoring supply rerouting through non-FEOC jurisdictions (early warning for sanctions circumvention)
Investor brief auto-generation — package API output into formatted markdown briefs directly usable in virtual data rooms and investor presentations
Multi-stakeholder variants — defense procurement version (aligned to NDAA/ITAR requirements) and EU version (CRMA compliance scoring) as separate API endpoints from the same underlying model
Backtesting framework — formal out-of-sample validation against the 2018, 2022, and 2024 disruption events to publish model accuracy metrics and build user trust
Built with Zerve. Powered by domain obsession.
Built With
- alpha-vantage-api
- bayesian-statistics
- fred-api
- google-gemini-api
- hidden-markov-models
- hmmlearn
- monte-carlo-simulation
- natural-language-processing
- numpy
- pandas
- plotly
- python
- scikit-learn
- scipy
- sec-edgar-api
- sql
- statsmodels
- zerve-ai

Log in or sign up for Devpost to join the conversation.