-
-
-
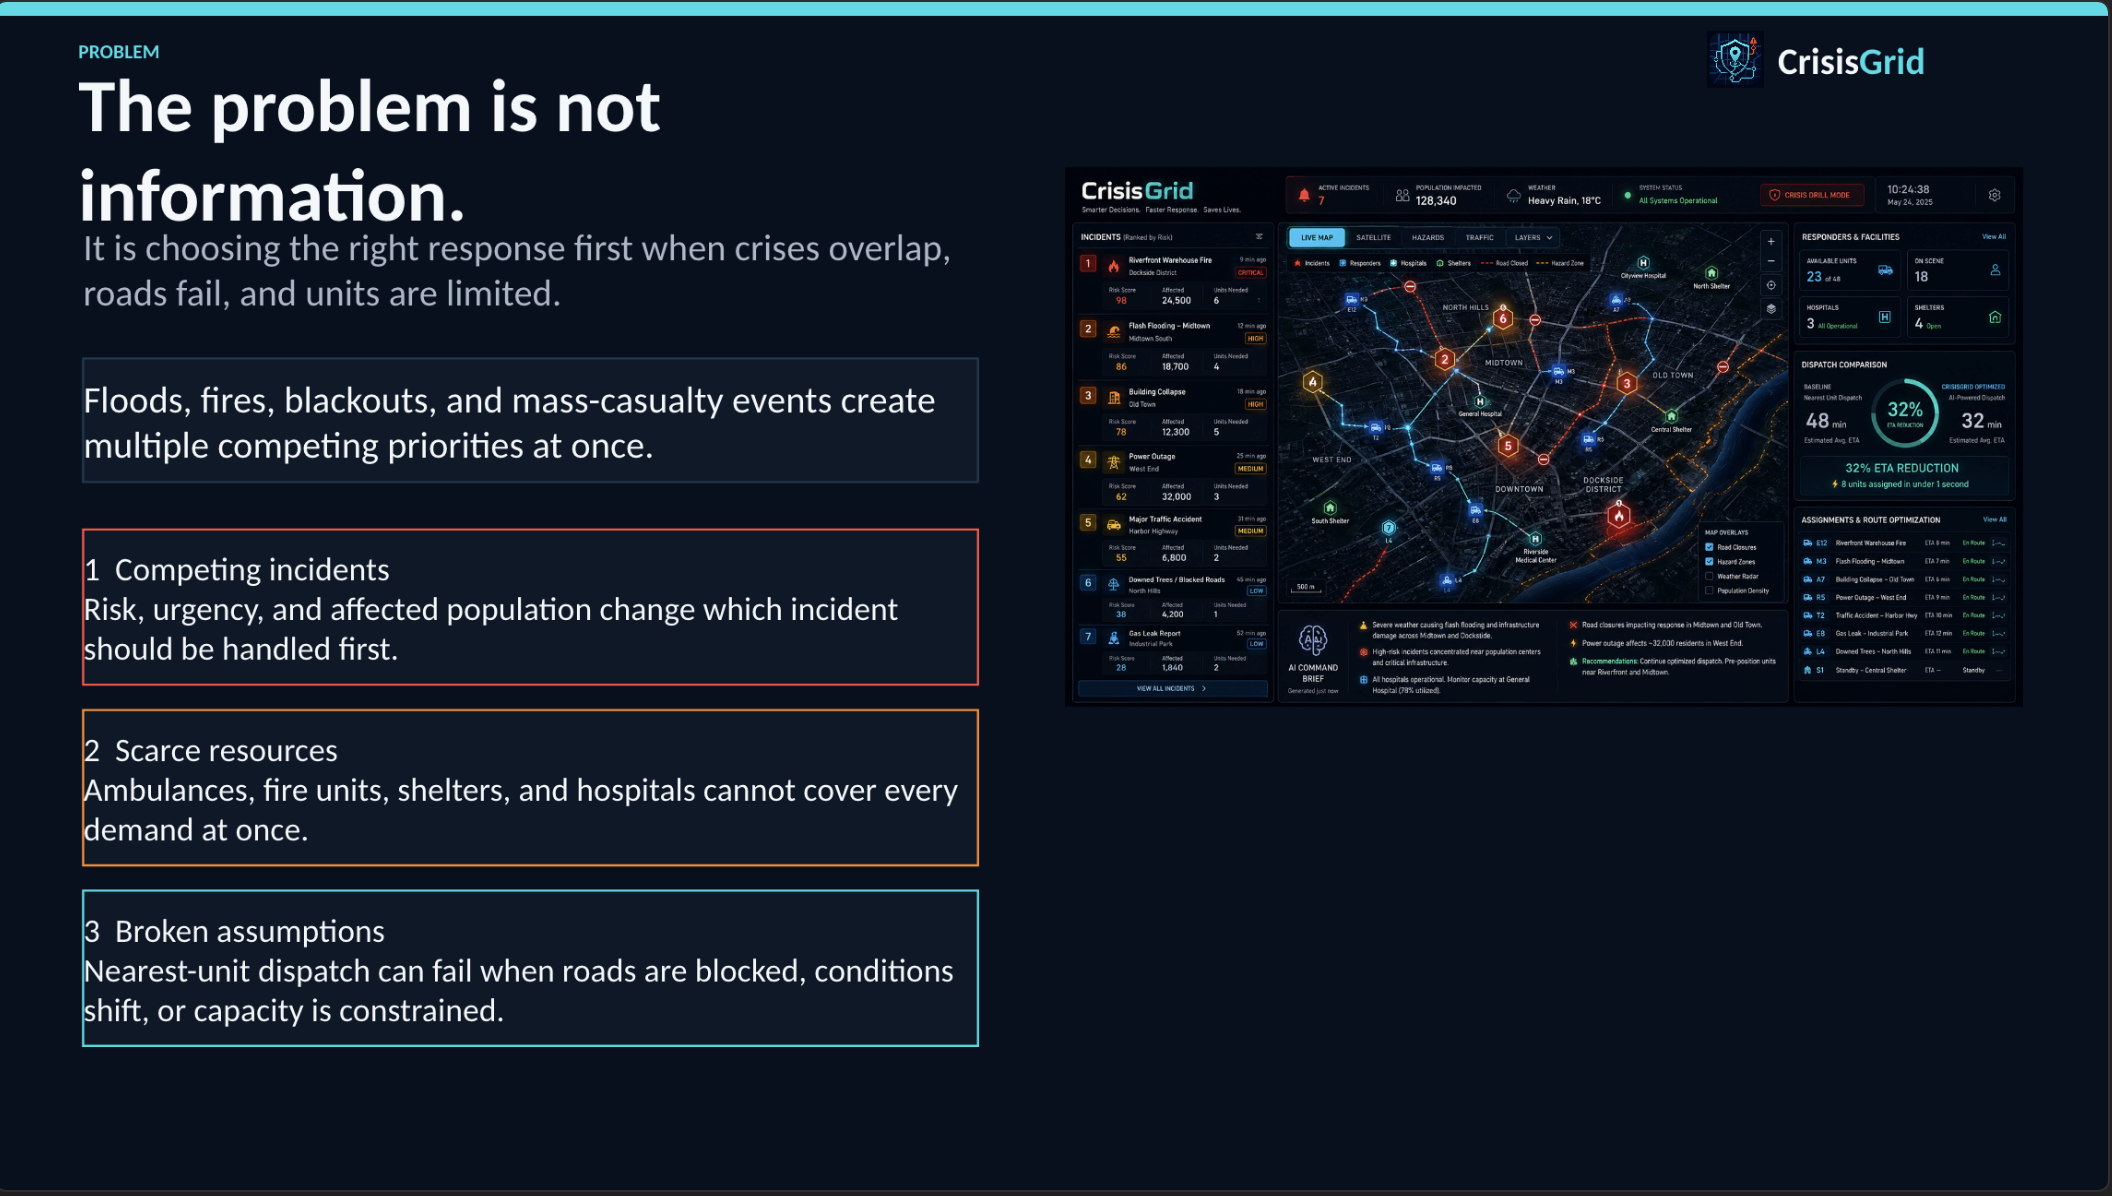
The Problem
-
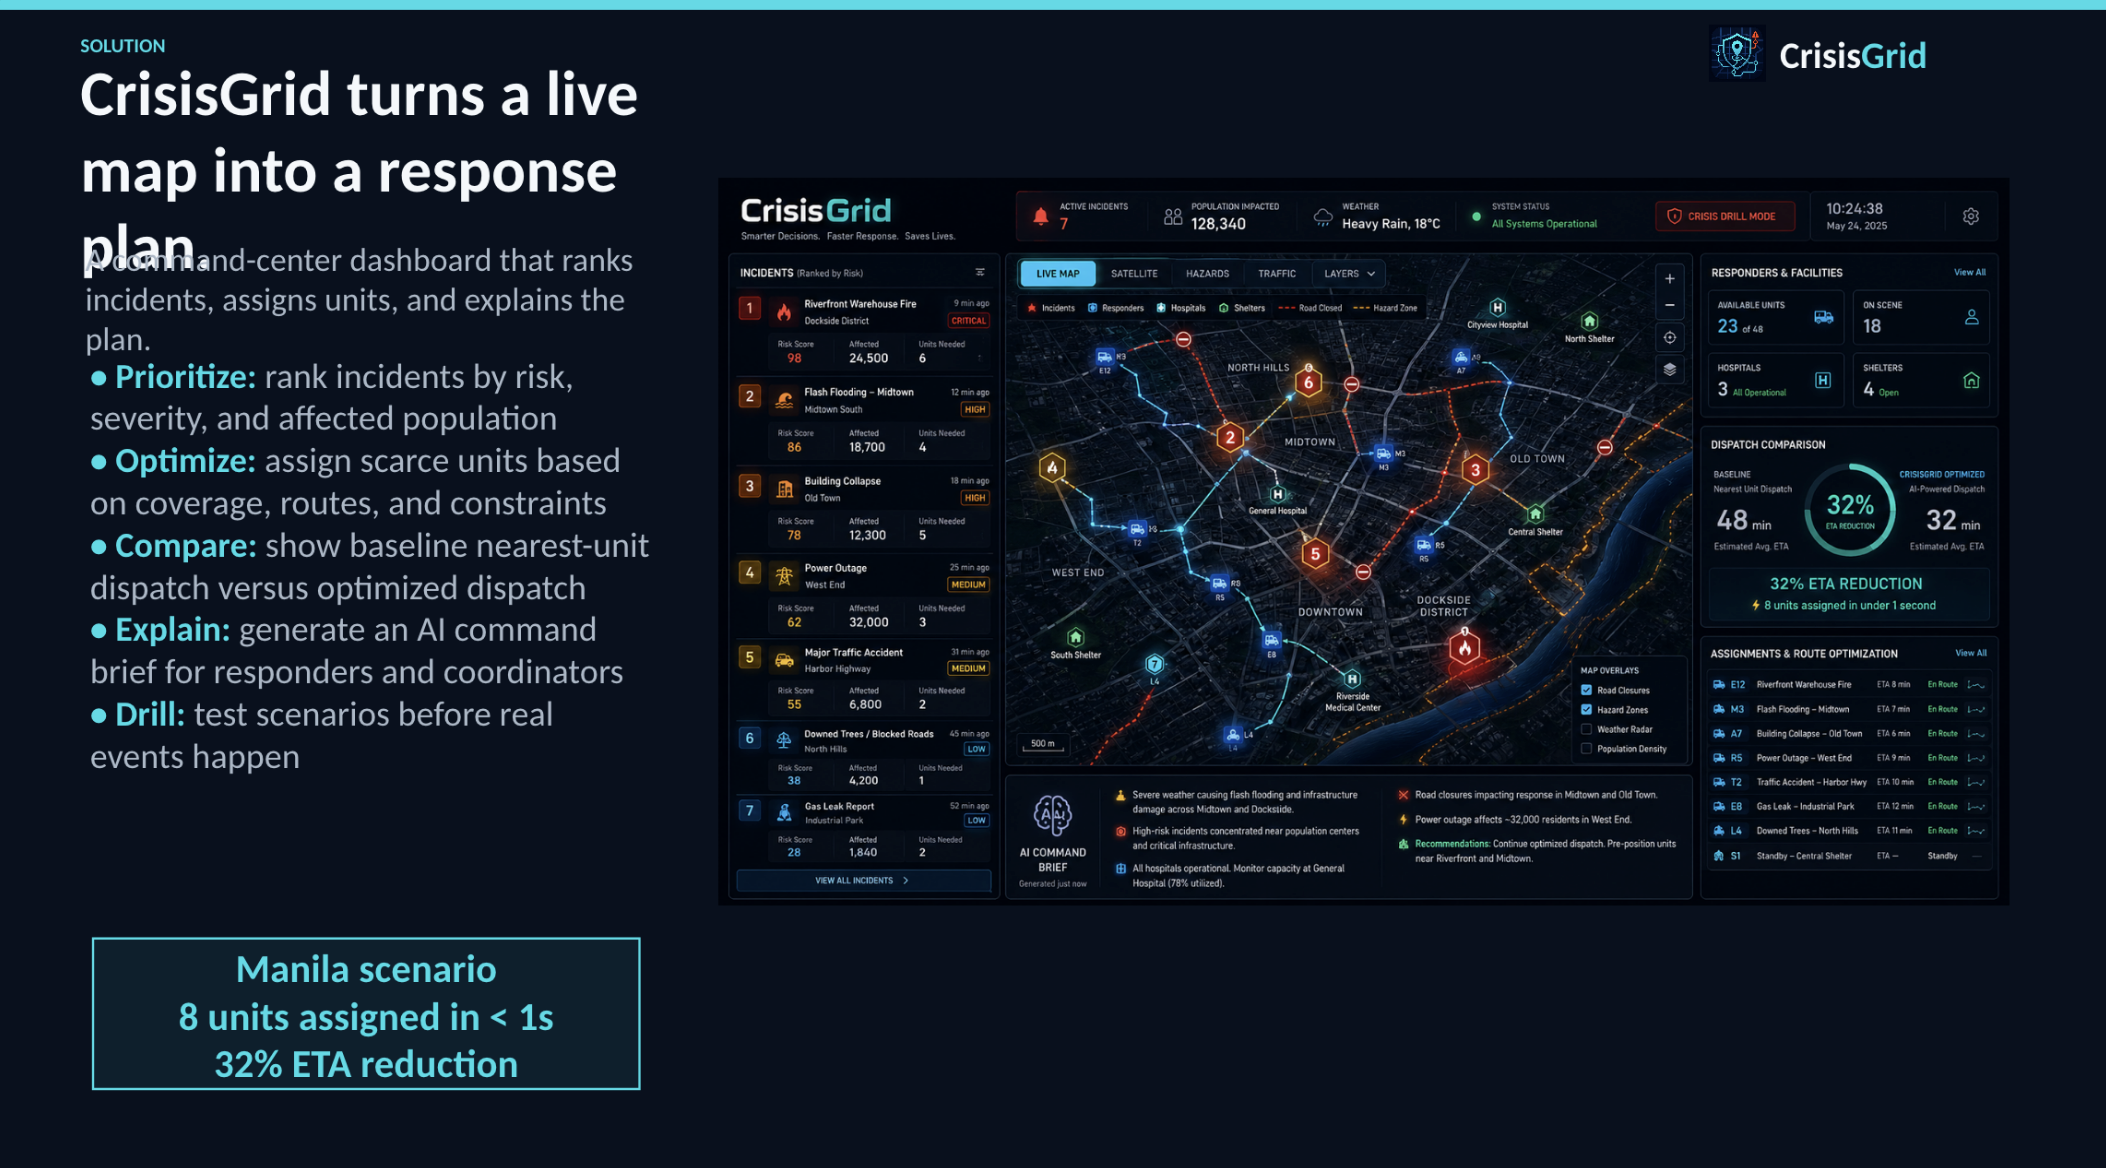
The Solution
-
The Architecture
-
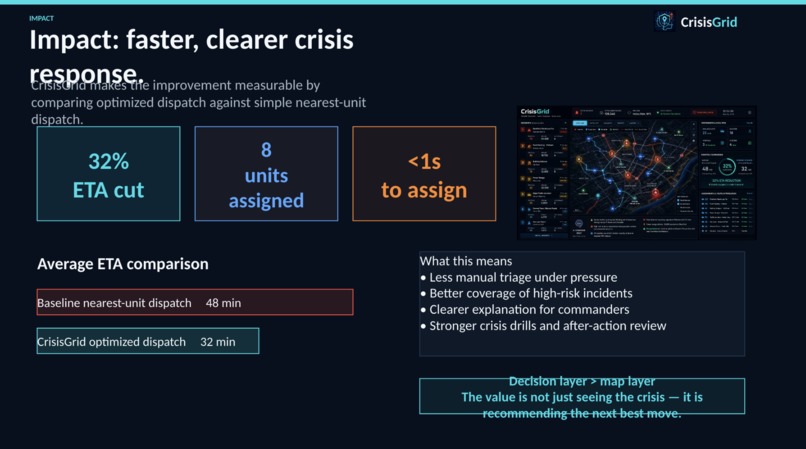
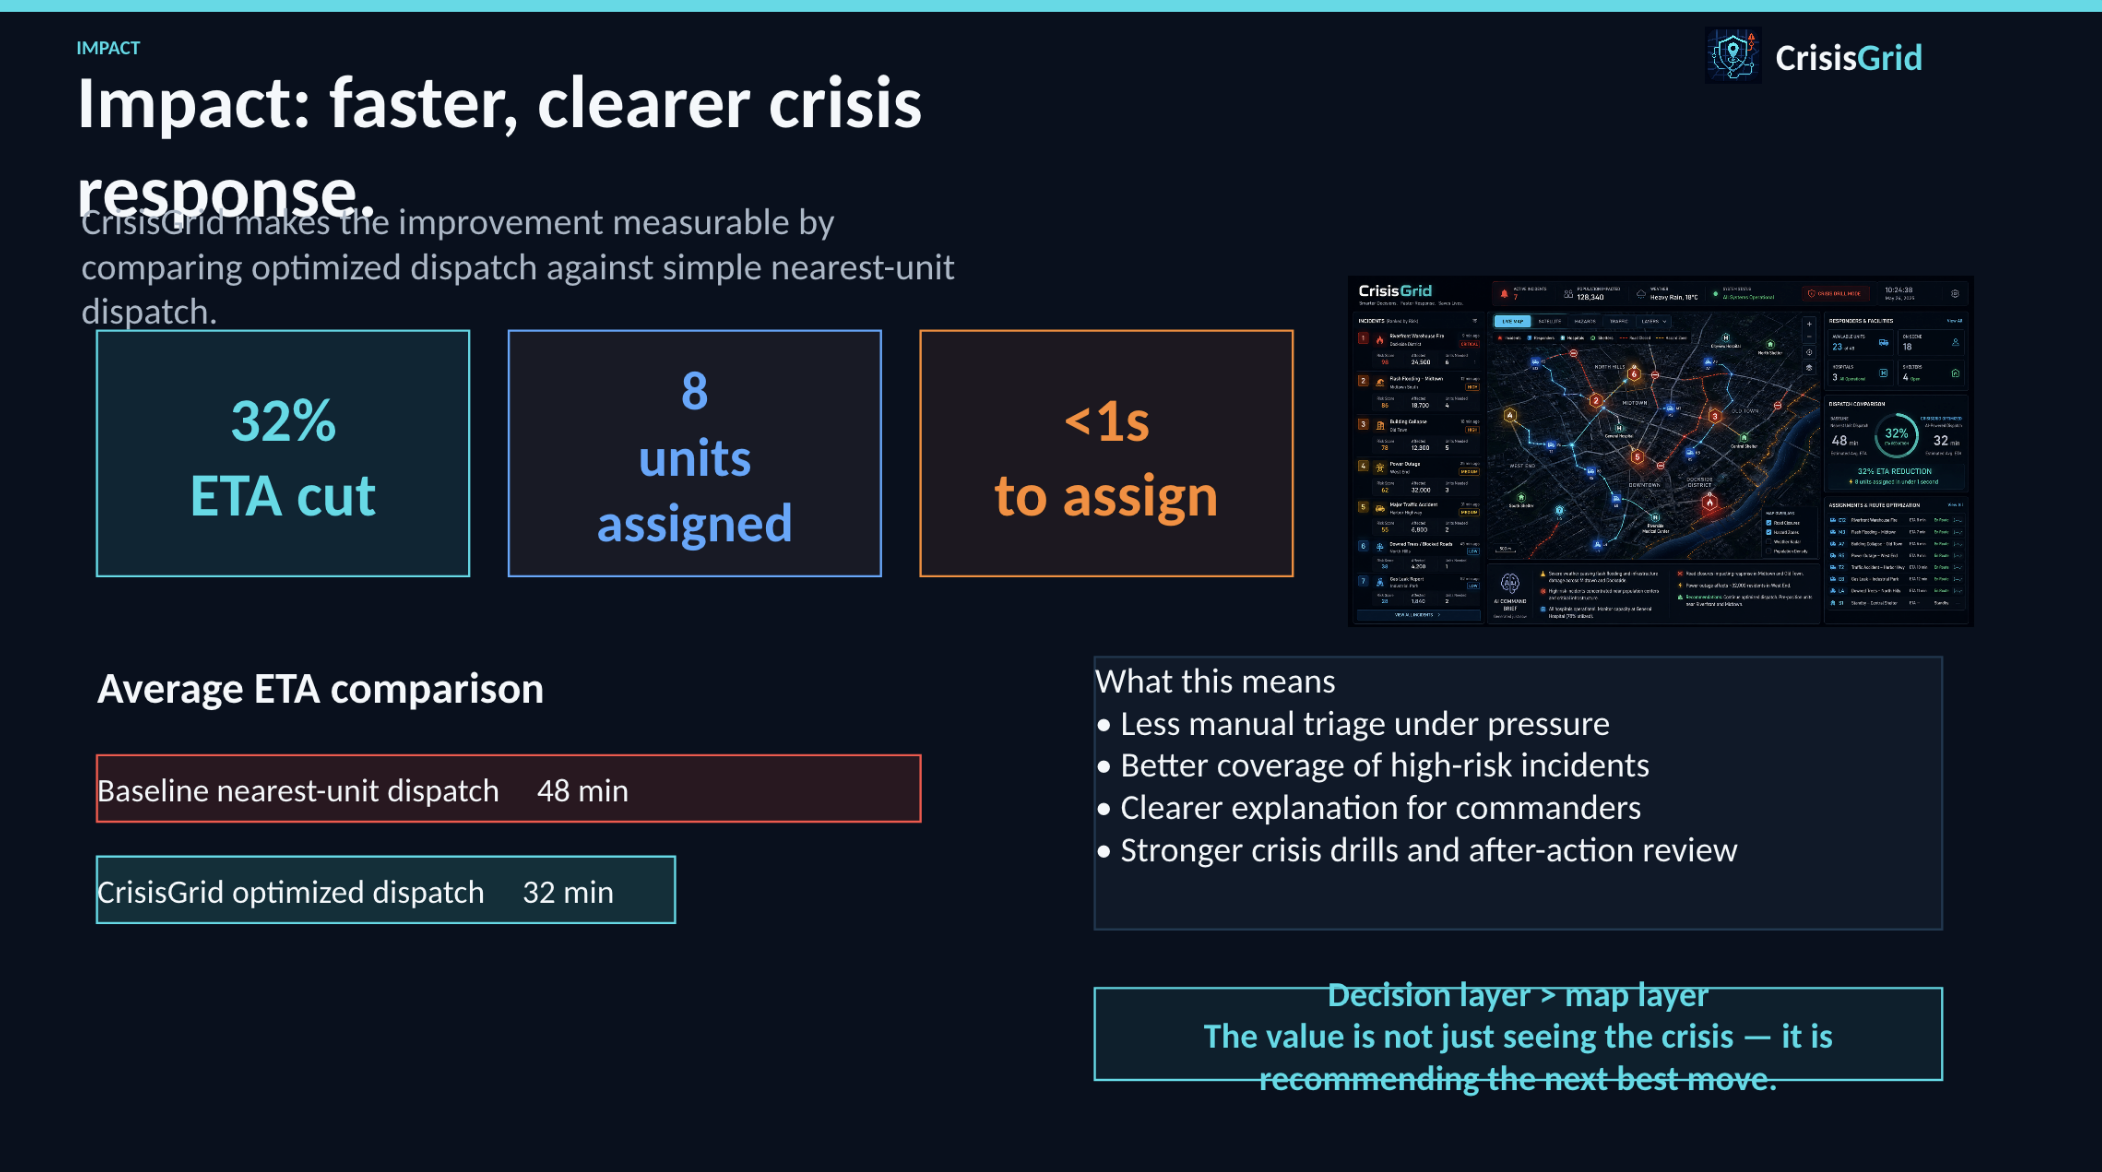
The Impact


Inspiration
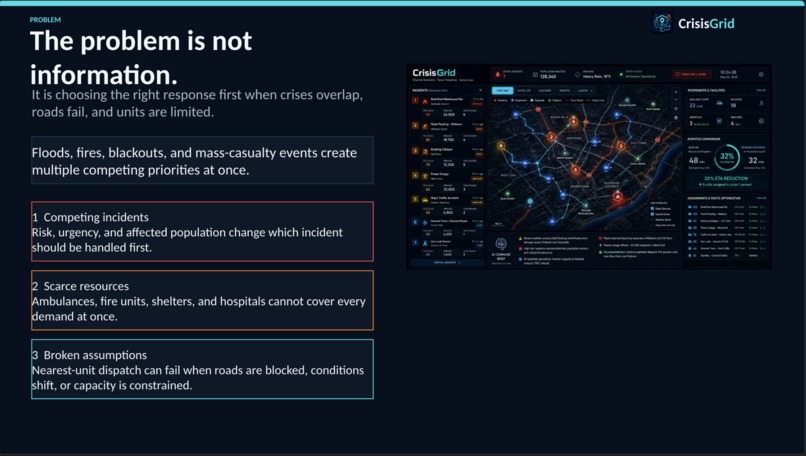
During floods, fires, blackouts, and mass-casualty events, emergency teams rarely suffer from a lack of information. The harder problem is deciding what to do first when resources are limited, roads are disrupted, and multiple incidents compete for attention.
I built CrisisGrid because I wanted to explore the gap between knowing where a crisis is happening and knowing how to respond to it. My goal was to create a command-center tool that helps prioritize incidents, allocate responders, and explain why one response plan is better than simple nearest-unit dispatch.
What it does
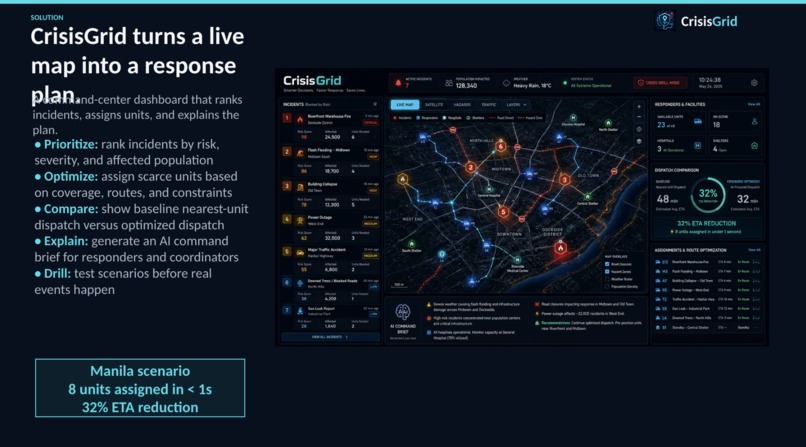
CrisisGrid is an emergency response optimization dashboard for high-risk urban incidents.
It shows a live operational map, ranks incidents by risk and affected population, assigns limited emergency resources, and compares a baseline nearest-resource dispatch against an optimized response plan.
The app highlights:
- highest-risk incidents
- available responders and facilities
- optimized resource routes
- estimated ETA reduction
- people covered by the current plan
- AI-generated command brief for responders
- crisis drill mode for testing response scenarios
In the current Manila crisis scenario, CrisisGrid assigns 8 units in under 1 second and shows a 32% ETA reduction compared with nearest-resource dispatch.
How I built it
I built CrisisGrid as a web-based emergency operations dashboard.
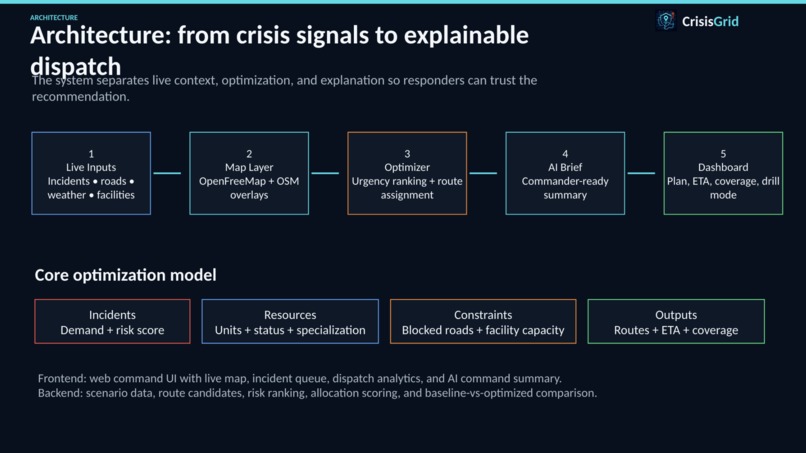
The frontend presents a command-center interface with a live map, incident queue, dispatch analytics, and AI command summary. The map uses OpenFreeMap and OpenStreetMap data with incident, resource, hospital, shelter, and route overlays.
I designed the optimization layer to model incidents, demand, risk, available units, route candidates, and response constraints. Instead of simply assigning the closest unit, CrisisGrid ranks incident urgency and chooses resource movements that improve total coverage and response time.
I also added an AI command brief layer that turns operational data into a short incident commander summary, so decision-makers can understand the situation quickly instead of reading raw tables.
Challenges I ran into
The biggest challenge was making the project feel like an actual decision-support tool instead of a static emergency map.
I had to balance visual clarity with operational density. Judges need to understand the scenario quickly, but the interface also needs enough data to feel credible.
Another challenge was explaining optimization clearly. A 32% ETA reduction is only meaningful if users understand what it is being compared against, so I added baseline-versus-optimized metrics.
Map rendering and responsive layout also needed careful handling. The desktop version is strong, while the mobile navigation still needs refinement because several tabs can overflow horizontally.
Accomplishments that I'm proud of
I am proud that CrisisGrid communicates the core value quickly: it does not just display a crisis, it recommends a better response.
As a solo builder, I built a polished command-center UI with live map context, operational metrics, incident prioritization, route visualization, and an AI command brief.
I am also proud that the app compares optimized dispatch against a baseline. That makes the impact measurable instead of vague.
Most importantly, CrisisGrid feels usable by a real emergency coordinator: it surfaces risk, tradeoffs, scarce resources, and recommended action in one place.
What I learned
I learned that emergency response software needs to be explainable. It is not enough to generate an optimized answer; operators need to know why the system made that recommendation.
I also learned that hackathon demos need a strong story. The technical work matters, but judges must immediately understand the problem, the alternative, and the measurable improvement.
Finally, I learned that maps are powerful, but maps alone are not the product. The real value is the decision layer built on top of the map.
What's next for CrisisGrid
Next, I want CrisisGrid to support real-time incident feeds, live weather APIs, traffic-aware routing, responder status updates, and facility capacity data.
I also want to improve the optimizer with constraints such as blocked roads, responder specialization, hospital load, evacuation capacity, and changing incident severity.
Future versions could support multi-city disaster simulations, after-action reports, and integrations with government emergency operations systems.
Built With
- gemini
- maplibre
- openfreemap
- react
- tailwind
- typescript
- vercel
- vite

Log in or sign up for Devpost to join the conversation.