
CrisisFlow: Market Microstructure Regime Classifier
Inspiration
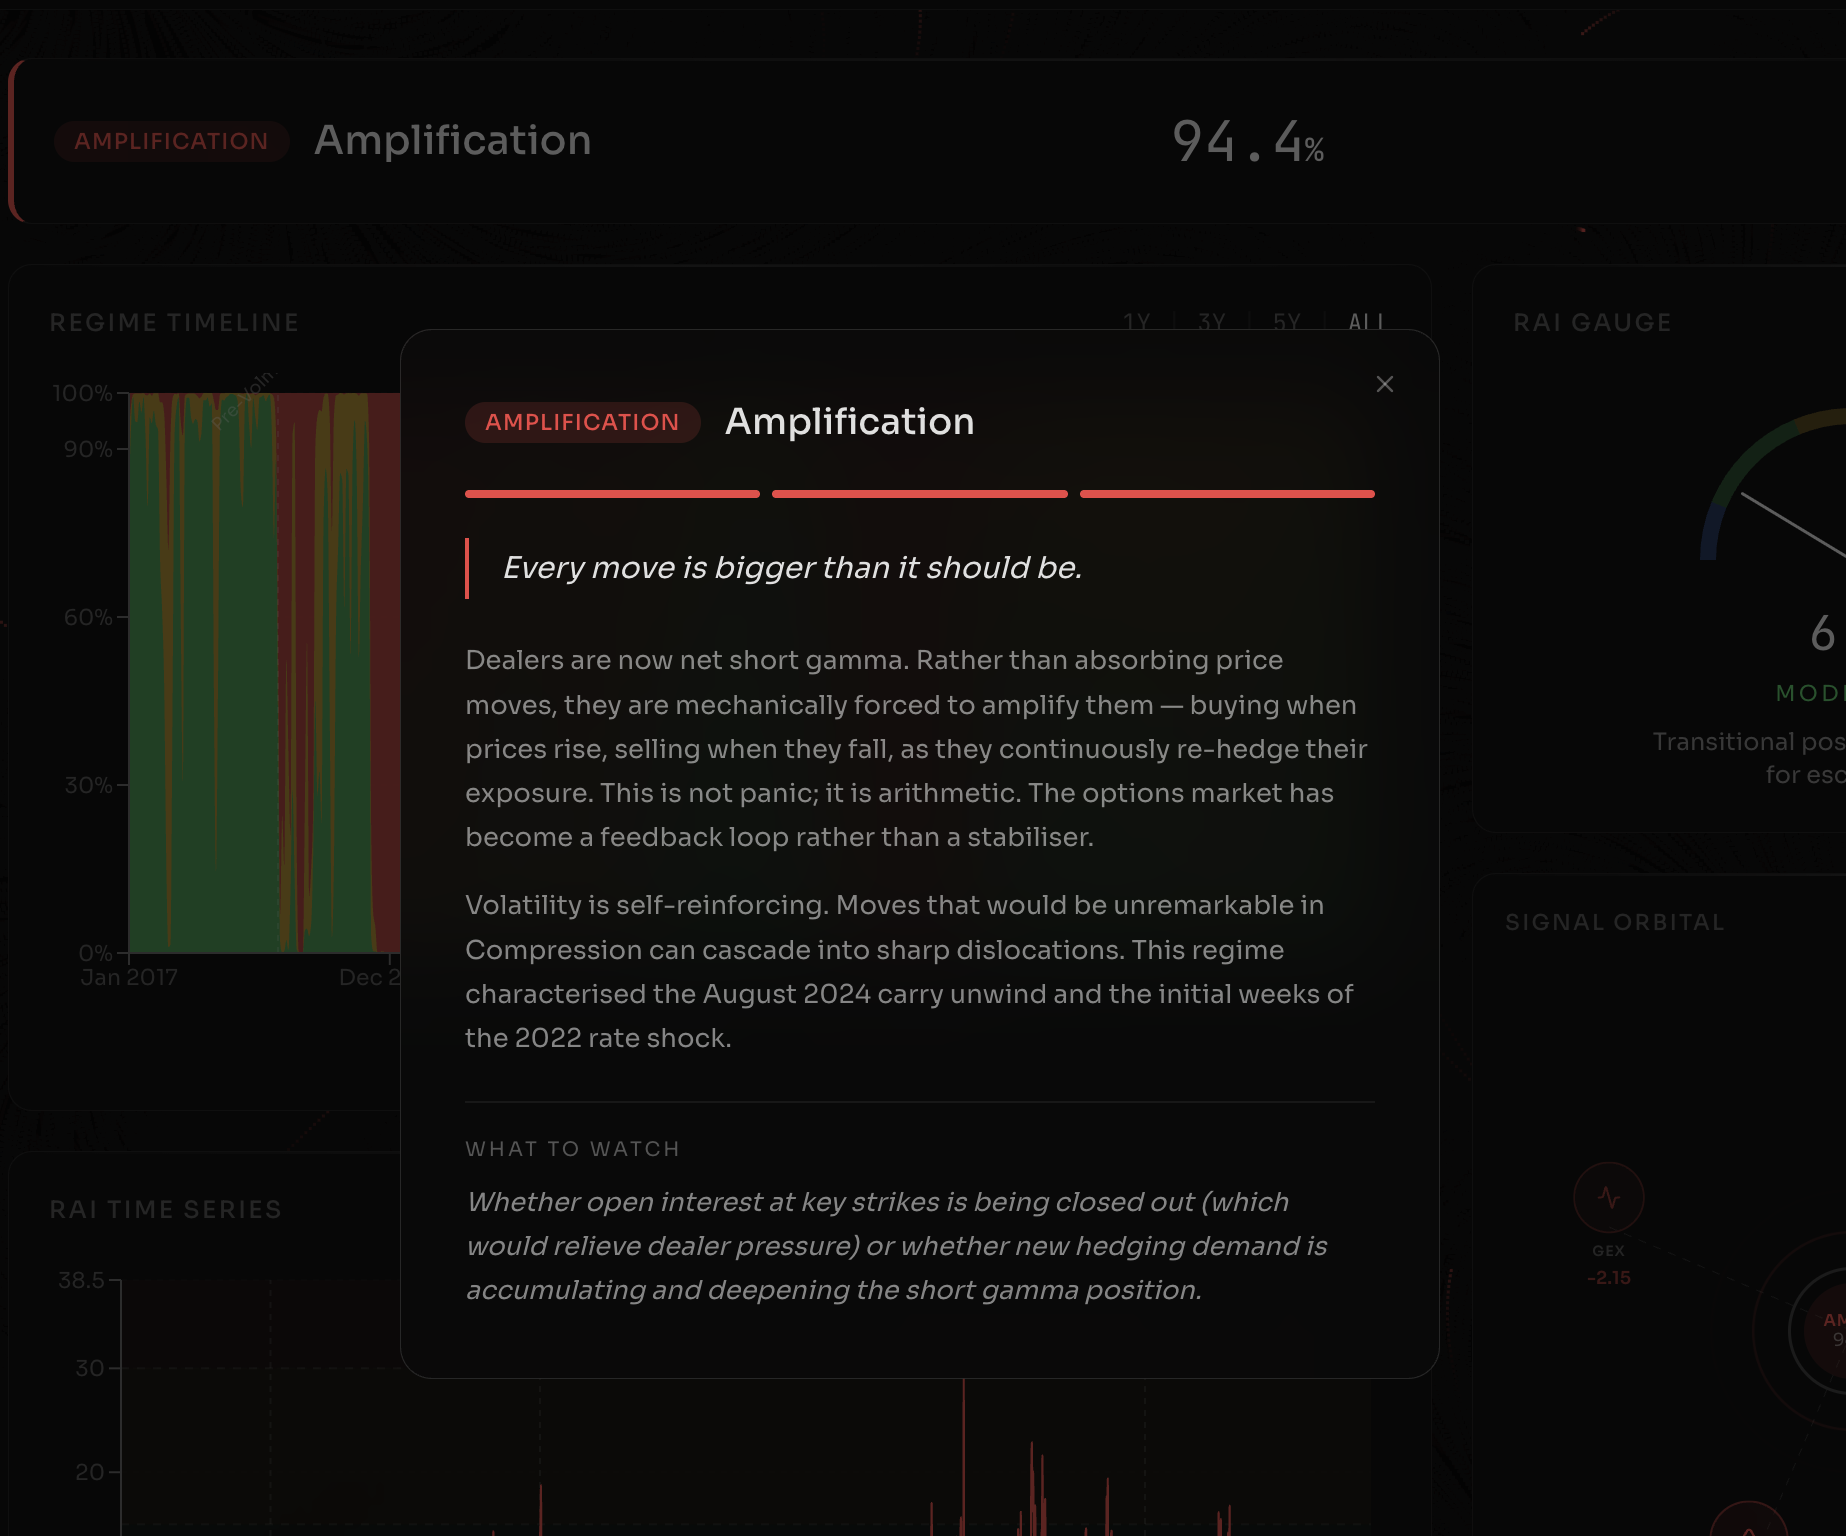
When dealers go short gamma, they are contractually forced to chase market moves — buying as prices rise, selling as they fall. This mechanical feedback turns a 2% selloff into a 10% cascade. We wanted to build something that detects when this structural condition is active before it triggers — not a crash detector, but a fragility detector.
What We Built
CrisisFlow is a real-time market microstructure regime classifier built on an Input-Output Hidden Markov Model (IO-HMM). It classifies daily market conditions into three structural regimes — Compression, Transition, and Amplification — and outputs a novel composite statistic: the Regime Amplification Index (RAI).
RAI formula:
$$RAI_t = \left(\sum_{k \geq K/2} P(S_t = k \mid x_{1:t})\right) \times \frac{\max!\left(0,\ \frac{|GEX_t|}{10^6}\right)}{VIX_t} \times 100$$
Where:
- \(\sum_{k \geq K/2} P(S_t = k \mid x_{1:t})\) — forward filter posterior summed over the upper half of states (Transition + Amplification for K=3)
- \(\max(0,\ |GEX_t| / 10^6)\) — absolute dealer gamma exposure scaled to millions; extreme positioning in either direction signals structural sensitivity
- \(VIX_t\) — normalises for current vol level; same GEX is more anomalous in a low-vol environment
The key innovation over a standard HMM is the input-output transition network: instead of a fixed transition matrix, we parameterise it as a softmax linear layer conditioned on the current signal vector. This means the probability of transitioning from Compression to Amplification is dynamic — it changes every day based on live market conditions.
Signals
All data is free via yfinance:
| Signal | Formula | Interpretation |
|---|---|---|
| GEX proxy | \(-\text{term_slope} \times 10^6\) | Net dealer gamma exposure (historical proxy) |
| VVIX/VIX ratio | \(VVIX_t / VIX_t\) | Institutional vol-of-vol demand |
| Term structure slope | \((VIX3M - VIX) / VIX\) | Negative = backwardation = stress |
| SKEW norm | \((SKEW - 100) / 10\) | Tail risk / downside hedging demand |
The RAI is a Leading Indicator
The RAI detects structural fragility before crashes — not during. During acute crashes, VIX spikes faster than VVIX, collapsing the VVIX/VIX ratio and sending RAI near zero. This is by design, not a model failure.
| Signal Date | Event | RAI | What Followed |
|---|---|---|---|
| 29 Jan 2020 | Pre-COVID Signal | 13.7 MODERATE | COVID crash — 7 weeks later |
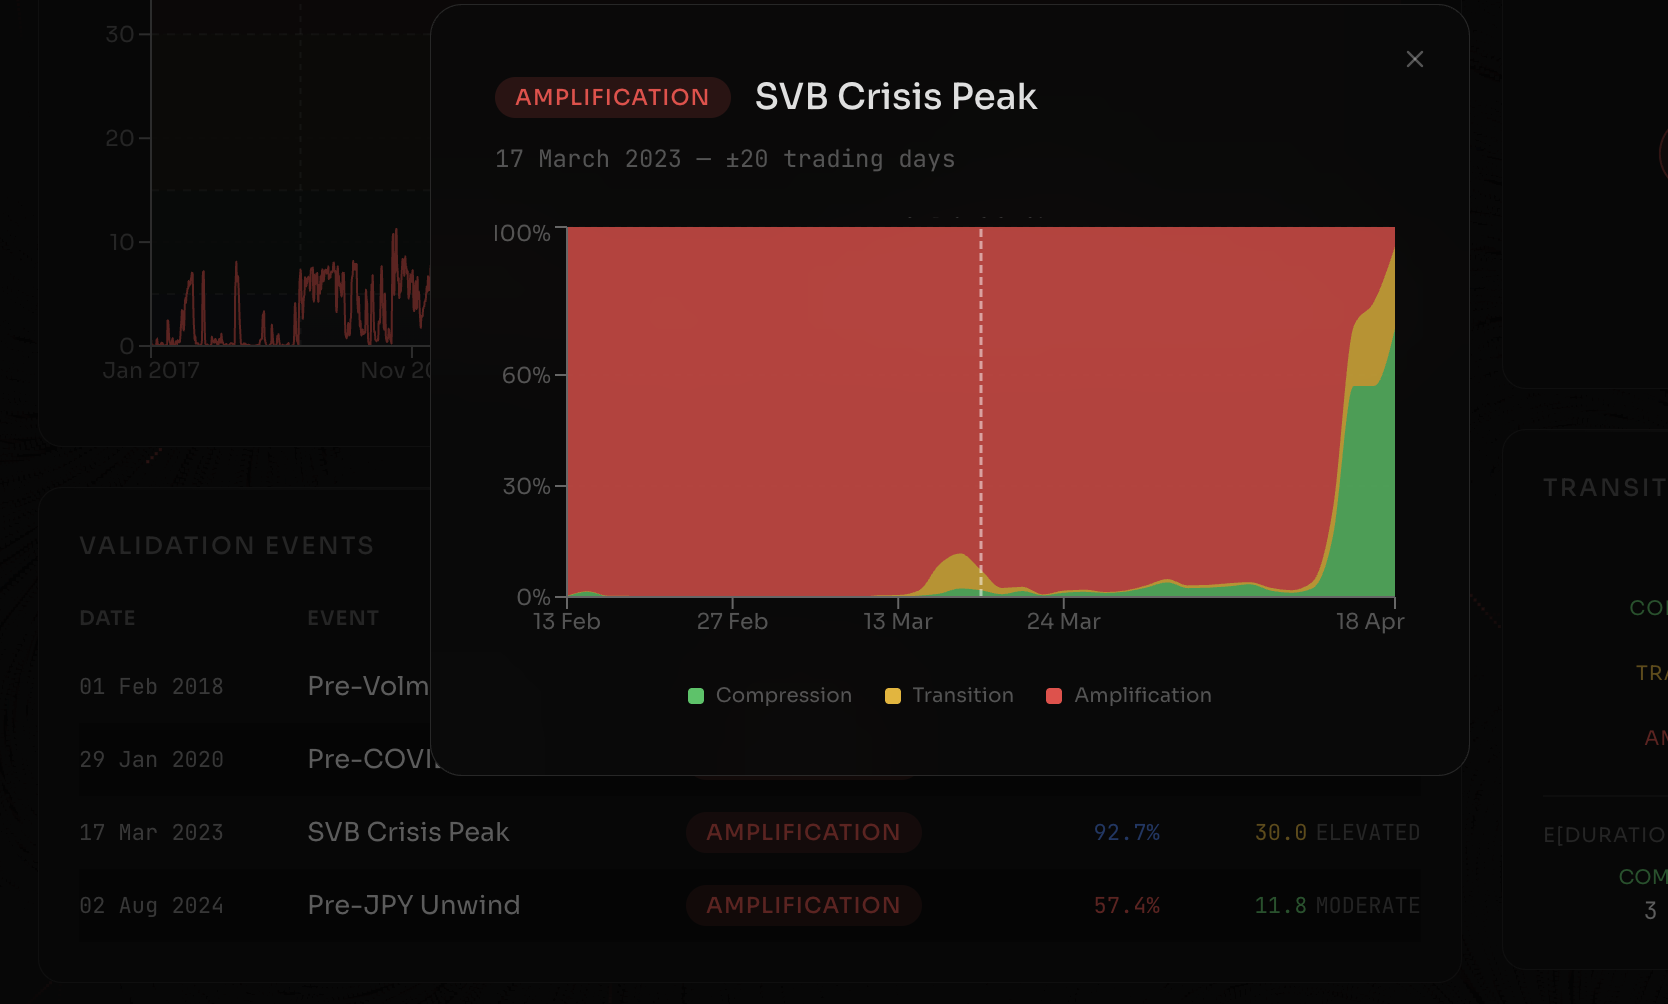
| 17 Mar 2023 | SVB/Credit Suisse Crisis | 29.98 ELEVATED | Peak banking crisis — highest RAI in dataset |
| 02 Aug 2024 | Pre-JPY Carry Unwind | 11.8 MODERATE | VIX spiked to 38.6 — next day |
"We detect the tinderbox, not the spark."
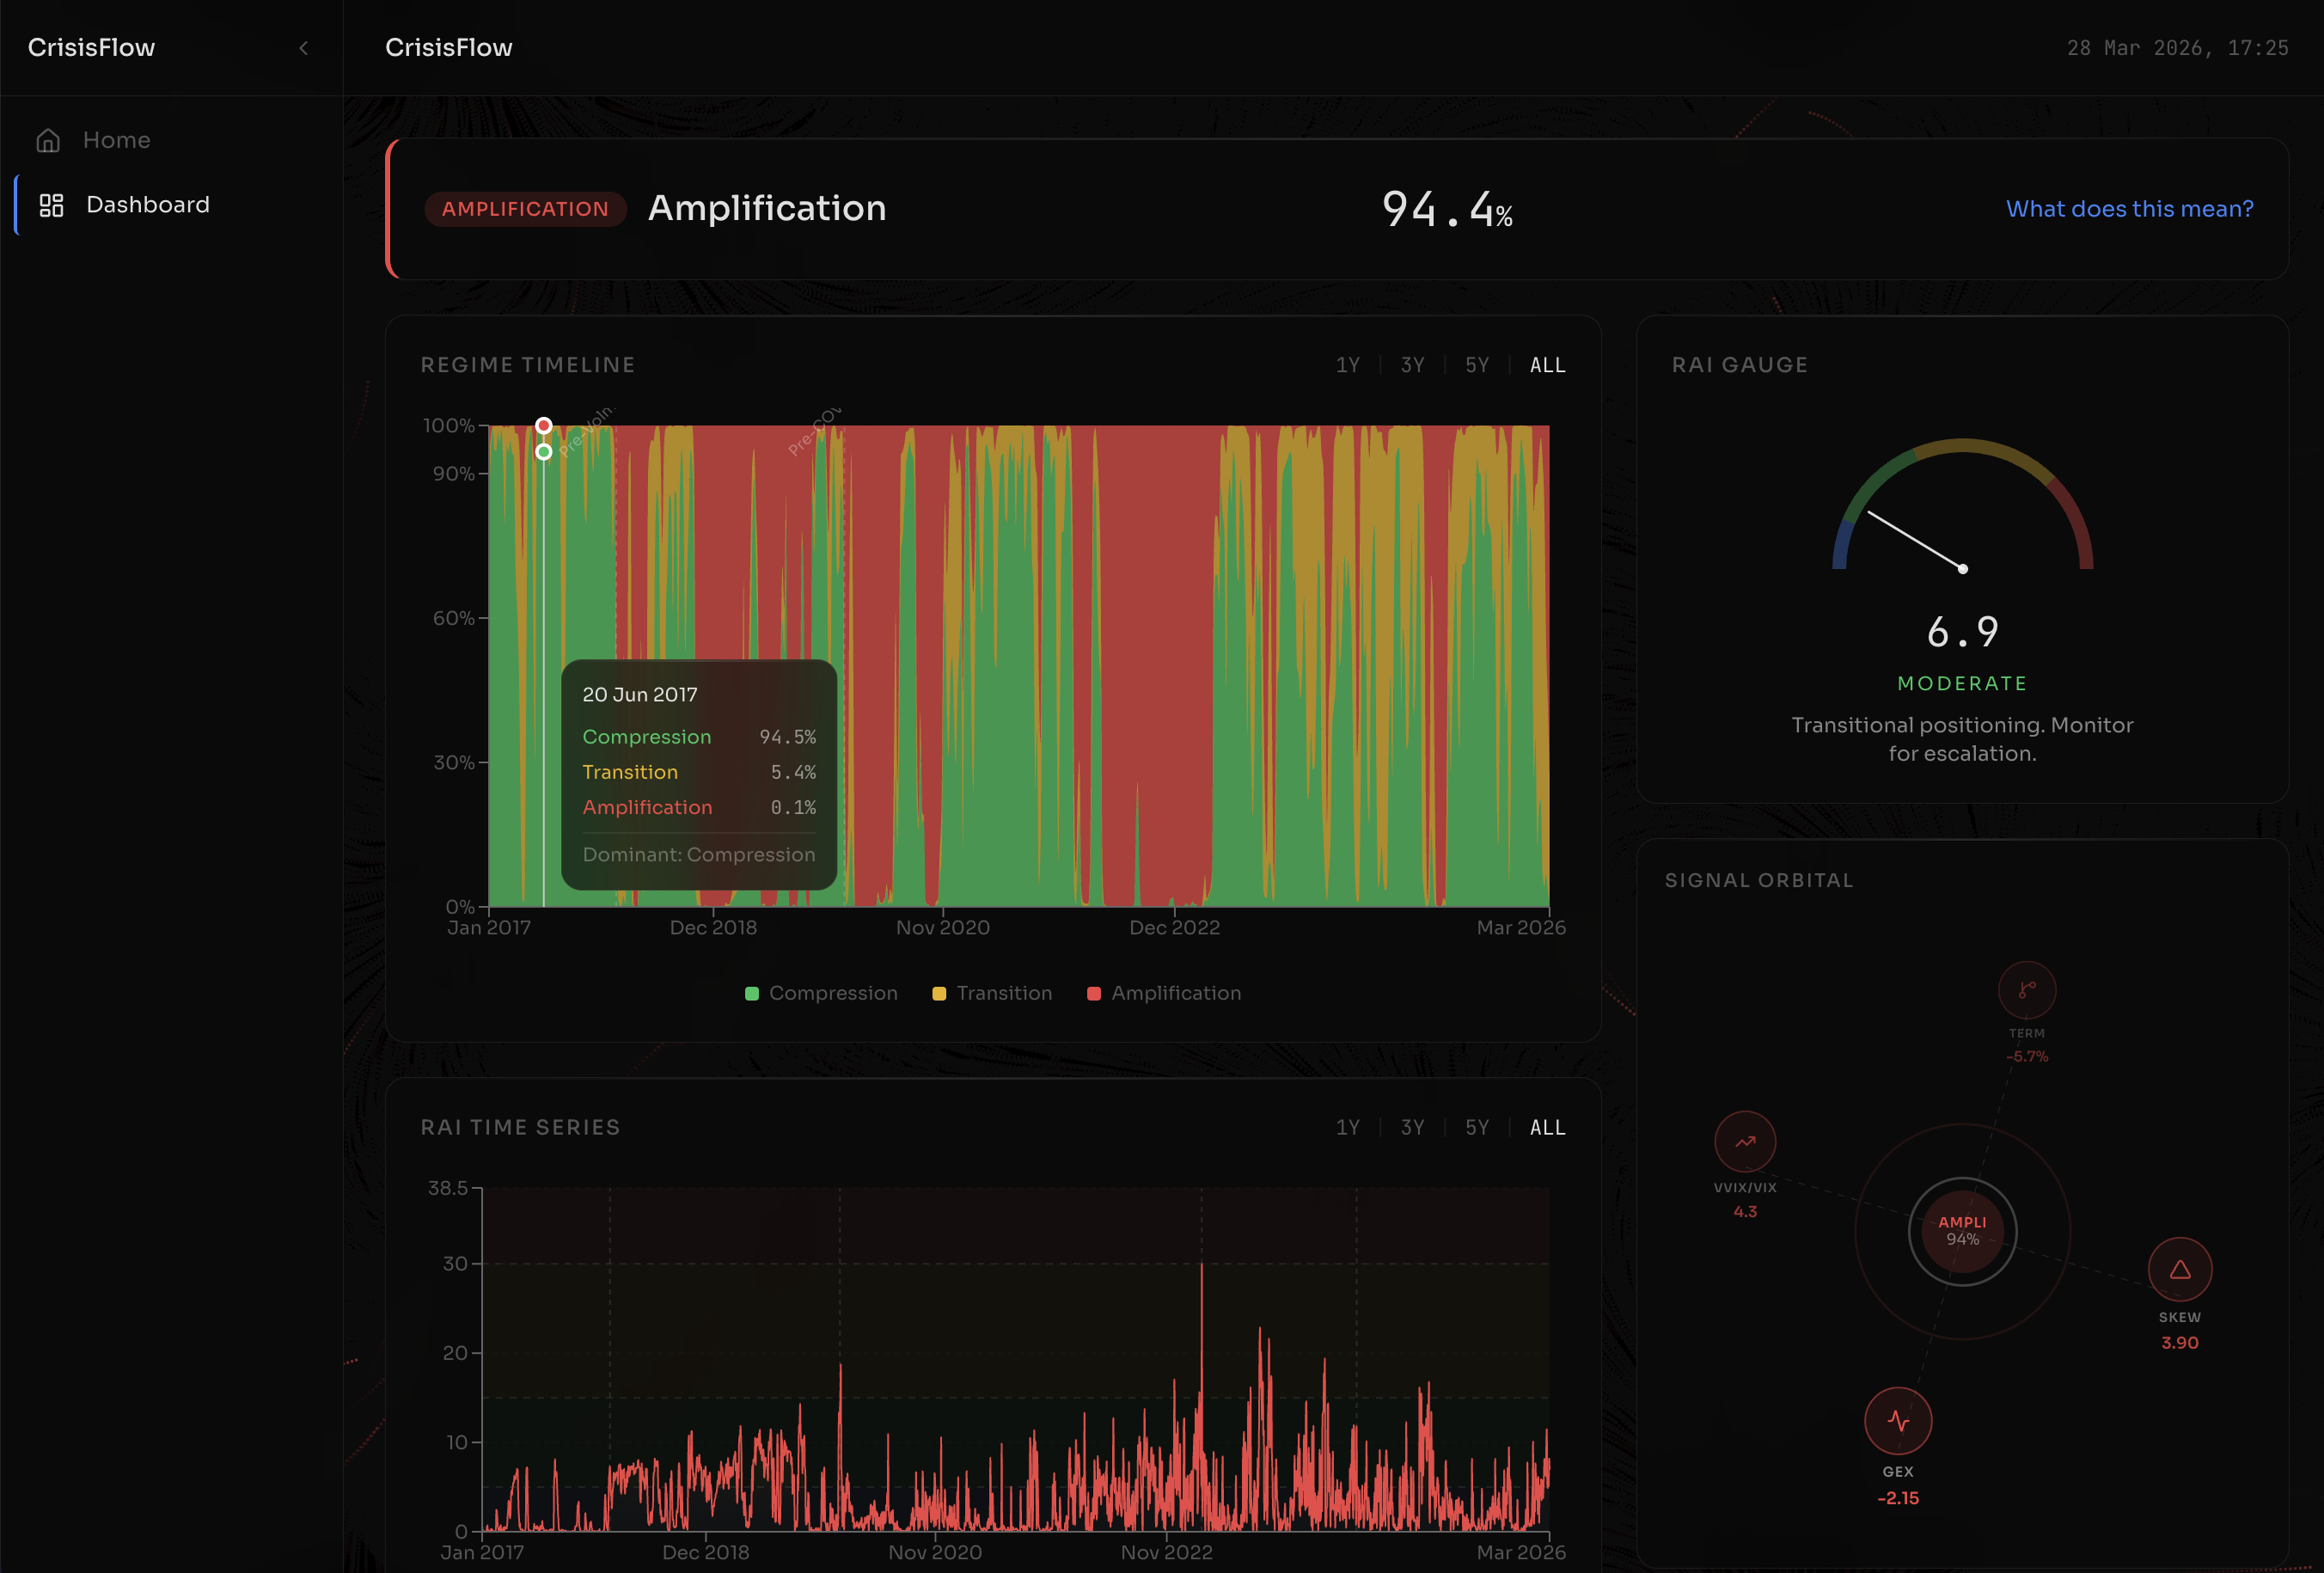
Live Reading — 28 March 2026
| Metric | Value |
|---|---|
| Current regime | Amplification (94.4% confidence) |
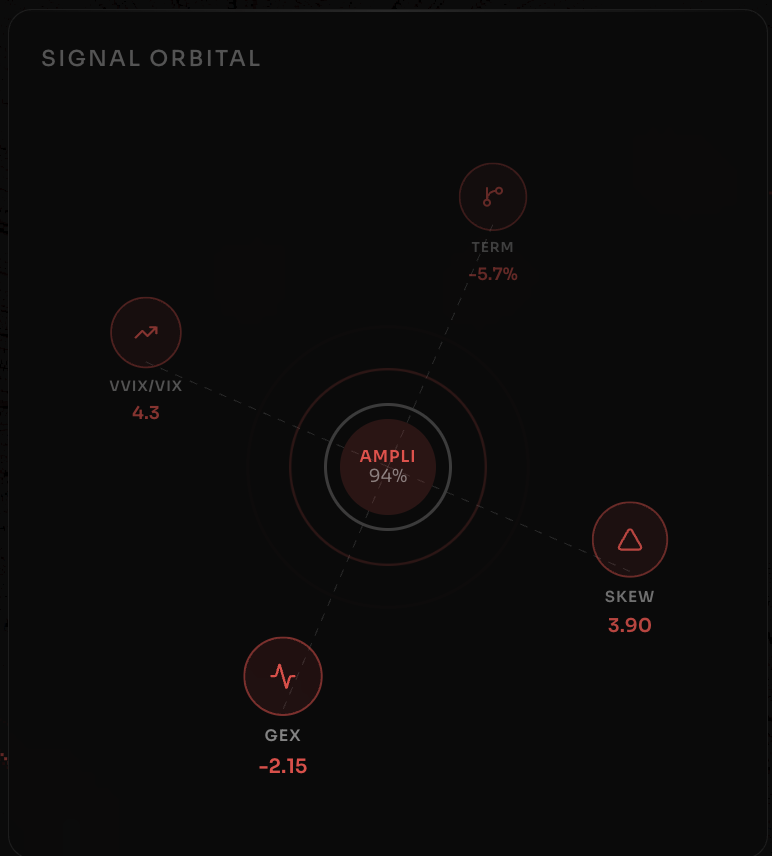
| Live GEX | −$2.15B (dealers net short gamma) |
| Term structure | −5.7% inverted |
| RAI | 6.9 — MODERATE |
| Compression → Amplification today | 56.3% vs 13.5% baseline = 4.2× elevated |
How We Built It
Built in one day at QuantiHack 2026.
# IO-HMM: transition matrix conditioned on live signals
A_t = softmax(W_A @ x_t + b_A)  # Dynamic, not fixed

# Forward filter — strictly causal
log_alpha_t = log_emission(x_t) + logsumexp(log_alpha[t-1] + log(A_t))

# RAI
stress_posterior = sum(posteriors[t, K//2:])
rai = stress_posterior * max(0, abs(gex) / 1e6) / vix * 100
- IO-HMM implemented in PyTorch, trained with Adam optimiser (500 iterations)
- BIC model selection over K = 2, 3, 4 — selected K = 3
- Strict causality: forward filter (alpha-pass only) — Viterbi used for visualisation only
- Training split: 2017–2024 train, 2024–2025 out-of-sample test
- Dashboard: React frontend with live signal polling
Challenges
- Historical GEX is not freely available — approximated from VIX term structure inversion, introducing correlation with the term slope signal
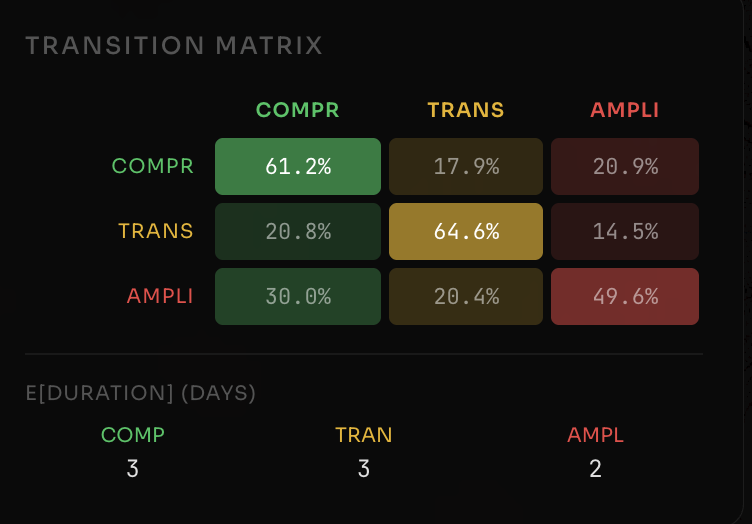
- Regime persistence lower than production — daily data yields 2–3 day expected durations vs. weeks for intraday data
- VVIX/VIX collapses during crashes — RAI correctly goes near-zero during acute stress, which is counterintuitive but mechanically correct. The RAI is a leading not coincident indicator
- RAI stress posterior sums upper K//2 states (Transition + Amplification) — this broadens sensitivity but means moderate Transition days also contribute
What We Learned
The most important insight: regime classifiers should be evaluated on their leading properties, not coincident accuracy. A model that fires during a crash is useless — a model that detects the tinderbox before the spark is actionable.
The literature (Barbon & Buraschi 2021, Park 2013 Fed Reserve) confirms: negative dealer GEX predicts crash severity, not timing. The RAI formalises this as a composite statistic — no published work combines HMM posteriors with dealer GEX into a single index. This is a genuine research gap.
What's Next
- Real options chain data for true GEX (replacing the term slope proxy)
- Intraday resolution for longer regime persistence
- Condition GEX directly into the IO-HMM transition network (Ang & Bekaert TVTP framework)
- Extend signals to credit spreads and systematic fund flow data
- Factorial HMM: separate chains for vol-of-vol, term structure, and skew regimes

Log in or sign up for Devpost to join the conversation.