-
-
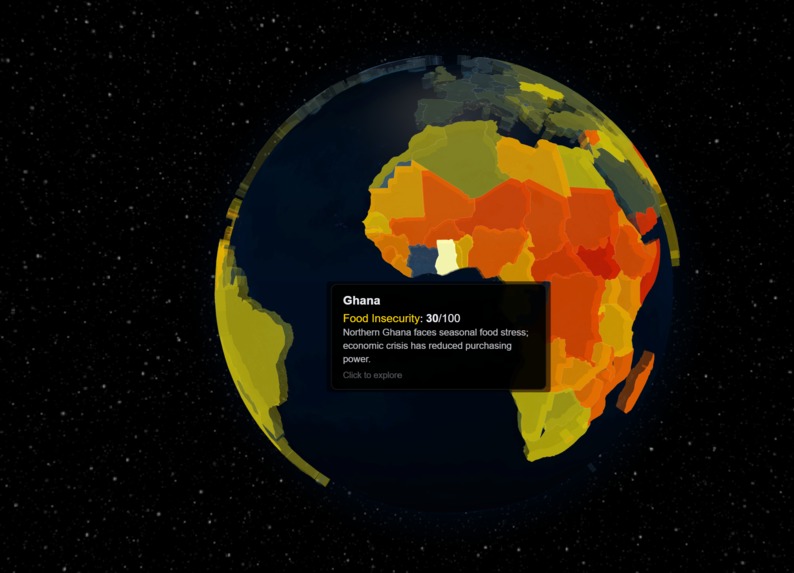
Food-Security of Ghana
-
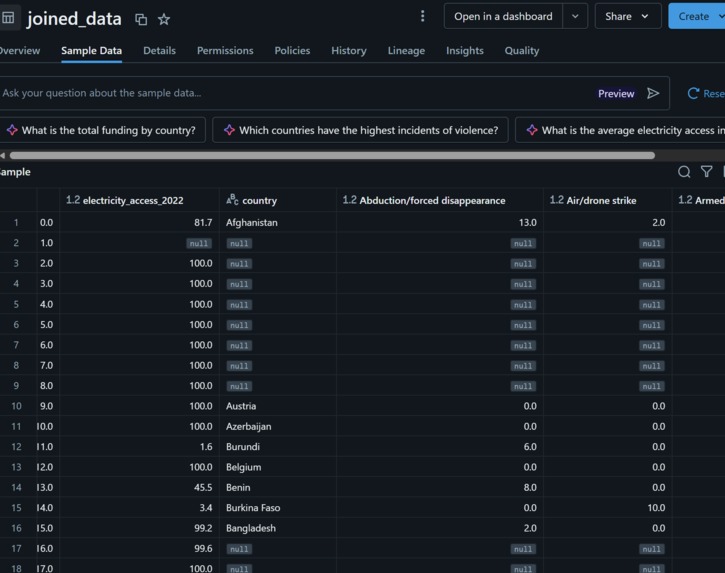
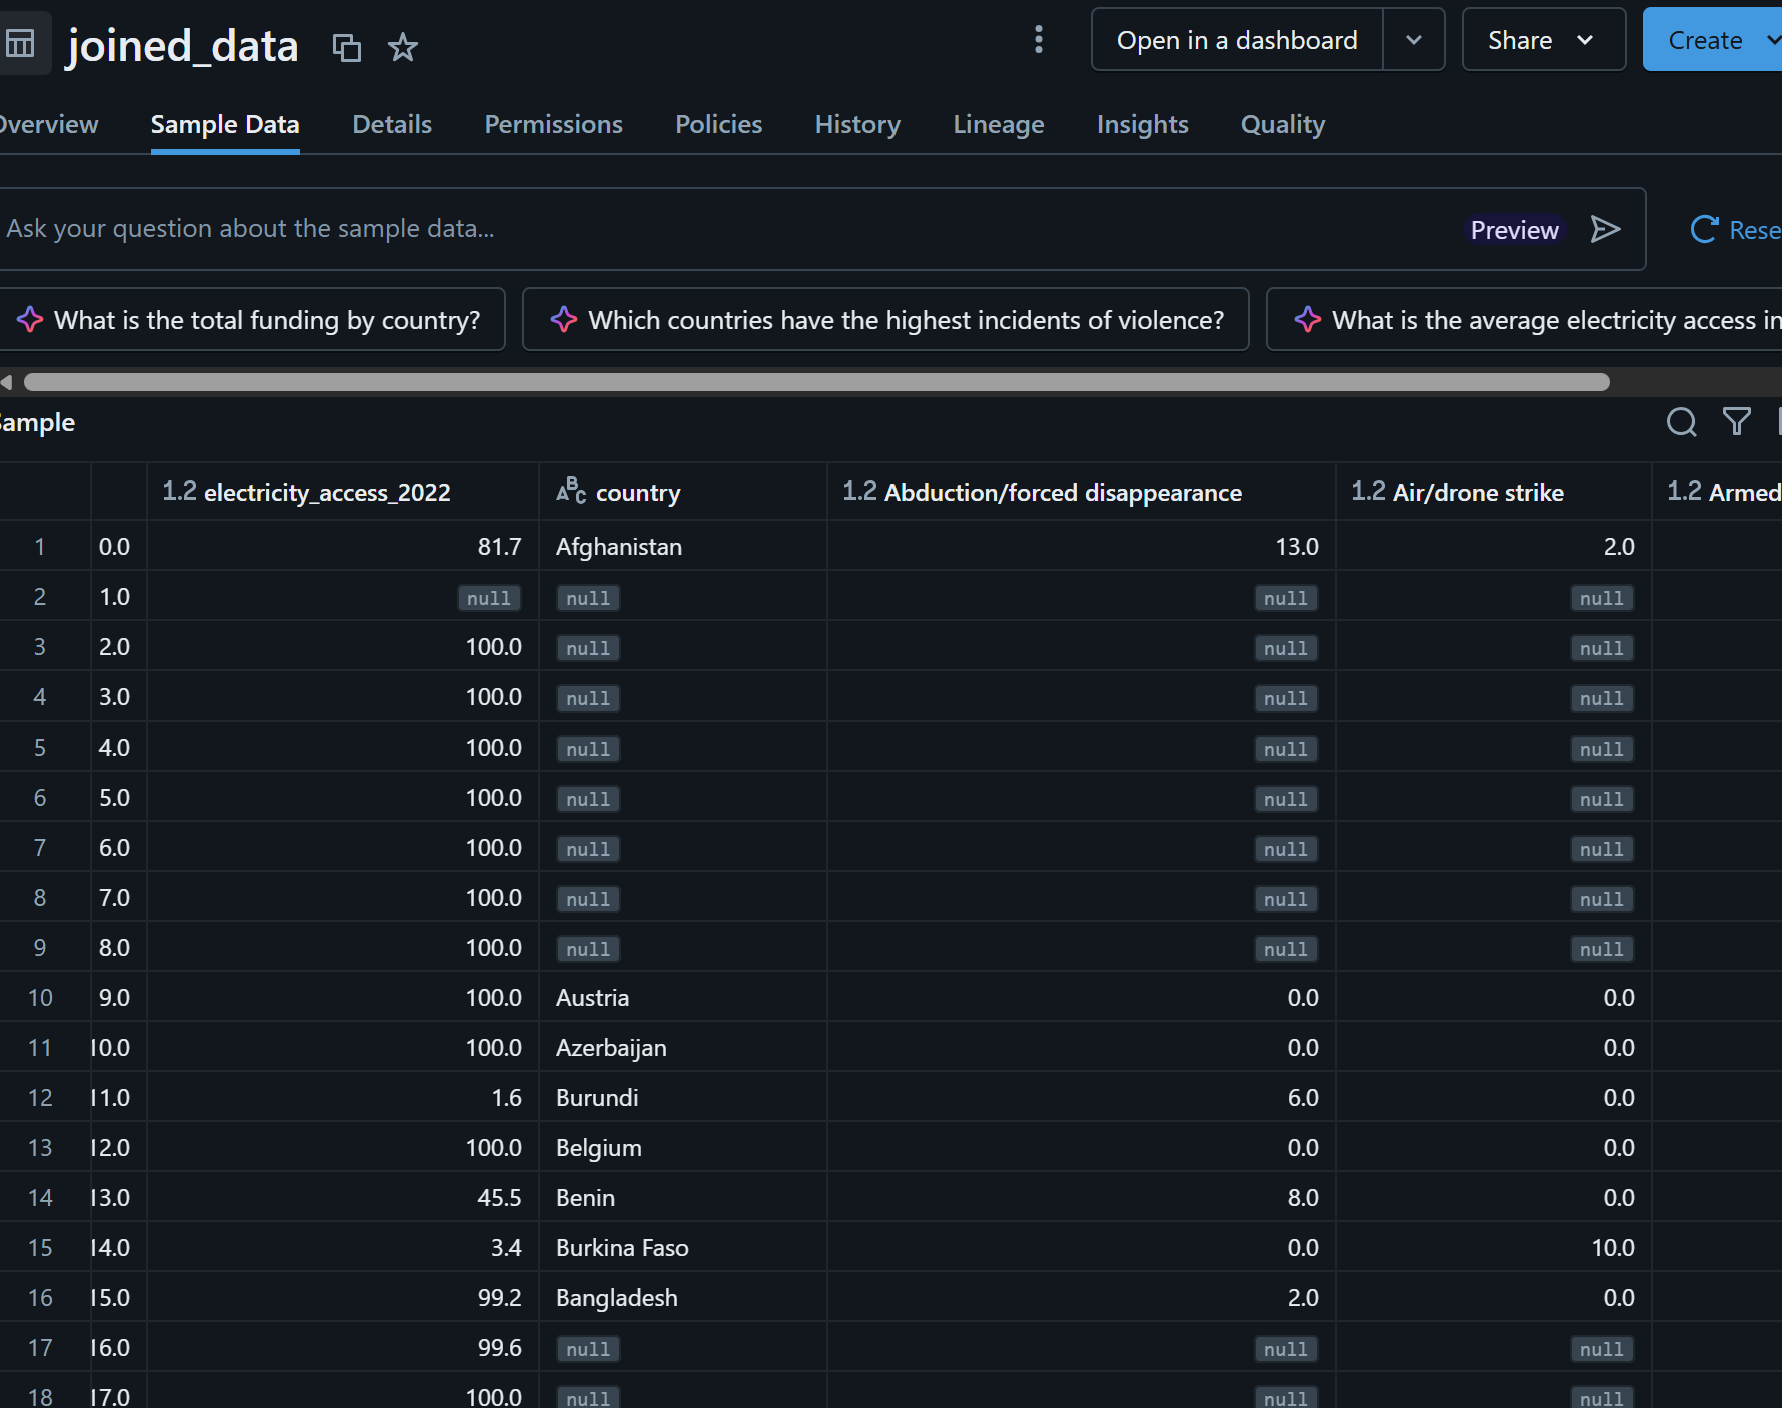
Learning about SQL: a messy dataset on DataBricks

Inspiration
We were inspired by the overwhelming amount of global conflict and humanitarian crisis data that exists today, yet remains inaccessible or fragmented for most people. Although organizations collect valuable datasets such as ACLED and humanitarian funding reports, it is difficult for the public to follow this csv and hard-to-comprehend data to real-time events and meaningful solutions.
So, we wanted to build a platform that bridged the gap between raw data, breaking news, and actionable insights. This was VidePax. By combining structured datasets processed by Databricks with live news extraction using the Gemini API, we envisioned a tool that doesn’t just show statistics, but helps people understand crisis issues like poverty, conflict, disease, food security, and climate in a country right now and why it matters.
As first-time hackathon participants, we were also motivated by the opportunity to challenge ourselves technically and socially, building something that integrates data engineering, AI, and social impact into one unified platform. Needless to say, we had a lot of fun working with tools and engineering VidePax today.
What it does
  Our app visualizes humanitarian crises across the globe, covering food insecurity, poverty, conflict, climate, and disease. On the taskbar, clicking any issue highlights the affected countries on the globe, with darker shading indicating greater severity. Selecting a country brings up more detailed information about that specific crisis.
  When nothing is selected, the globe shows an aggregate view where shading reflects both the number of issues and their combined severity, making it easy to identify the most burdened nations.
We also look at how much funding each country receives and compare it to how many crises it is dealing with. A country facing multiple severe crises but receiving little aid is clearly not getting enough support, while a country with fewer problems and more funding is in a much better position. This imbalance is reflected directly on the globe through our disparity indicator, where countries with a greater gap between their need and the aid they receive are shaded darker. This makes it easy to spot at a glance which countries are being left behind despite their level of need.
How we built it
  We built the app using a combination of modern data and web technologies. Our data was sourced primarily from ACLED and several other databases, then cleaned and processed using Databricks, which made it easy to format and export as CSV files. For up to date news, we integrated Gemini AI to pull recent articles into our news tab.
  The globe itself is powered by Globe.gl, and the rest of the frontend was built using JavaScript, React, and Node, bringing everything together into the interactive experience that we have created.
Challenges we ran into
  Working with data at this scale was new for all of us, and it came with some challenges. The sheer volume made it difficult to process, and our computers often struggled just to download it. Databricks helped us get past this by giving us a shared environment to collaborate and handle the cleaning and processing together.
   As this was our first hackathon, we also underestimated how long development actually takes, and ended up working through the night to get it done. It was a good reminder of how much we can get done when we push through.
Accomplishments that we're proud of
We were proud of being able to integrate a lot of technologies into this project, using Gemini API for current breaking news extraction and using Databricks for code processing, cleaning, and efficient data governance. We're very proud of the social impact potential this project has created, providing viable, up-to-date, and solution-oriented information to everyone.
What we learned
All of us were completely new to Databricks, but eventually we were able to effectively manage the application, compiling and conjoining files as a team, and applying Gemini API to find current breaking-news coverage about our selected country! Additionally, this was all of our team members' first hackathon. It was very interesting to learn development processes, with our team split into working on back-end and front-end and using tools like javascript, react, node, databricks, prominent csv tools and datasets like acled. We all had a lot of fun working as a developer team.
What's next for VidePax
After the hackathon, there are many ways to flesh out VidePax, but we think the best way is to focus on solutions based on each country's problems. Finding implementation strategies after injecting a variable amount of money into a country is important, but to make this project real, it would be ideal to contact government officials, citizens, and resource holders to implement efficient strategy and forward the development of many countries. We hope to make use of all the data we accumulated to train an ML model to help with countries with overlooked disparity scores.
Built With
- acled
- css
- databricks
- humdata
- javascript
- node.js
- react
- vite


Log in or sign up for Devpost to join the conversation.