Inspiration
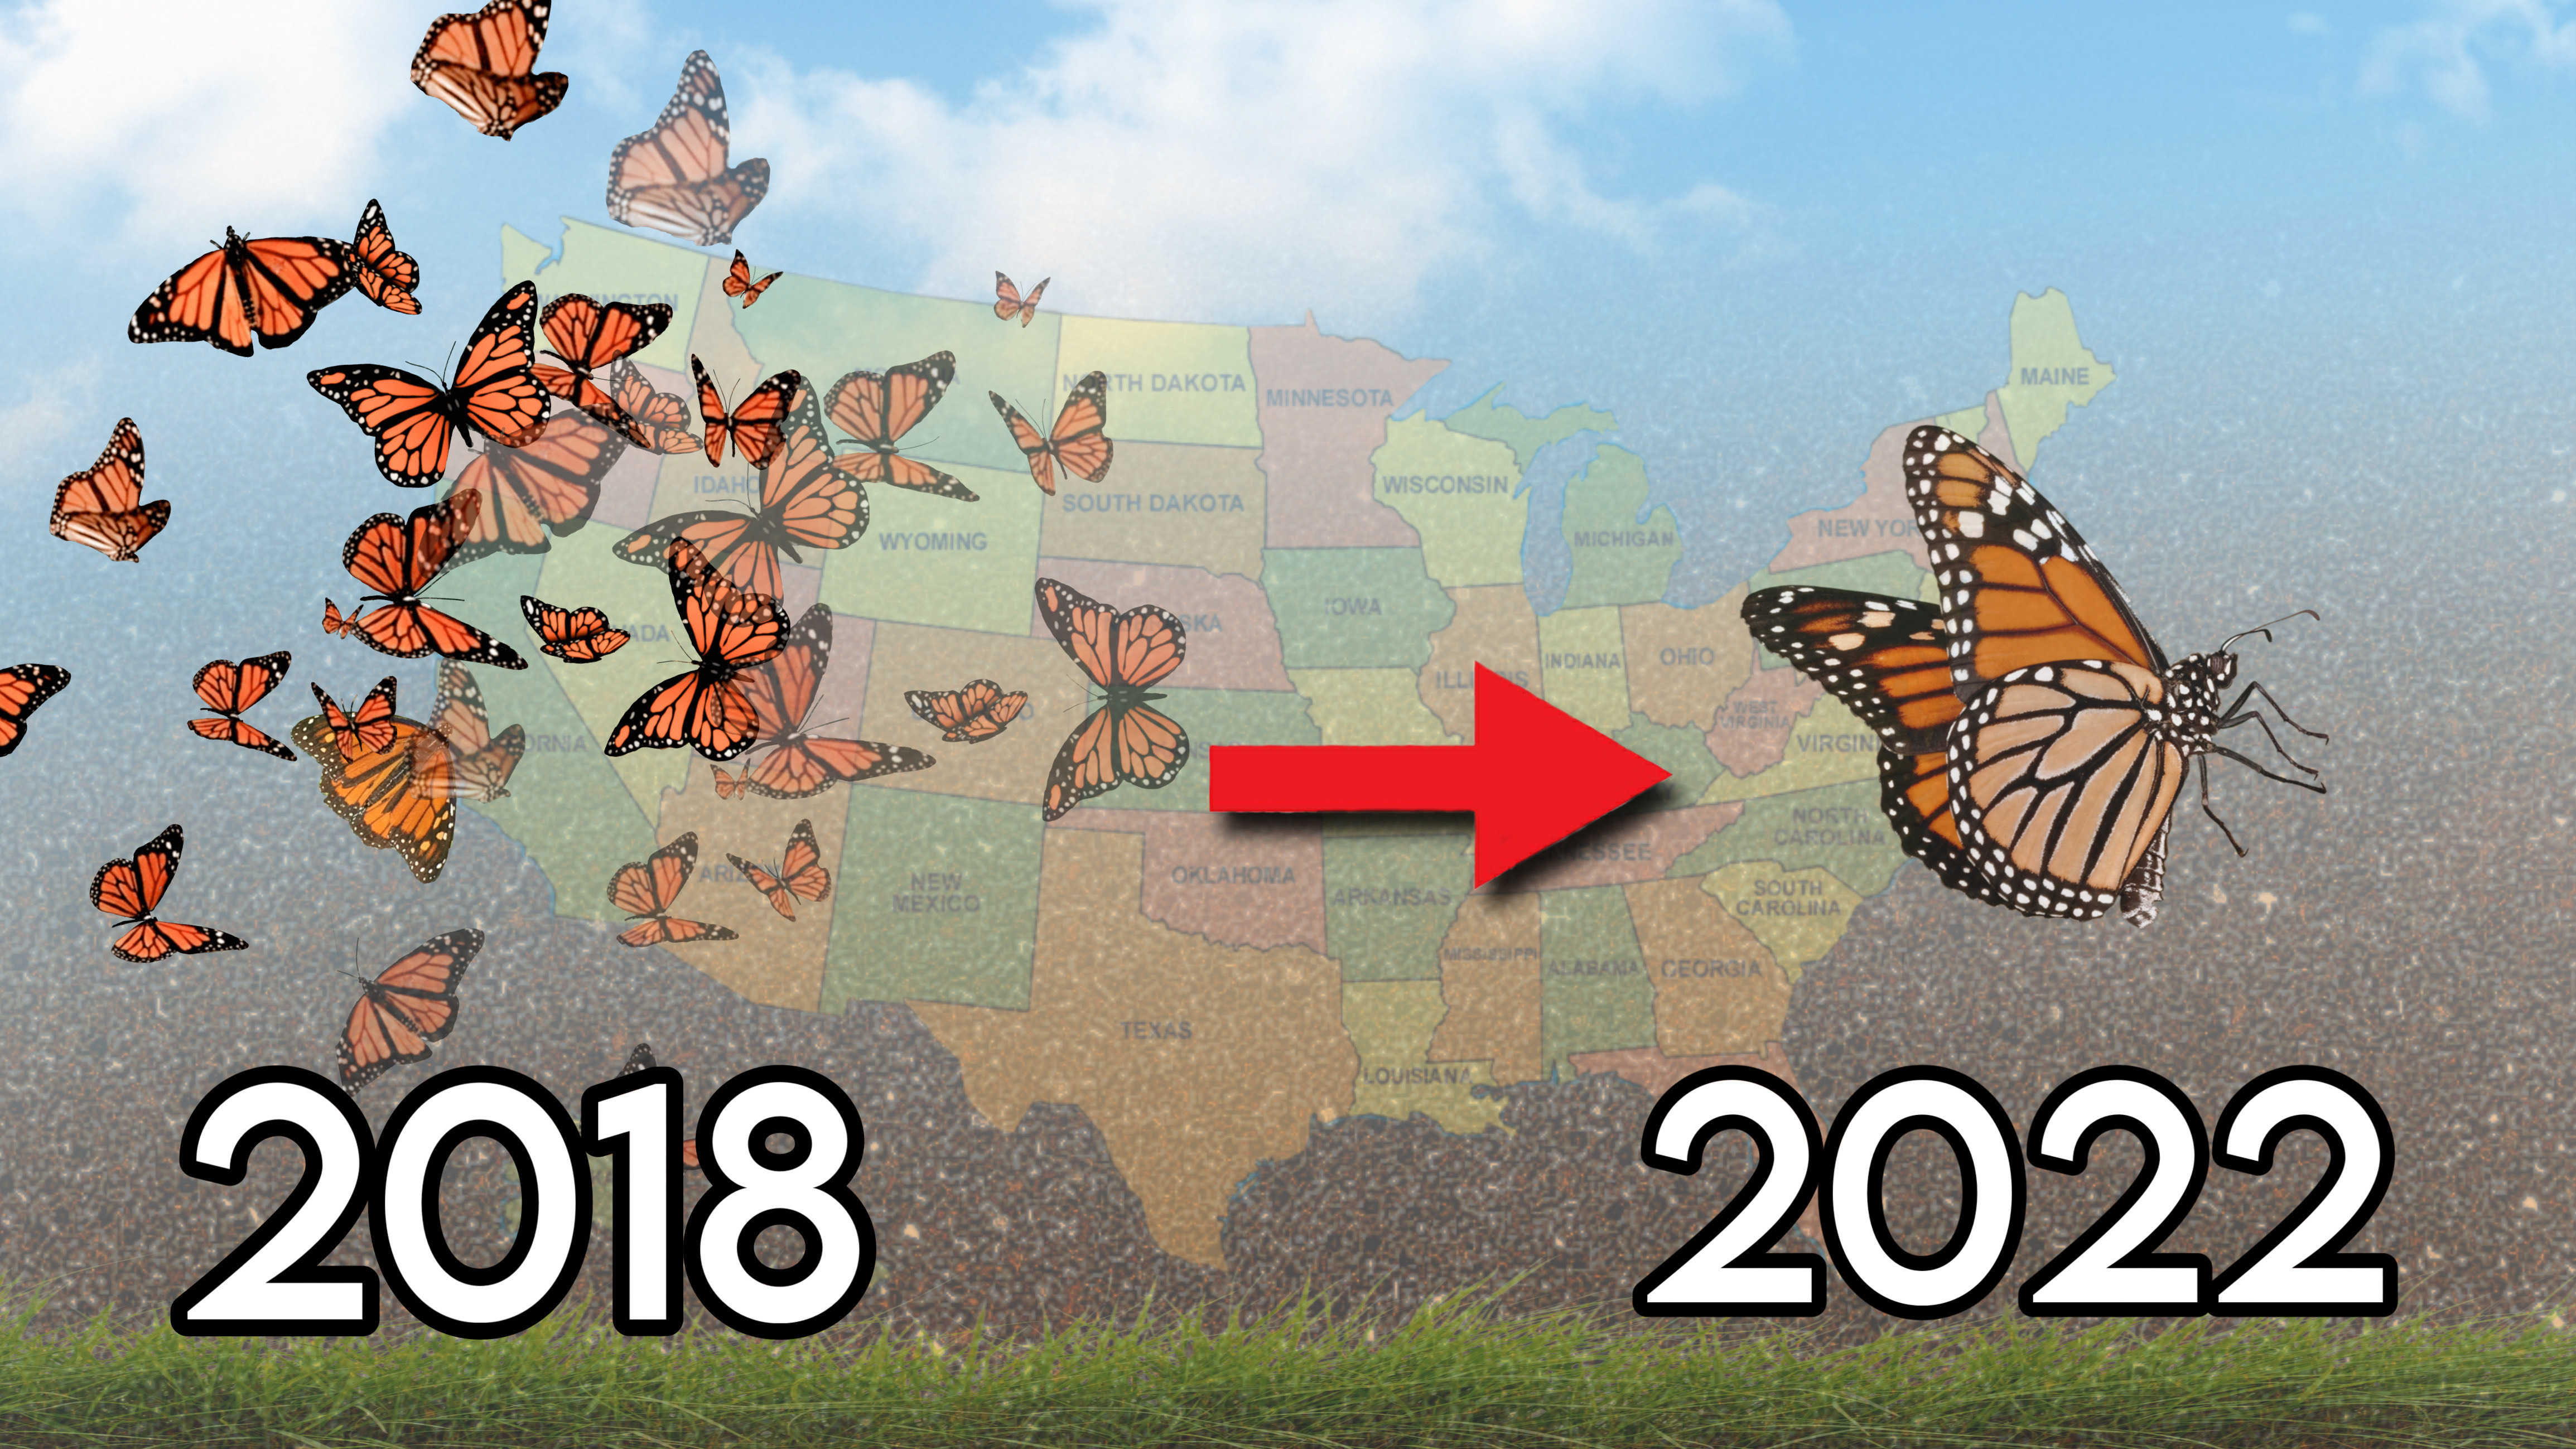
With the rapid industrialization of this planet, many species pay the price with declining populations in order to suit our needs. Monarch butterflies are no exception as the agricultural techniques used to control pests affecting actively contribute to their declining populations. This project was created out of a hope to contribute to conservation efforts.
What it does
This project web scrapes multiple datasets to create easy-to-comprehend visuals. This along with a python program that sorts the given data as to make creating the visuals a much easier task. Combining these elements together creates a clear and concise picture of the situation.
How we built it
There were many tools we used. We used a software program that creates a Chloropleth map based on the highest concentrations of pesticide used per state. A Python program to sort the pesticide data per state. And another python program that web scrapes Journey North which contained the population data.
Challenges we ran into
Figuring out the scope along with which tools to use was very much a difficult process. We started by trying to make the proper graphs in the R programming language. It didn't end well as the data didn't lend itself to be easily transferrable so Python was the fallback option. From there, the real challenge was figuring out what the data reveals and finding the proper correlations to make our case. We did run into a small challenge in properly sorting the data to make it easier to make the visuals with Python. The limitations of two key aspects was also a challenge as adjustments to the data were required to be made. Journey North being user input based means that the less people know about it and considering the timespan of the website, less access to the internet means that accurate data isn't a guarantee. Pivoting towards a 5 year gap made more sense. Also, the limited space of COMPAP combined with the sheer size of the pesticide data made us pivot what we needed to show to make our case.
Accomplishments that we're proud of
We are extremely proud of the various methods implemented to make a centralized project is truly exciting. We were also able to be flexible with the various issues cropping up is also a proud moment for us. And finally, the great teamwork we were able to show is amazing. We are extremely proud o how this project turned out.
What we learned
We learned how to make effective visuals through web scraping utilizing the Python programming language. We learned how to make correlation graphs in the R programming language. We also learned how to find key findings to discover corollary causes to the issues given.
What's next for Crisis in Caterpillar
What we would improve is most definitely the choropleth maps to highlight more states. This along with the programming to make it more consise.


Log in or sign up for Devpost to join the conversation.