-
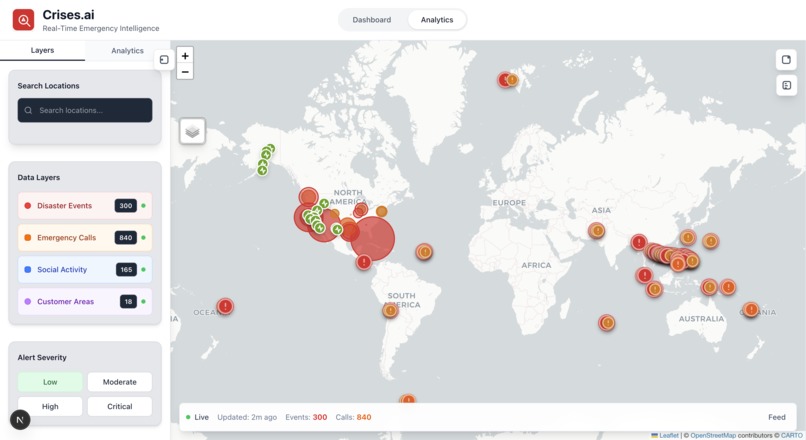
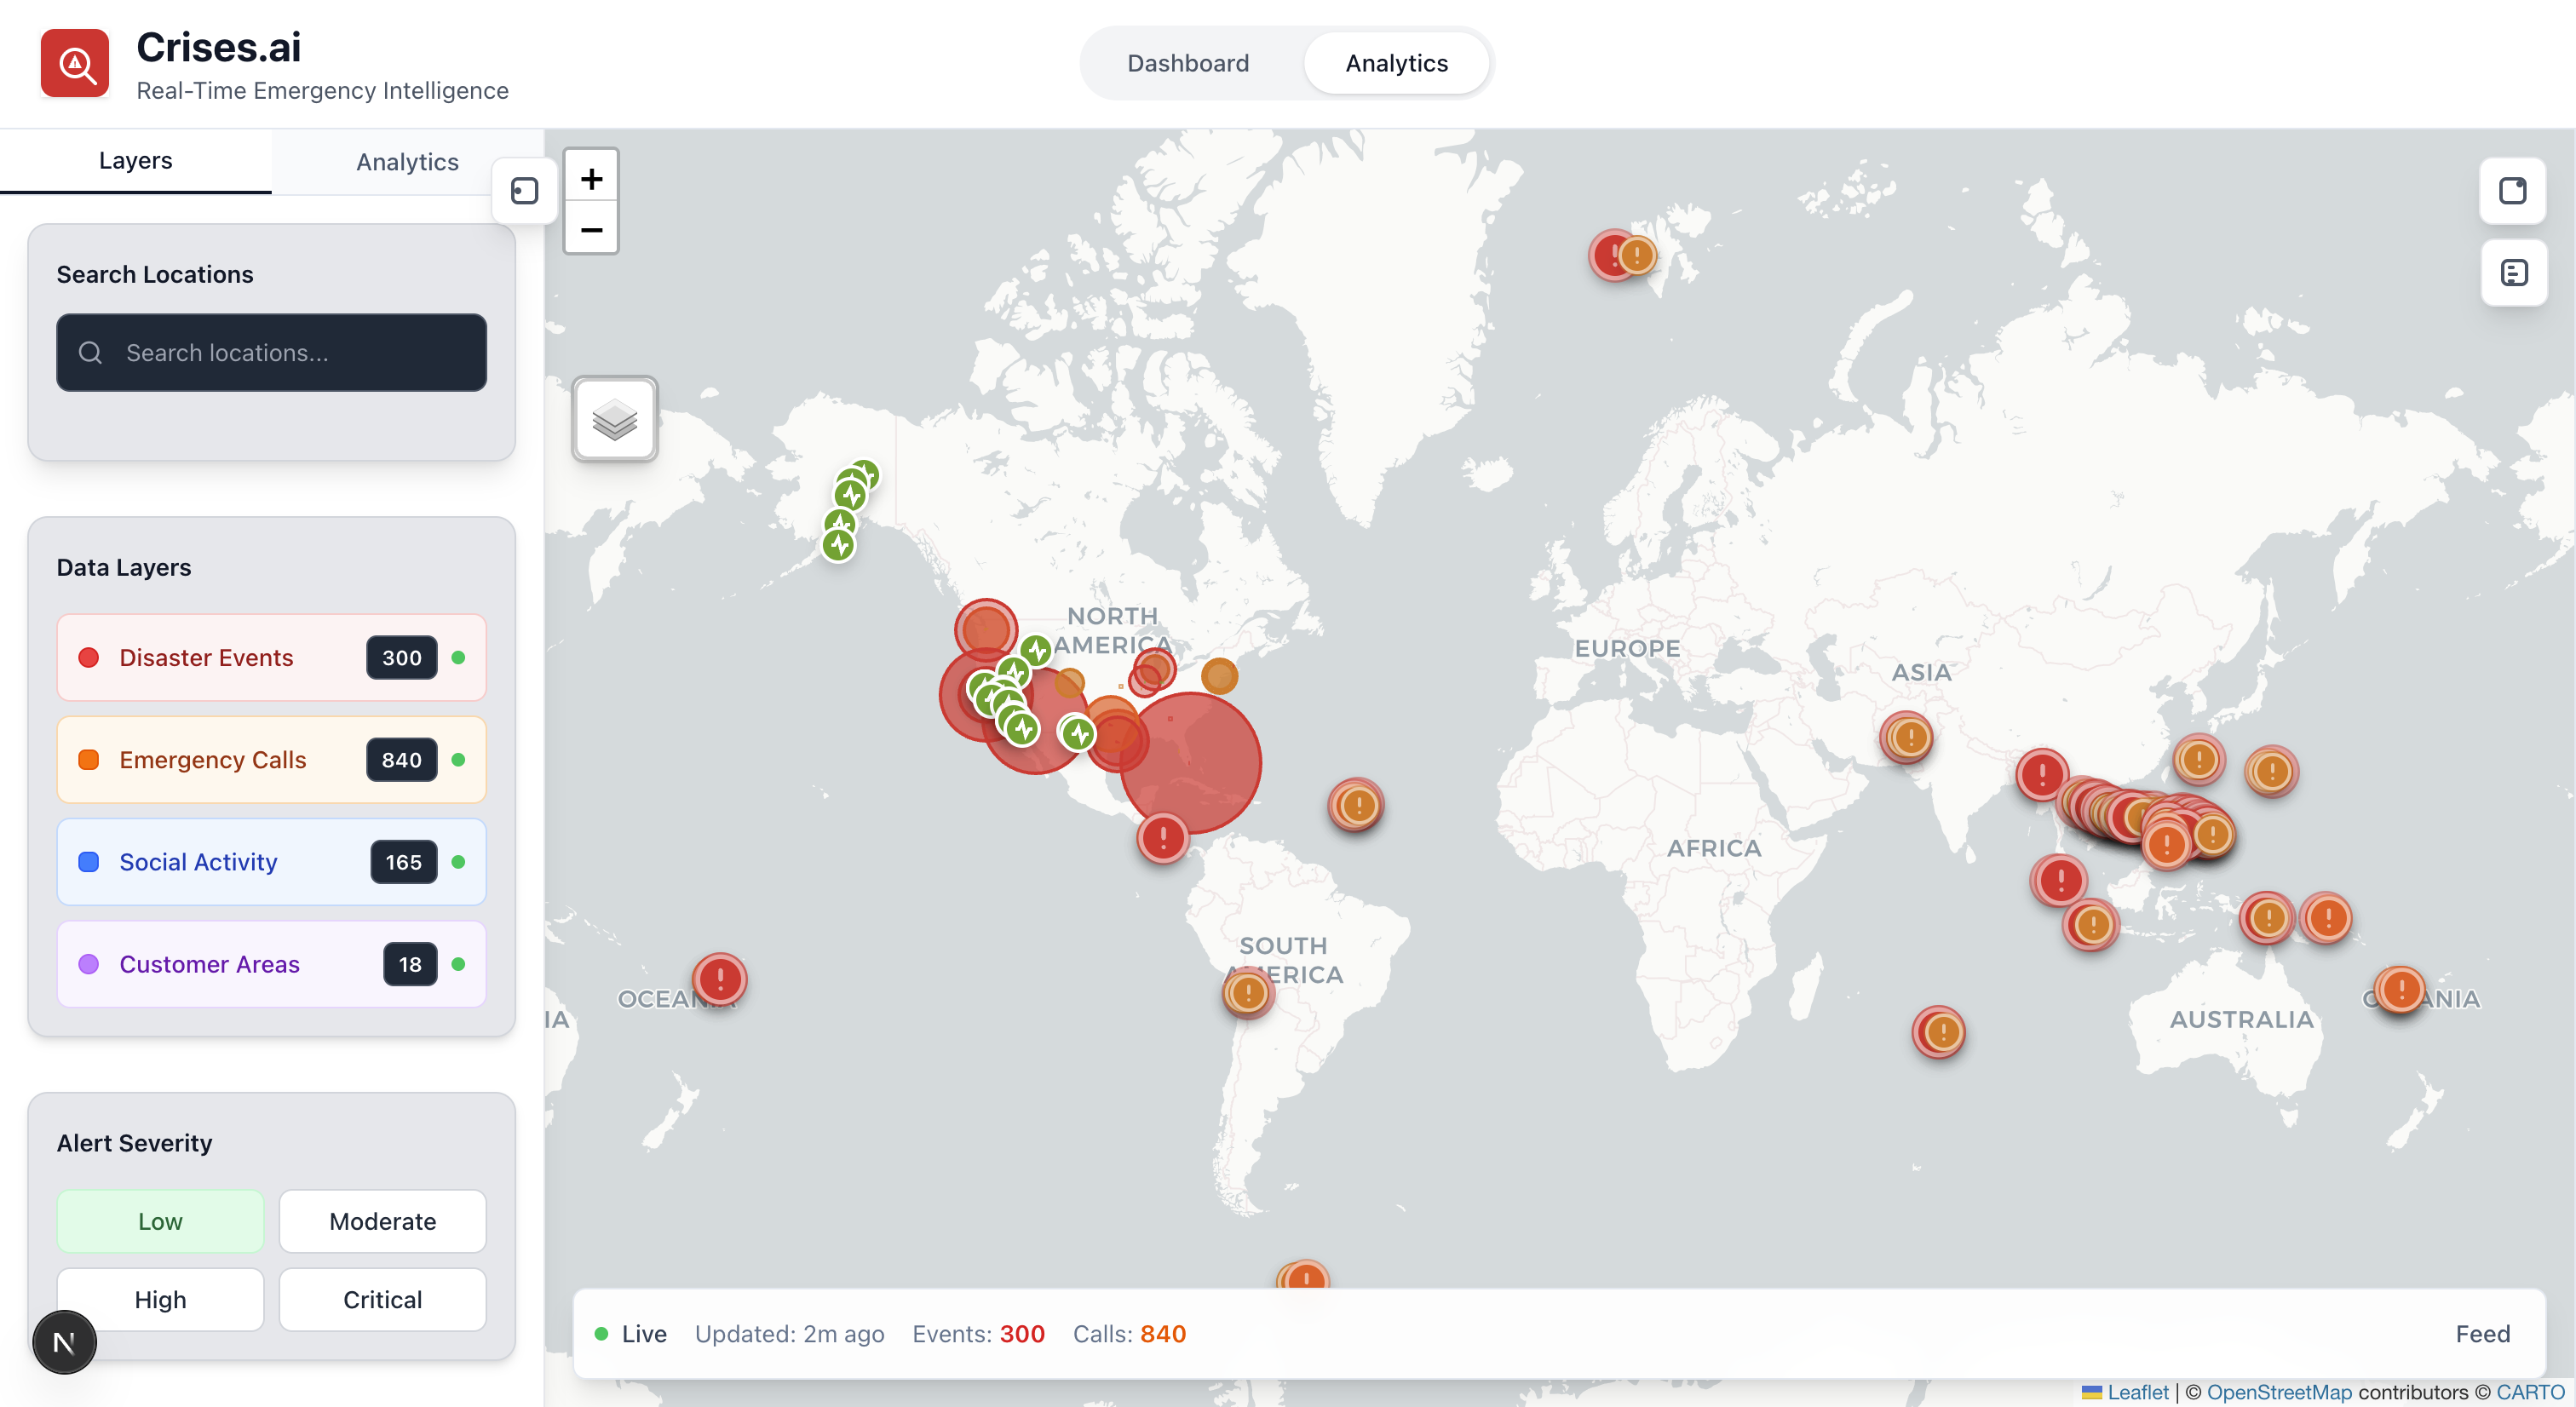
Dashboard
-
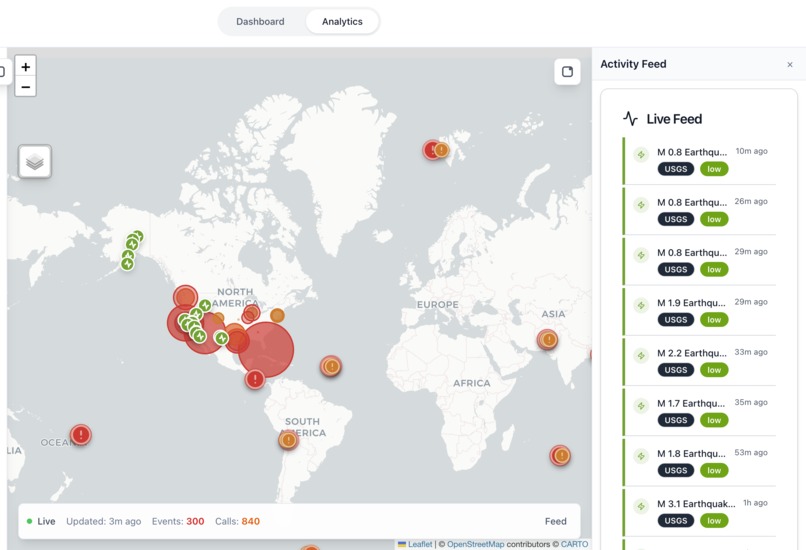
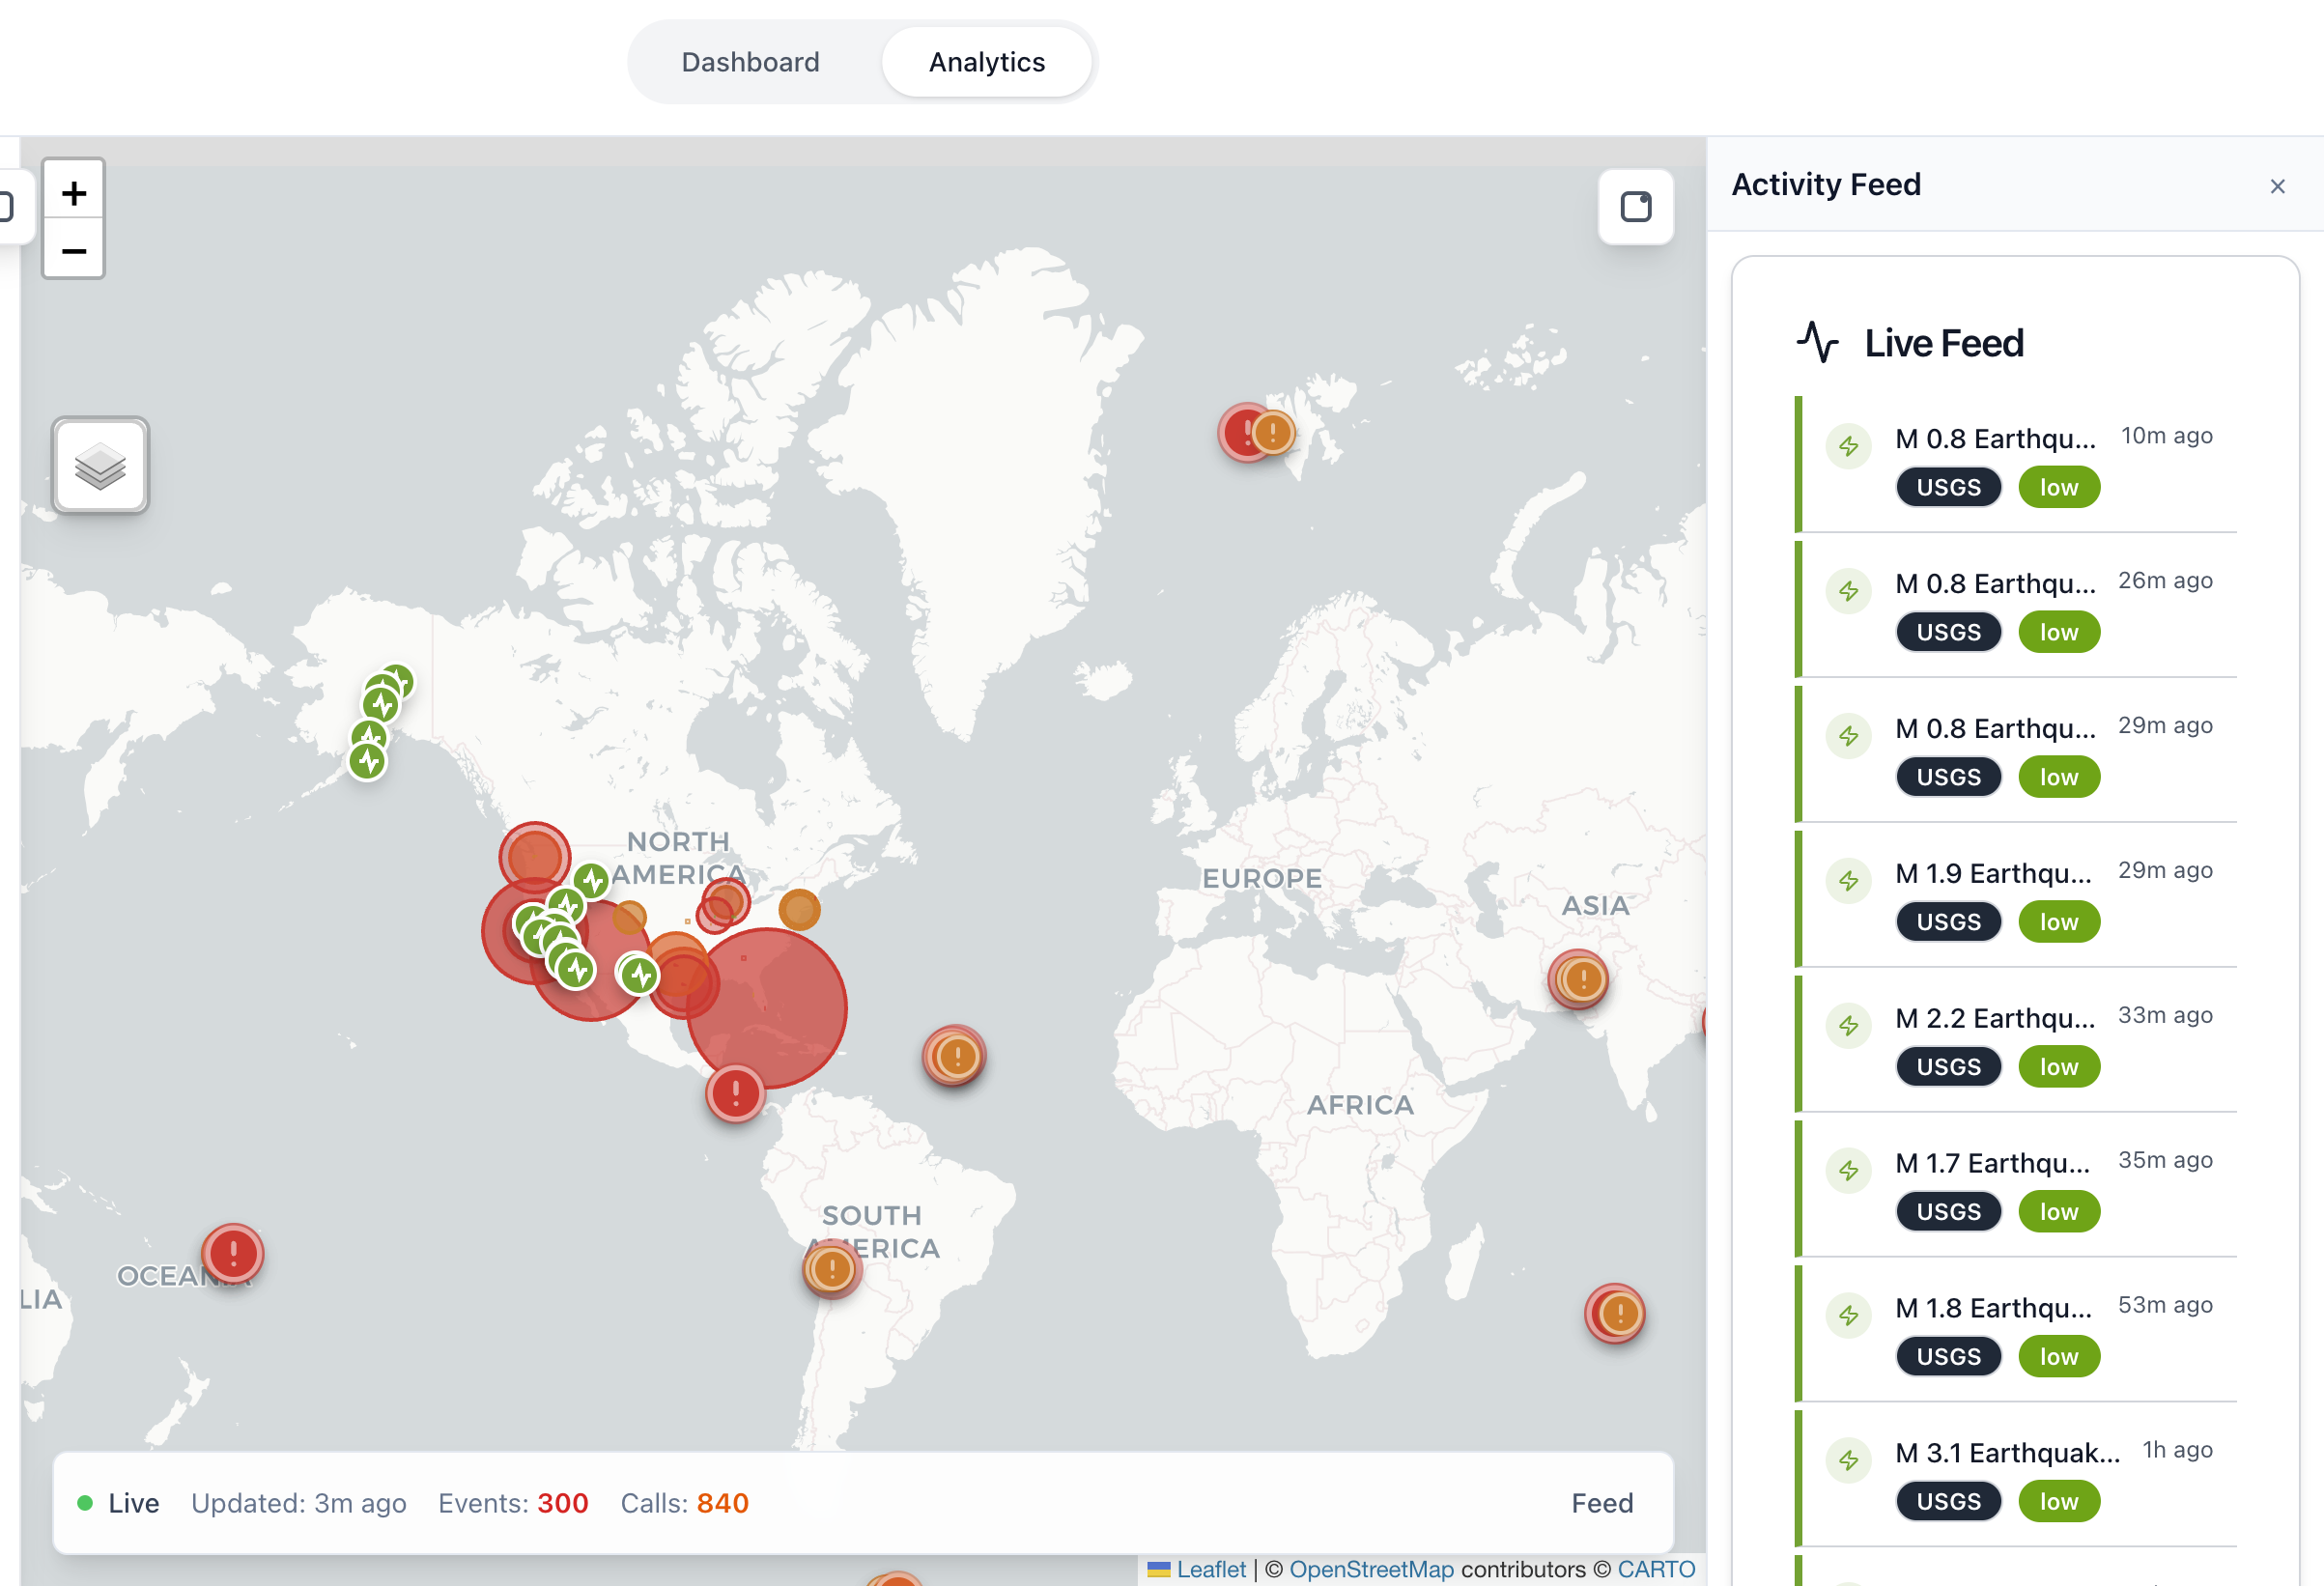
Activity Feed
-

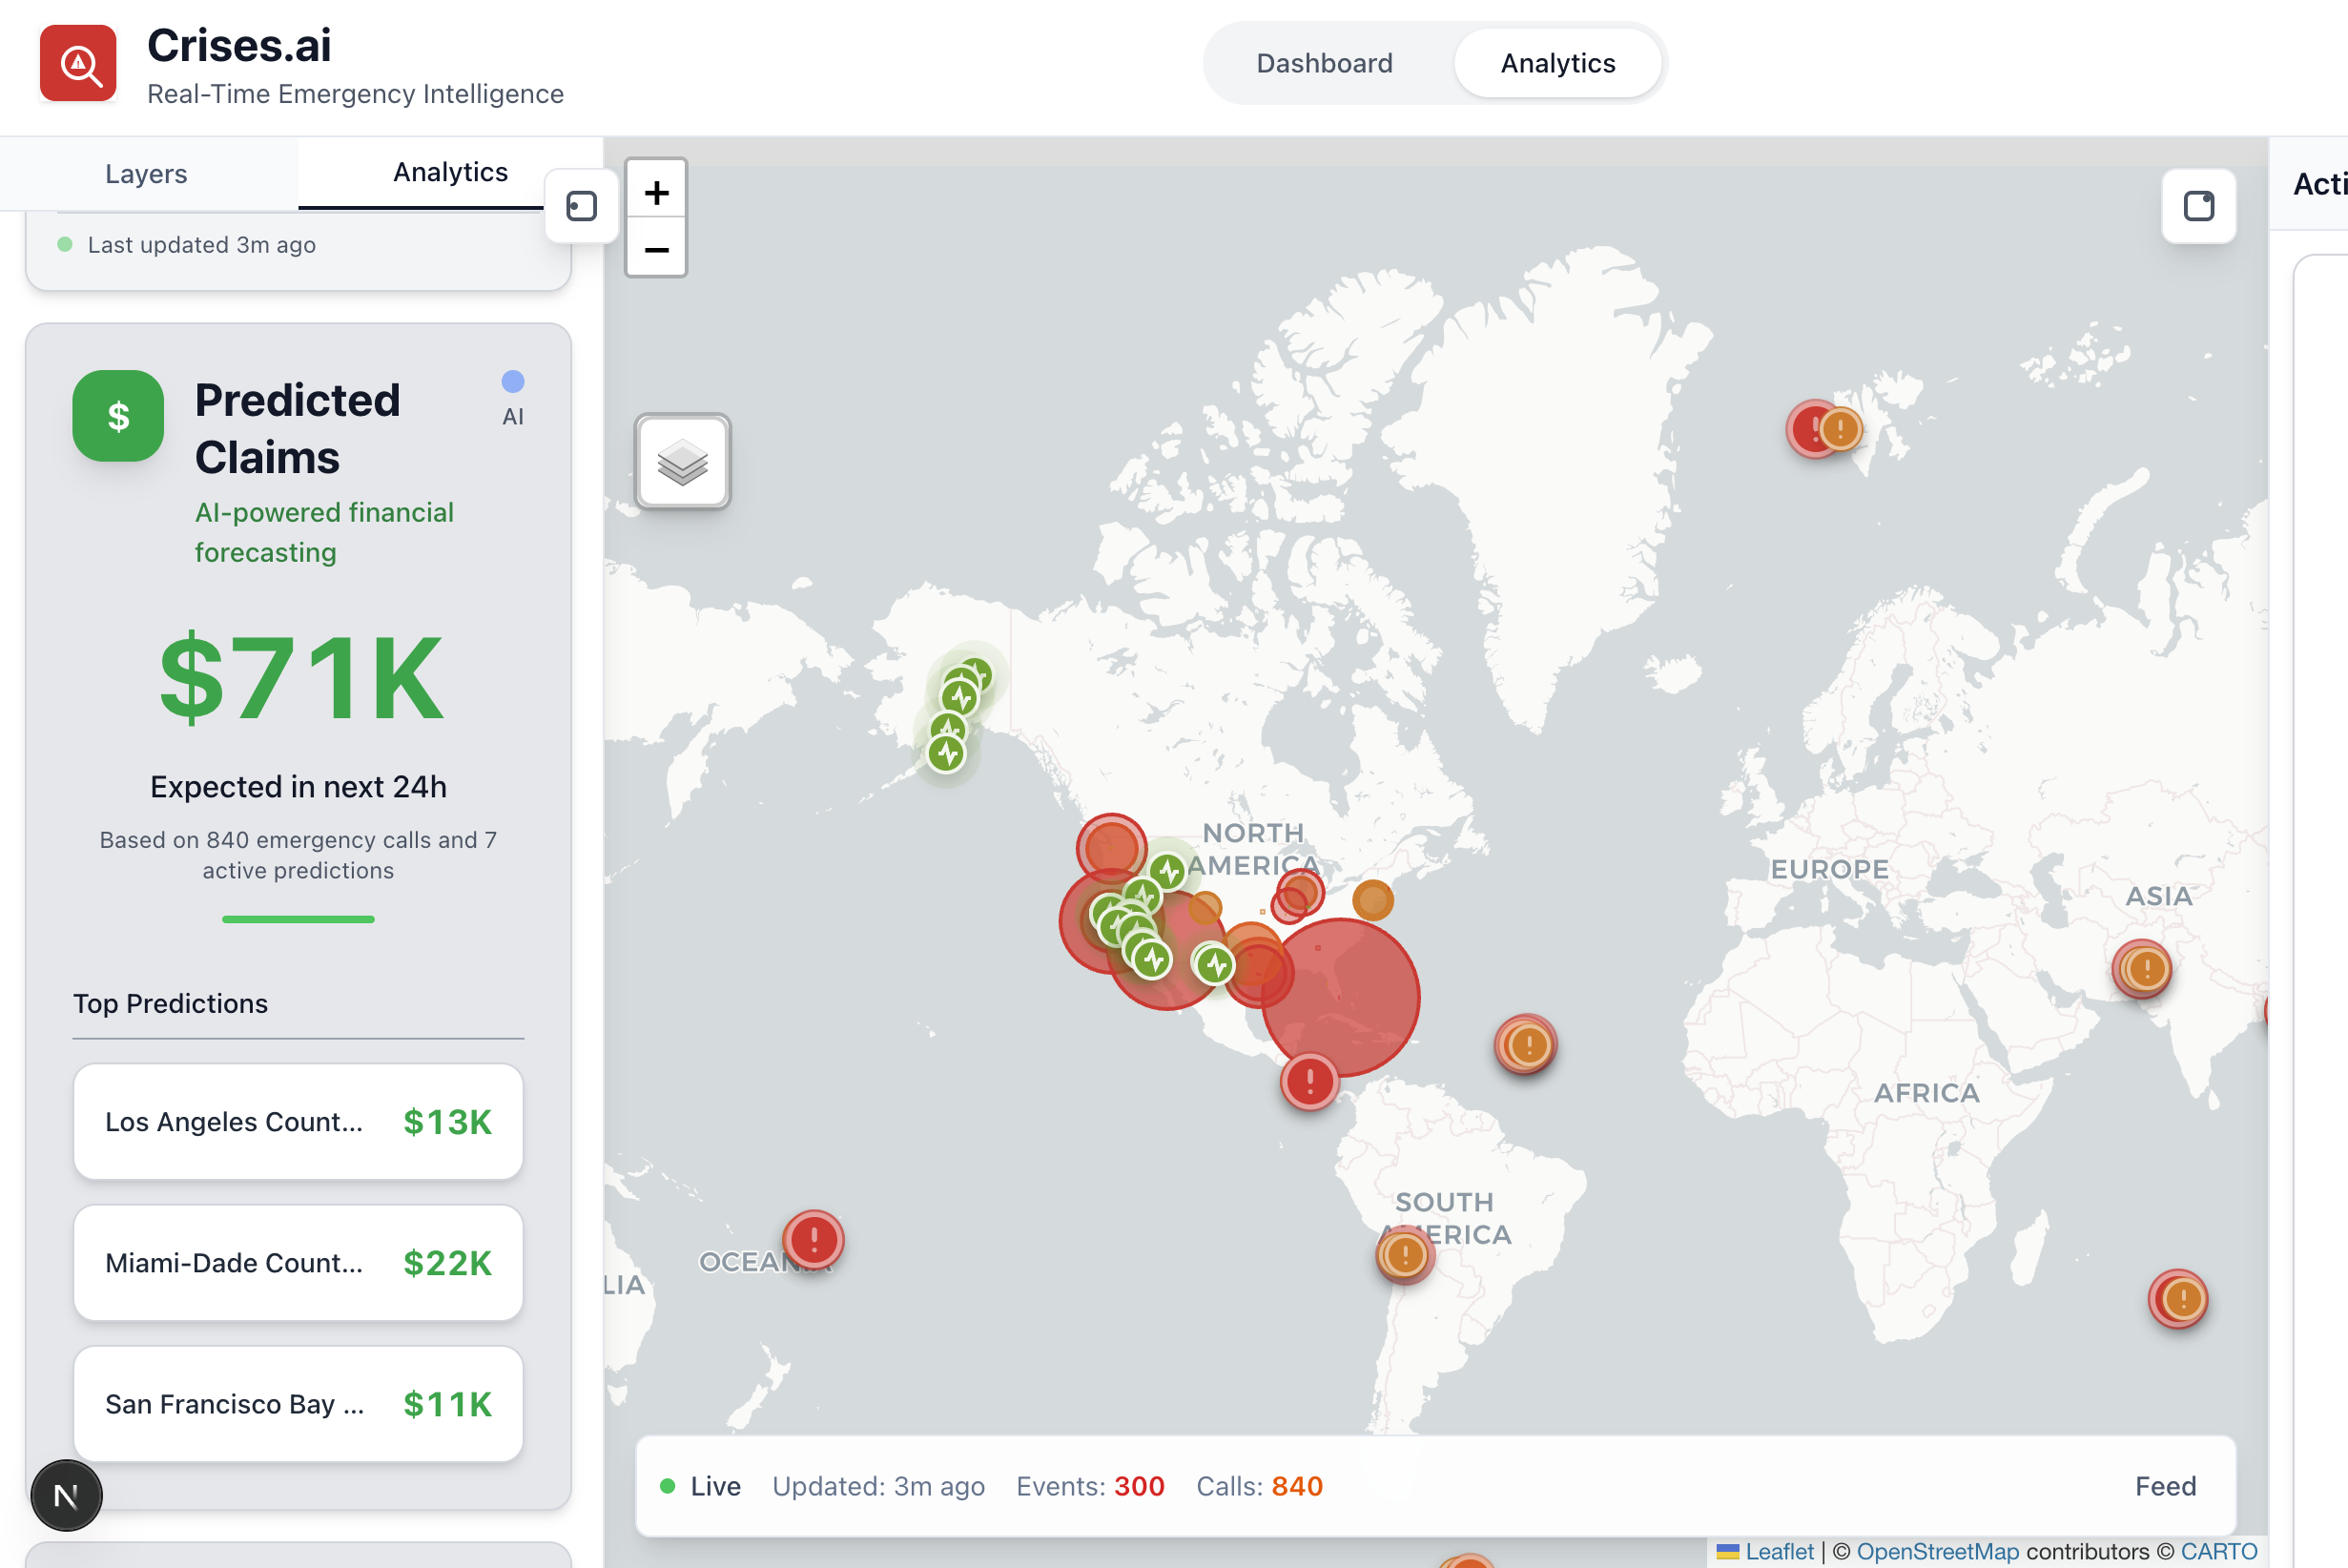
Predicted Claims using Gemini
Inspiration
Rapid response gaps We saw carriers struggle to unify disaster intel fast enough to protect policyholders.
What it does
Live risk picture streams USGS quakes, NASA FIRMS wildfires, FEMA declarations, 911 call clusters, and AI-scored social chatter into a unified map with claim forecasts and customer exposure overlays. Kontur hazards are relabeled with seeded personas (wildfire watch, flash flood, landslide) so alerts actually look like what’s happening on the ground. Customer-density polygons light up across 18+ metros, pairing climate risk with the specific neighborhoods and policy counts most at stake.
How we built it
Full-stack ingest + AI:Node/TypeScript pollers normalize every feed into Postgres via Drizzle, cache fallbacks when an API hiccups, and publish updates over Socket.IO. Next.js renders the dashboard; React-Leaflet, Zustand, and custom hooks layer in events, calls, social hotspots, and polygons while triggering Gemini-backed (or heuristic fallback) forecasts. Deterministic seeding keeps mock data consistent for demos, and normalized risk/prediction math guards against runaway numbers in production.
Challenges we ran into
Data alignment Reconciling incompatible feeds, stale social endpoints, and capping runaway risk scores without a stable DB.
Accomplishments that we're proud of
Insurer-ready demo Real-time disaster overlays, adjuster need estimates, and dense customer regions that actually tell an underwriting story.
What we learned
Operational focus External data is easy; packaging it for claims, underwriting, and executive briefings is the real win.
What's next for Crises.ai
Go live, harden the database, add insurer claim histories, and ship mobile alerts for field adjusters.
Built With
- gemini
- nextjs
- python
- tailwind
- typescript


Log in or sign up for Devpost to join the conversation.