Inspiration
We, at VCU, frequently receive emails about safety incidents late at night. I realized I could use public data to analyze where VCU stands in terms of crime compared to other public universities.
What it does
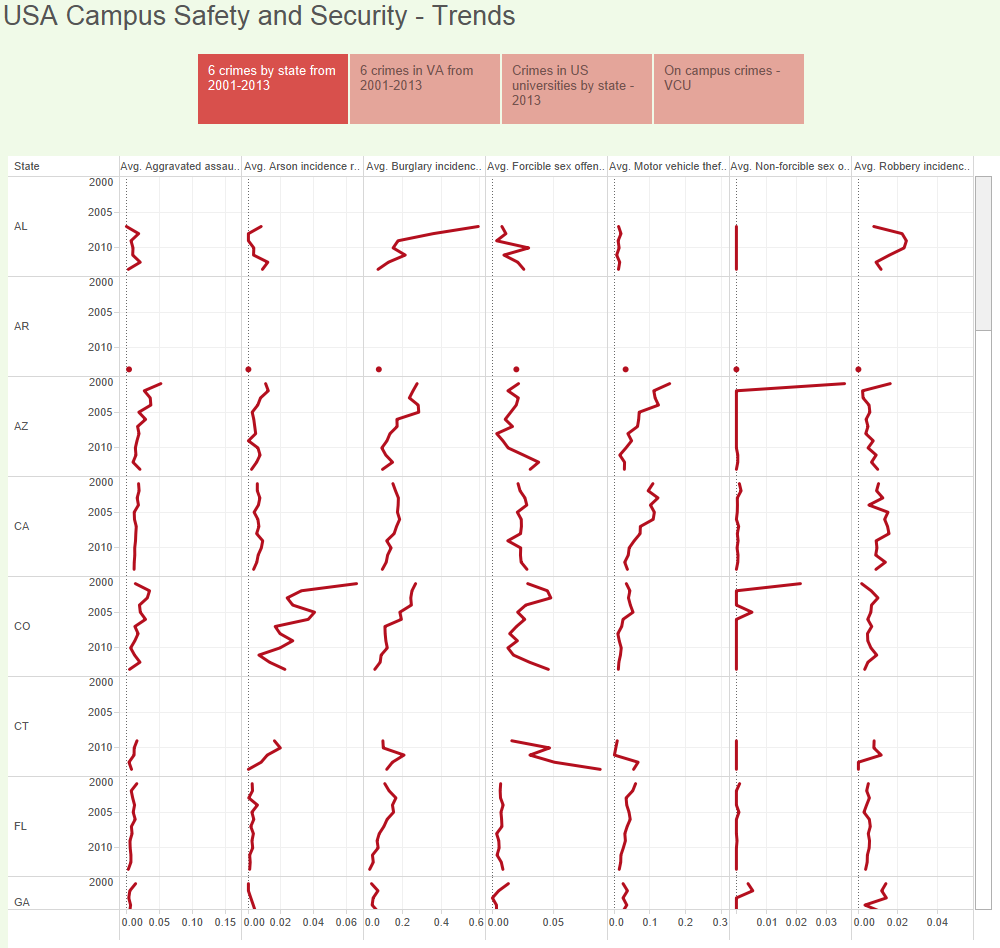
It analyzes on-campus crimes at public universities (>4-yr curriculum) with a student population of 25,000 and above. It presents analysis on 6-7 different crimes (robbery, forcible sex offense, non-forcible sex offense, aggravated assault, motor vehicle theft, burglary and arson) in each state for a period of time (2001-2013).
Use the tabs in the embedded visualization to see different views of the analysis.
How I built it
I built it using Python, pandas, Bootstrap, iPython, Google Places API, JavaScript, and Tableau
Challenges I ran into
The official data available at http://ope.ed.gov/Security/ does not provide location information of universities. I used Google Places API to retrieve physical address, latitude and longitude information for information visualization purposes.
Accomplishments that I'm proud of
- Created this project within 10 hours at great speed
- To our relief, this project helped me understand that VCU is safer than many other places although there are specific crimes (aggravated assault and motor vehicle theft) that occur that higher than national average incidence rate.
What I learned
- Re-using Google APIs
- Complex information visualization
- Prototyping using Python, pandas, matplotlib
What's next for Crimes@VCU
I will expand it to other types of institutions and crimes. I will eventually create an API for this data making it easier for other developers to access the data.

Log in or sign up for Devpost to join the conversation.