-
-
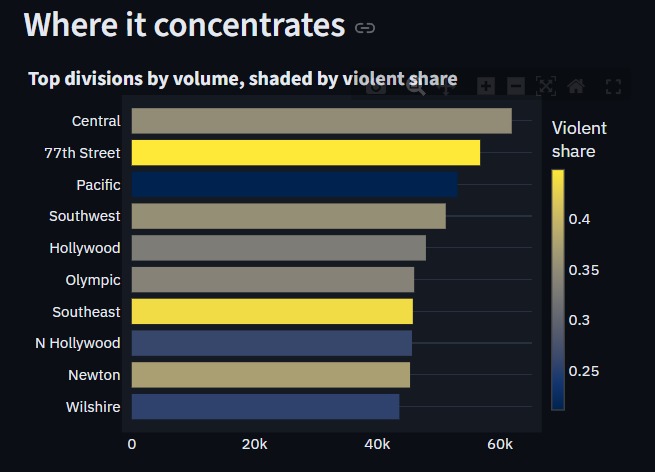
Concentration
-
-
-
-
-
-
-
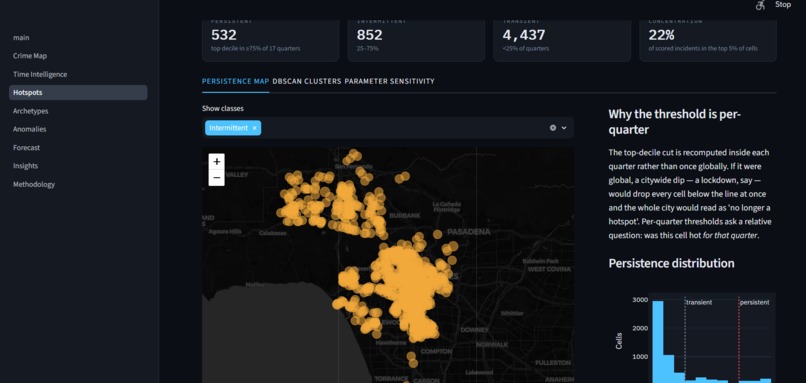
Intermittent crime spots
-
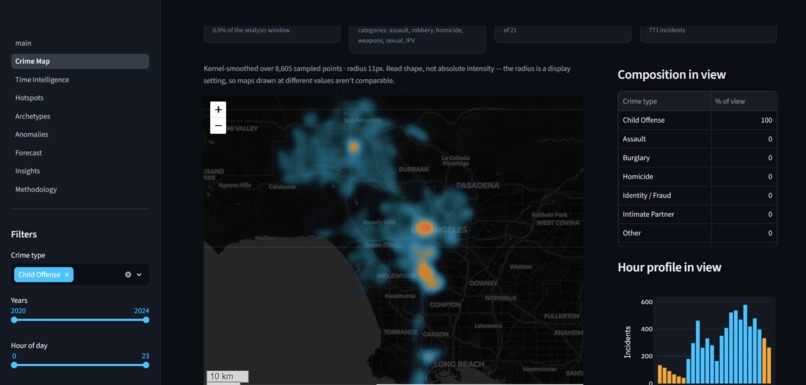
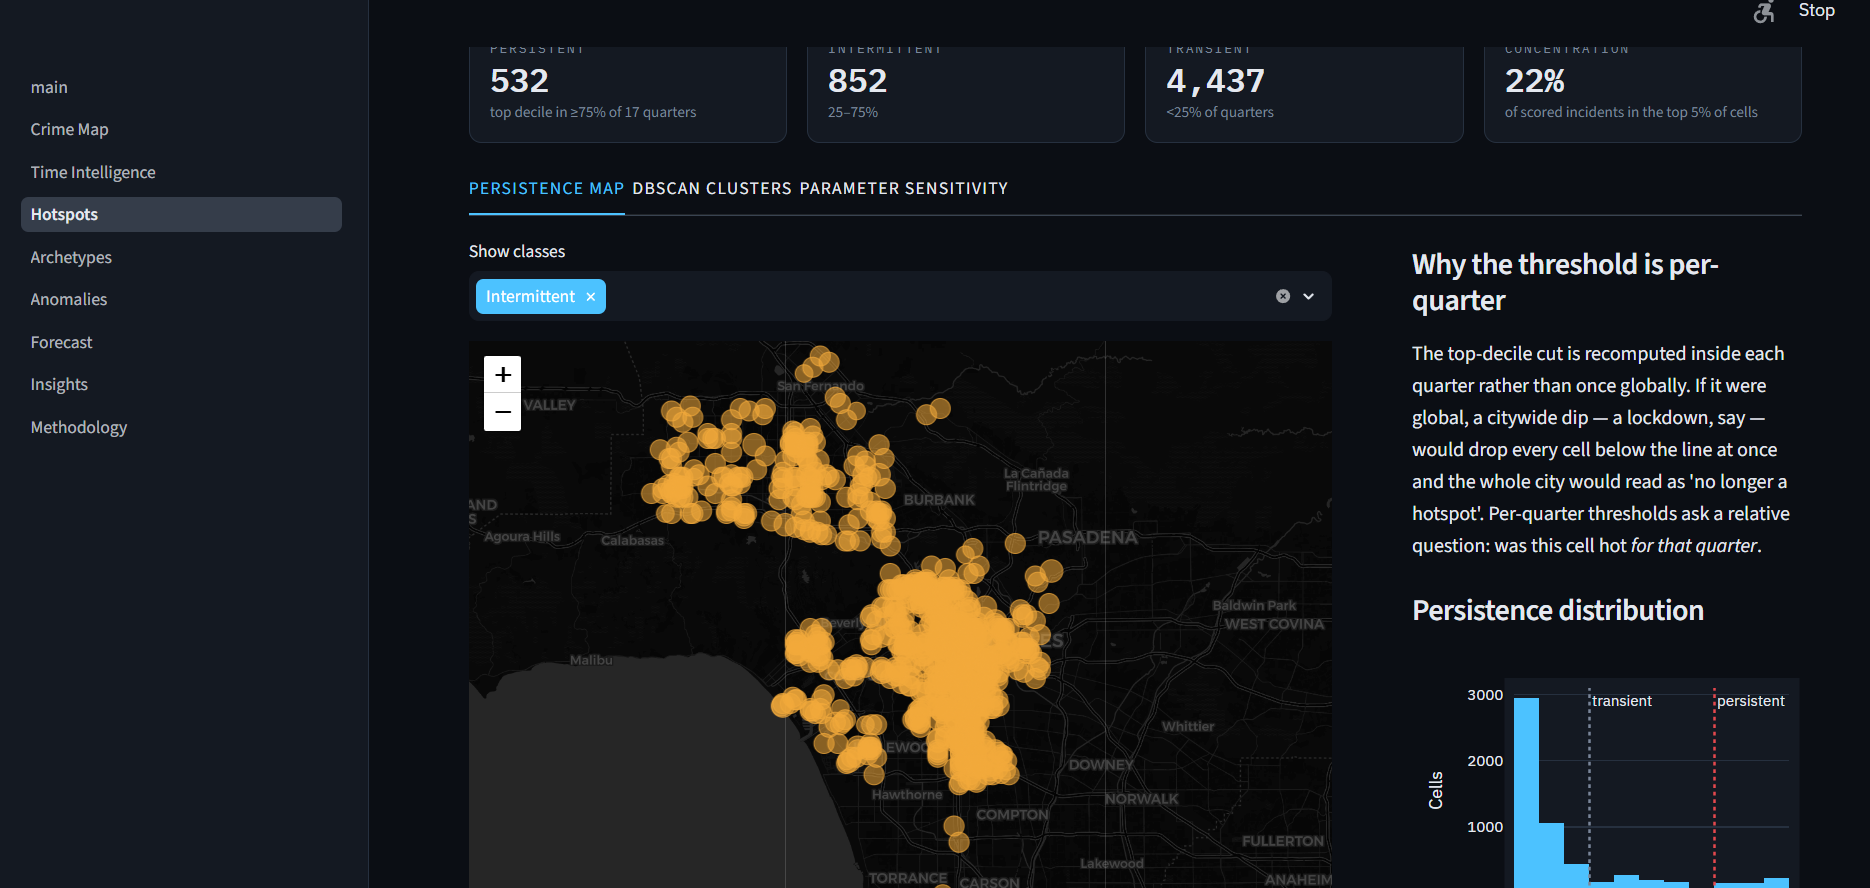
Hotspots for child offense
Inspiration
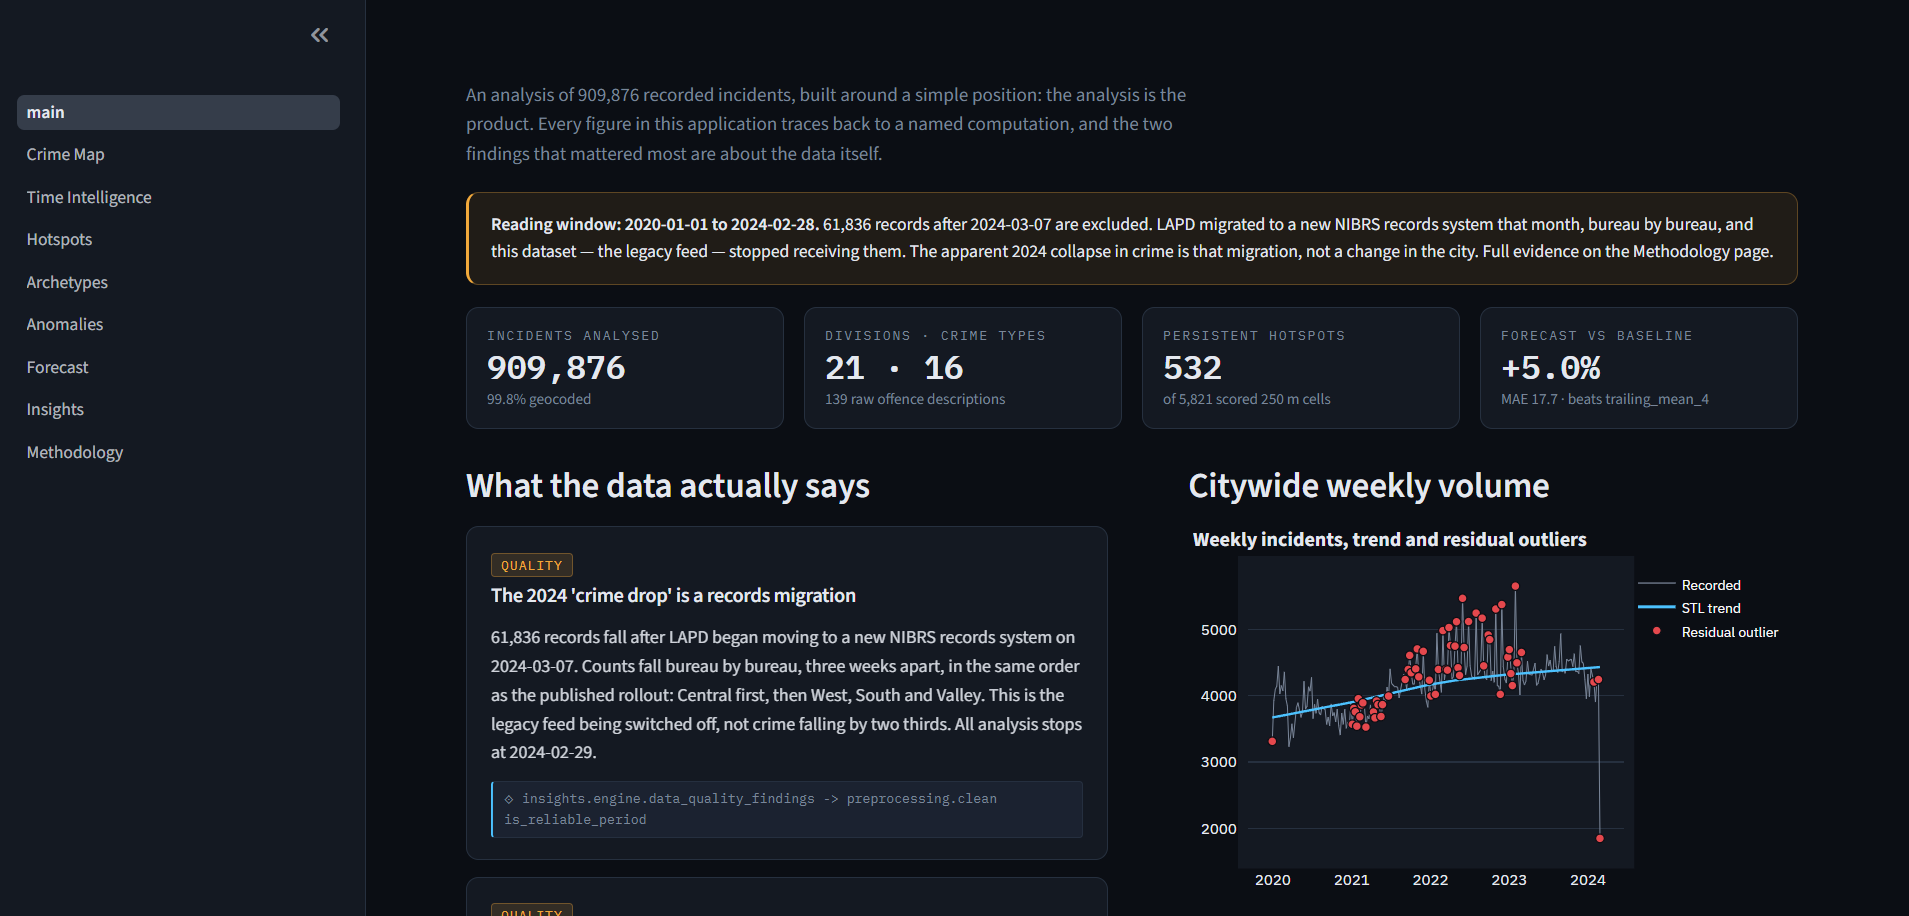
Crime data is often reduced to static tables, yearly totals, or isolated statistics. While these show how much crime occurred, they rarely help answer more meaningful questions: Where does crime concentrate? When do patterns emerge? Which hotspots persist, and which are temporary?
We wanted to turn historical crime records into something people could actively explore. This led to CrimePulse, a platform focused on understanding the relationship between crime, location, and time rather than simply producing another generic crime prediction model.
What it does
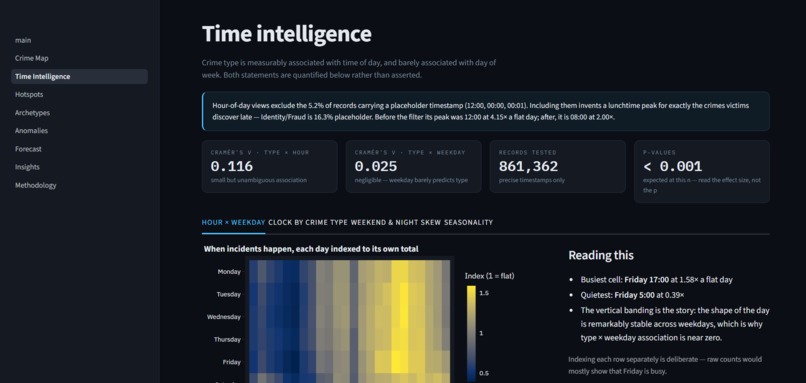
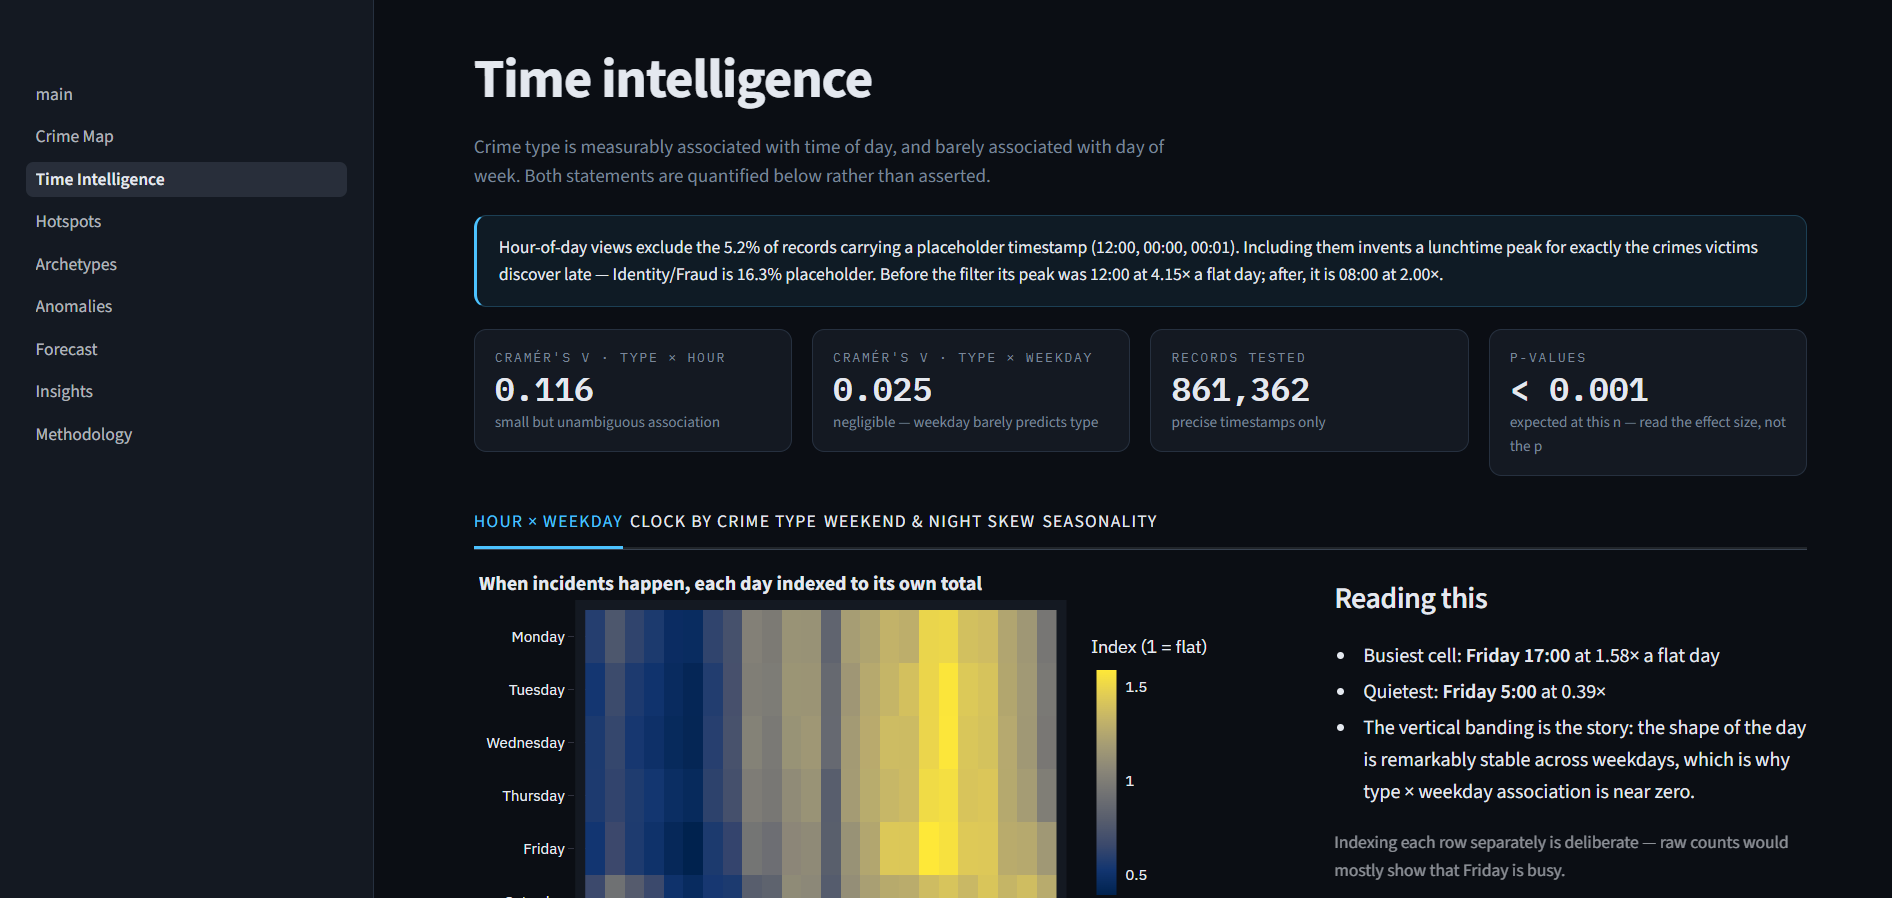
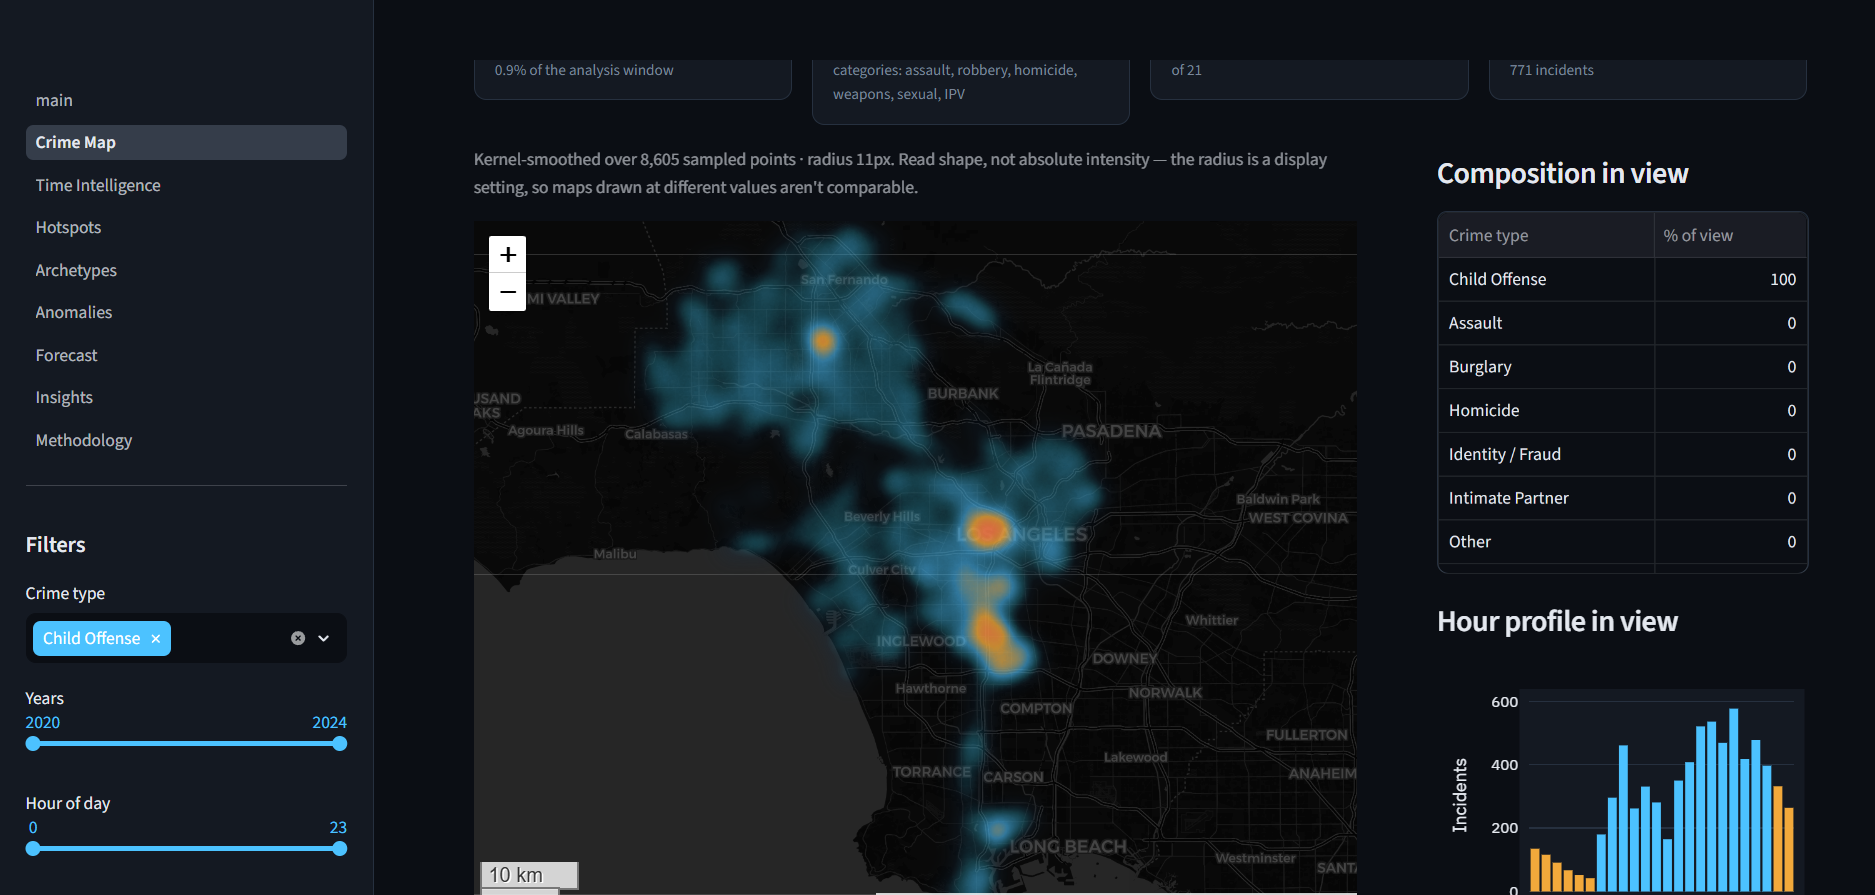
CrimePulse transforms historical crime data into interactive spatial and temporal intelligence. Users can explore crime density through heatmaps, analyze patterns across hours, days, and time periods, identify geographic hotspots, compare crime profiles across locations, and detect unusual changes in historical activity.
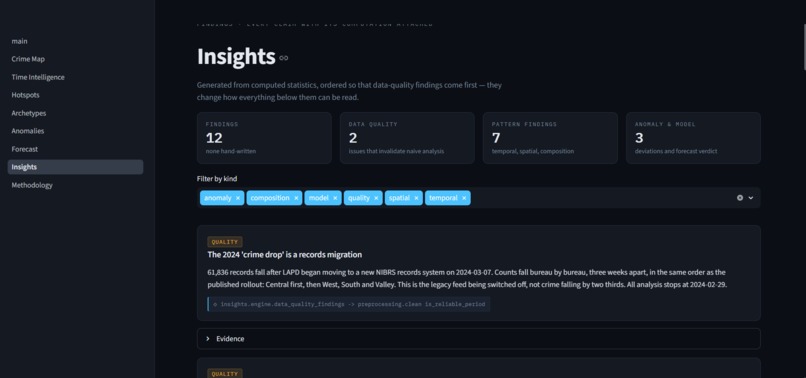
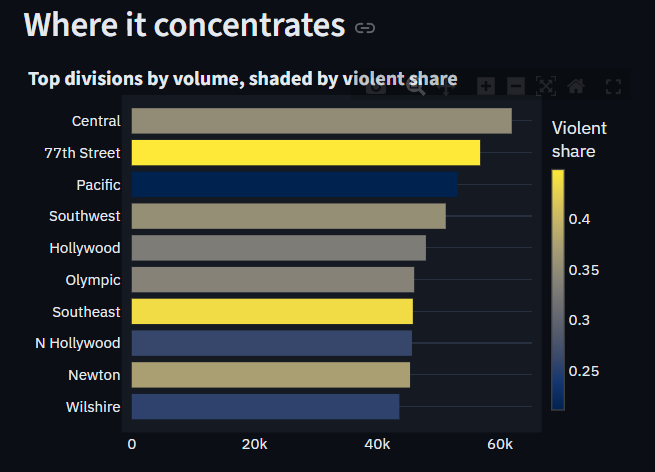
Instead of treating every high-crime area the same, CrimePulse examines when, where, and what type of crime contributes to observed patterns. This makes it possible to distinguish persistent hotspots from temporary spikes and identify statistically unusual activity.
How we built it
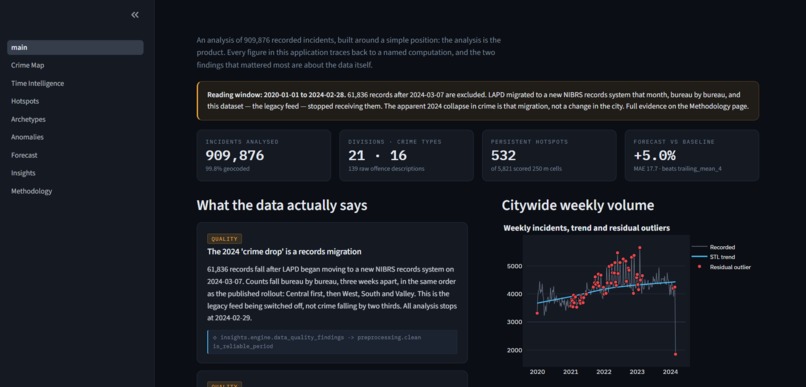
We built CrimePulse as a modular Python-based crime intelligence platform using Pandas and NumPy for preprocessing and feature engineering, with Scikit-learn for spatial clustering and analytical workflows. The pipeline processes nearly 910,000 LAPD-recorded incidents, separating data cleaning, temporal analysis, spatial hotspot detection, crime-profile clustering, anomaly detection, forecasting, and insight generation into dedicated modules.
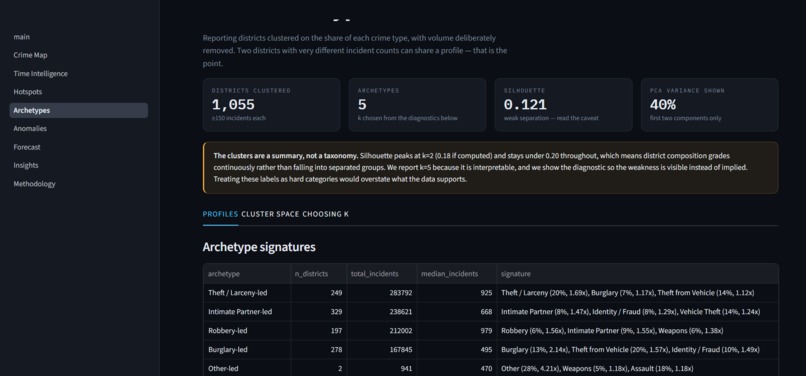
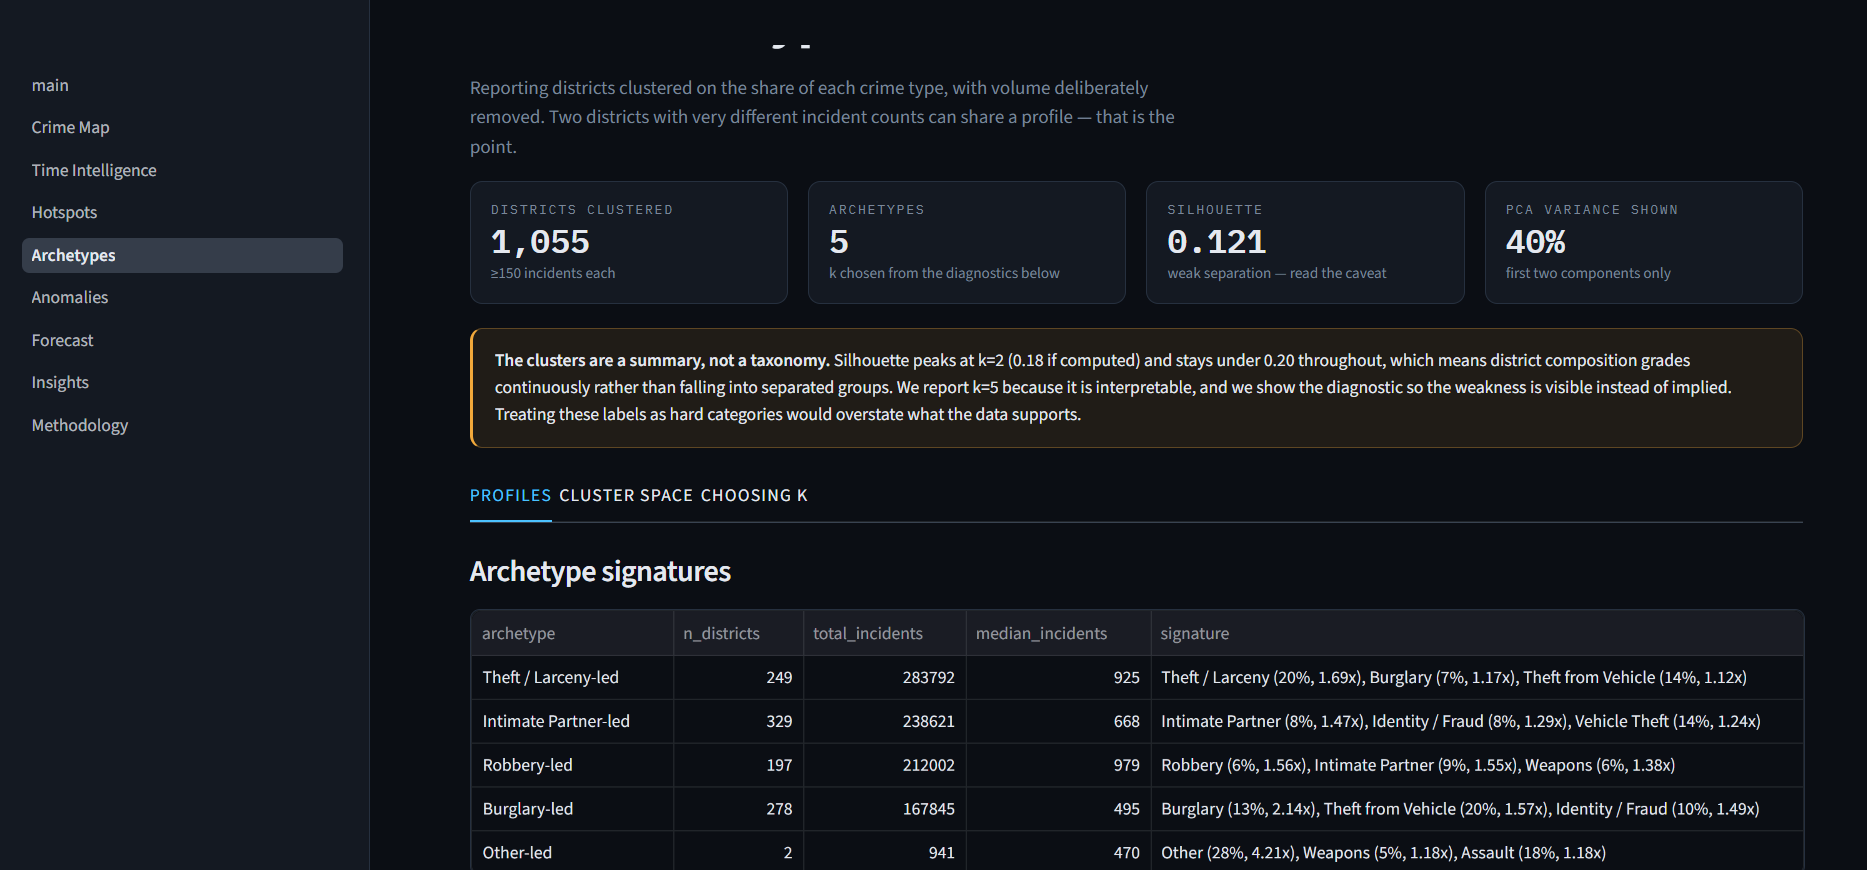
For spatial analysis, we used 250 m geographic grid cells to measure hotspot persistence and DBSCAN to identify crime-specific spatial clusters. Crime archetypes were generated by clustering reporting districts based on their crime composition rather than total volume.
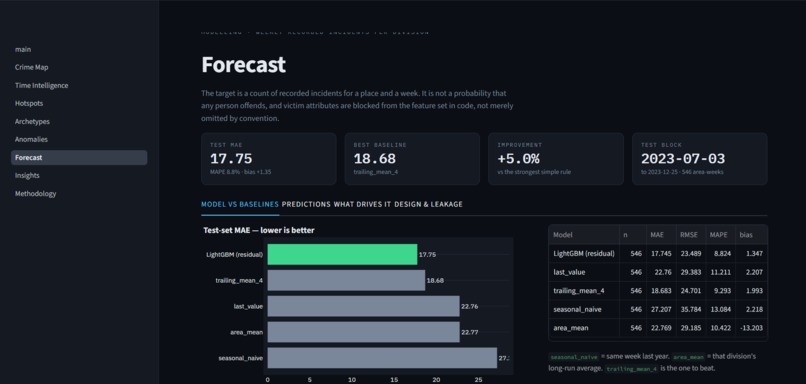
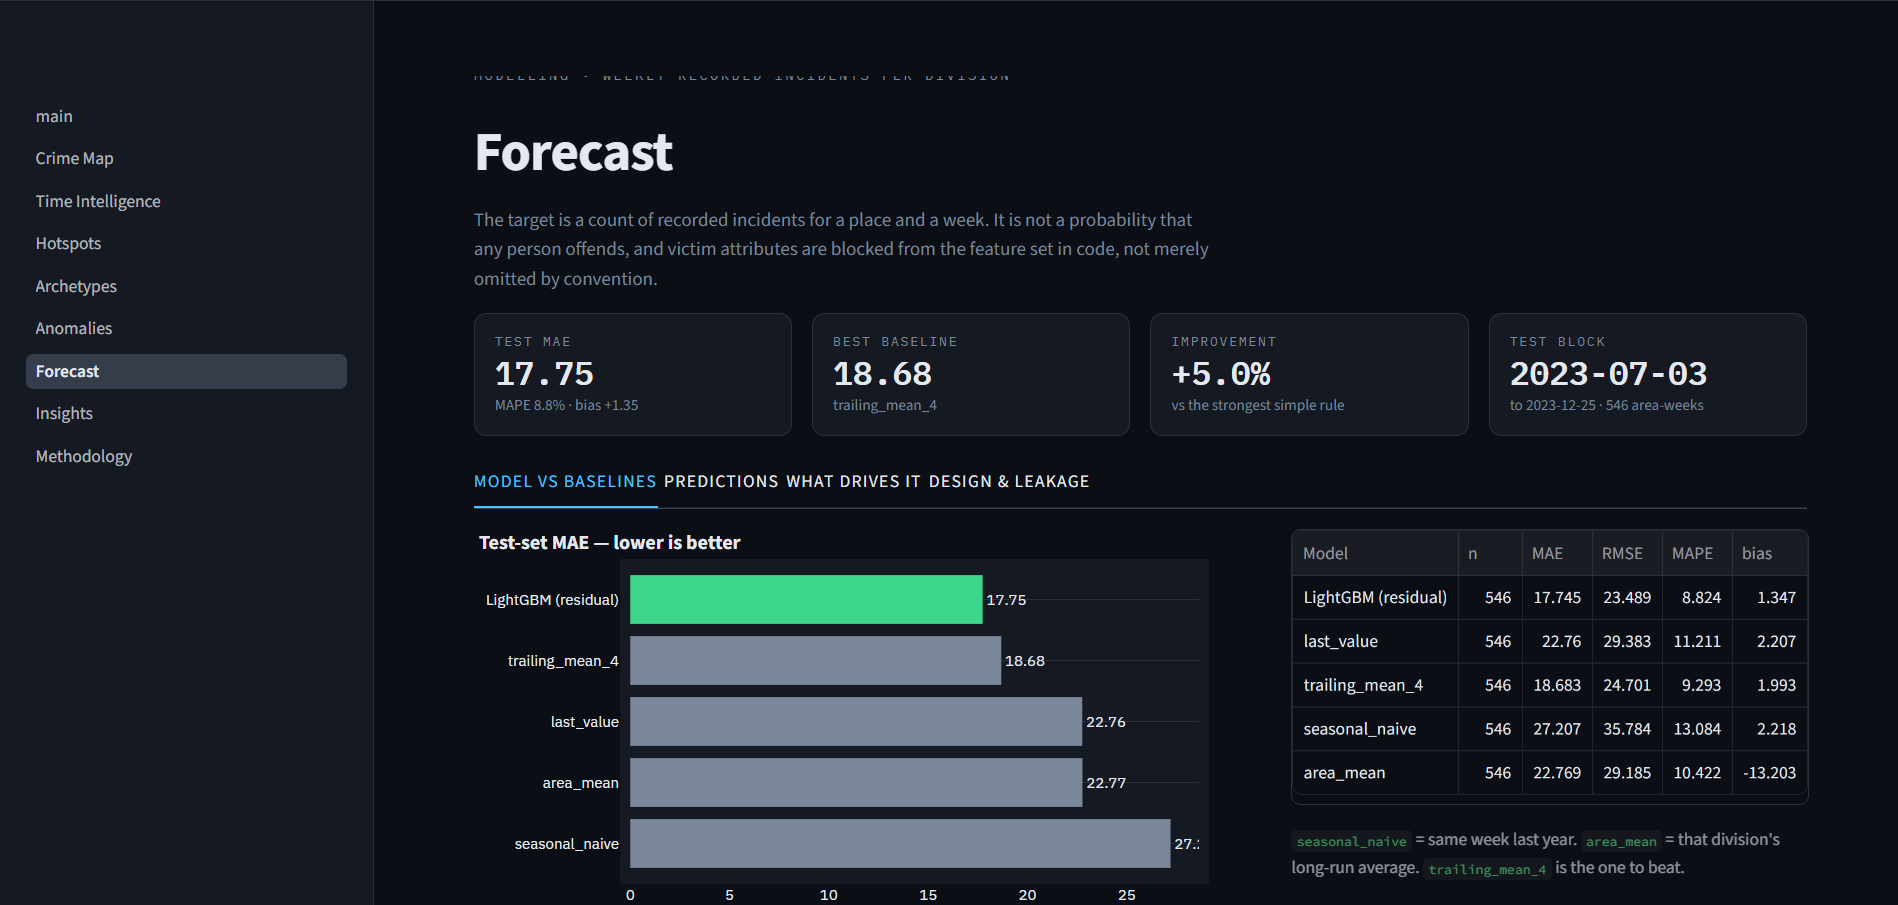
For anomaly detection, we compared weekly incident counts against a trailing 12-week median/MAD baseline, while forecasting was built using LightGBM alongside strong statistical baselines and evaluated on a chronological hold-out set.
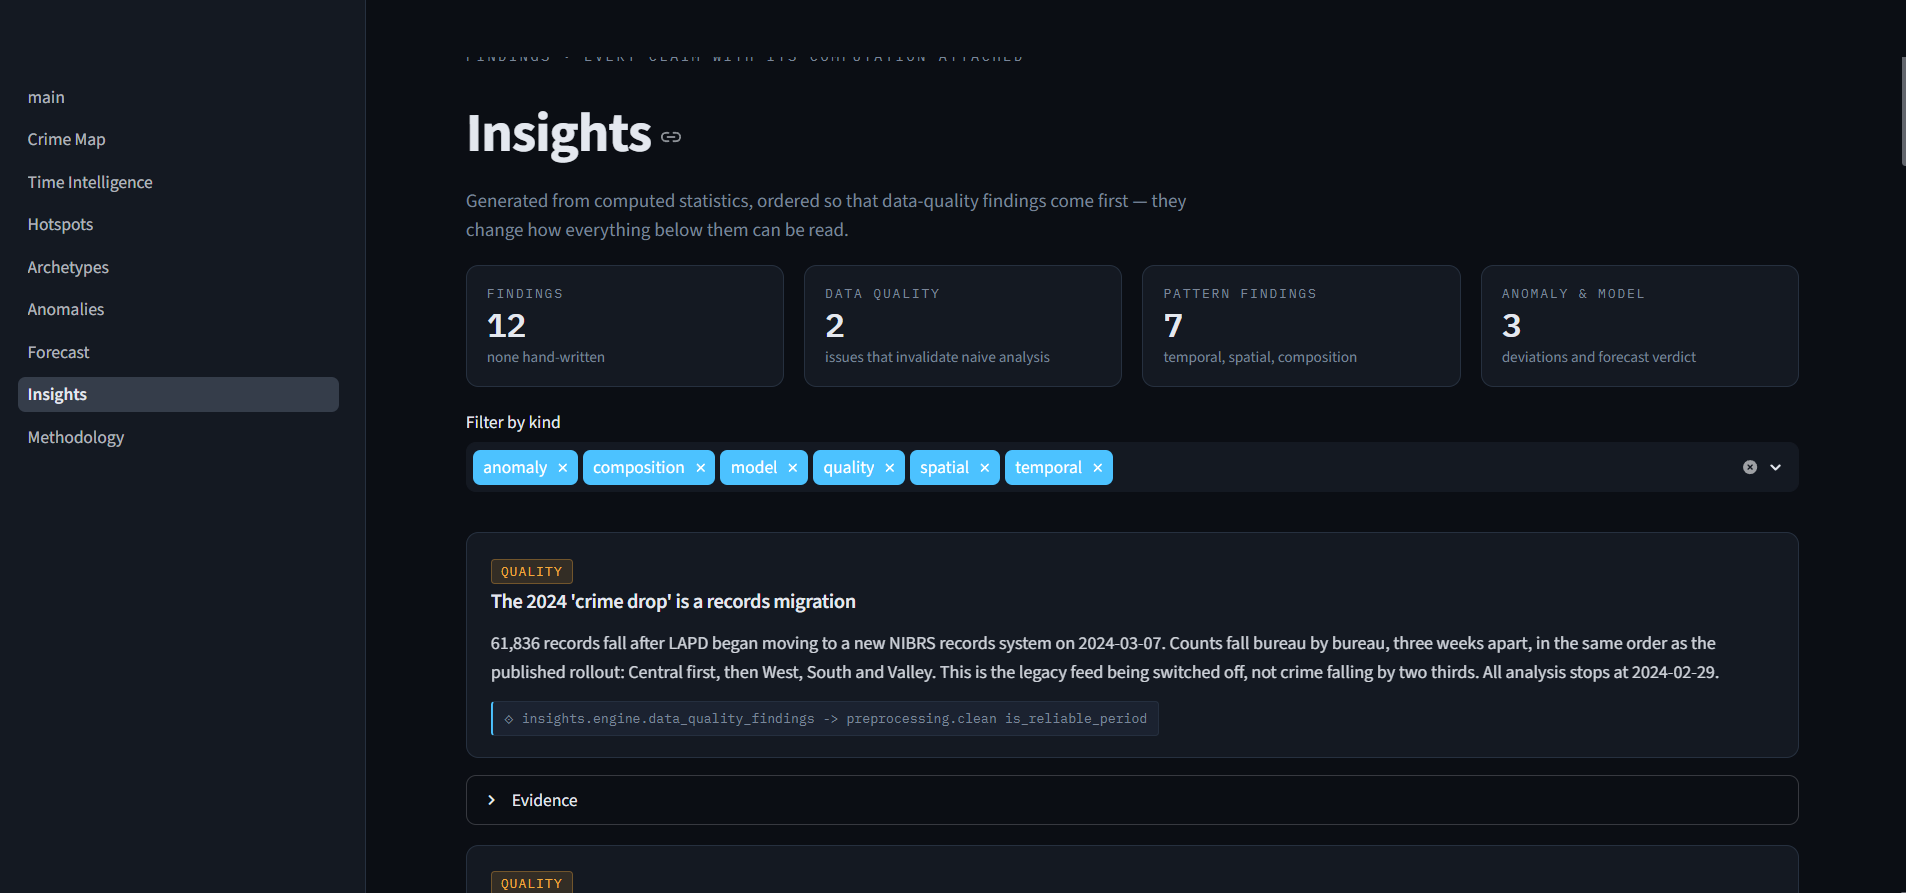
The interactive application was built with Streamlit, with all heavy computation performed beforehand in a dedicated pipeline. The app reads precomputed artifacts, keeping the interface responsive while allowing users to explore maps, temporal patterns, hotspots, archetypes, anomalies, forecasts, and traceable data-driven insights.
Challenges we ran into
One major challenge was working with large volumes of geographic and temporal data while keeping the visualizations responsive and meaningful. Plotting every incident individually can quickly become overwhelming, so we had to carefully aggregate and process data without losing important patterns.
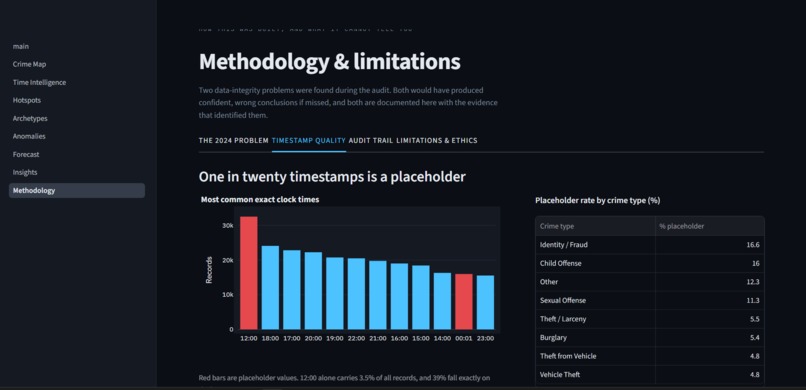
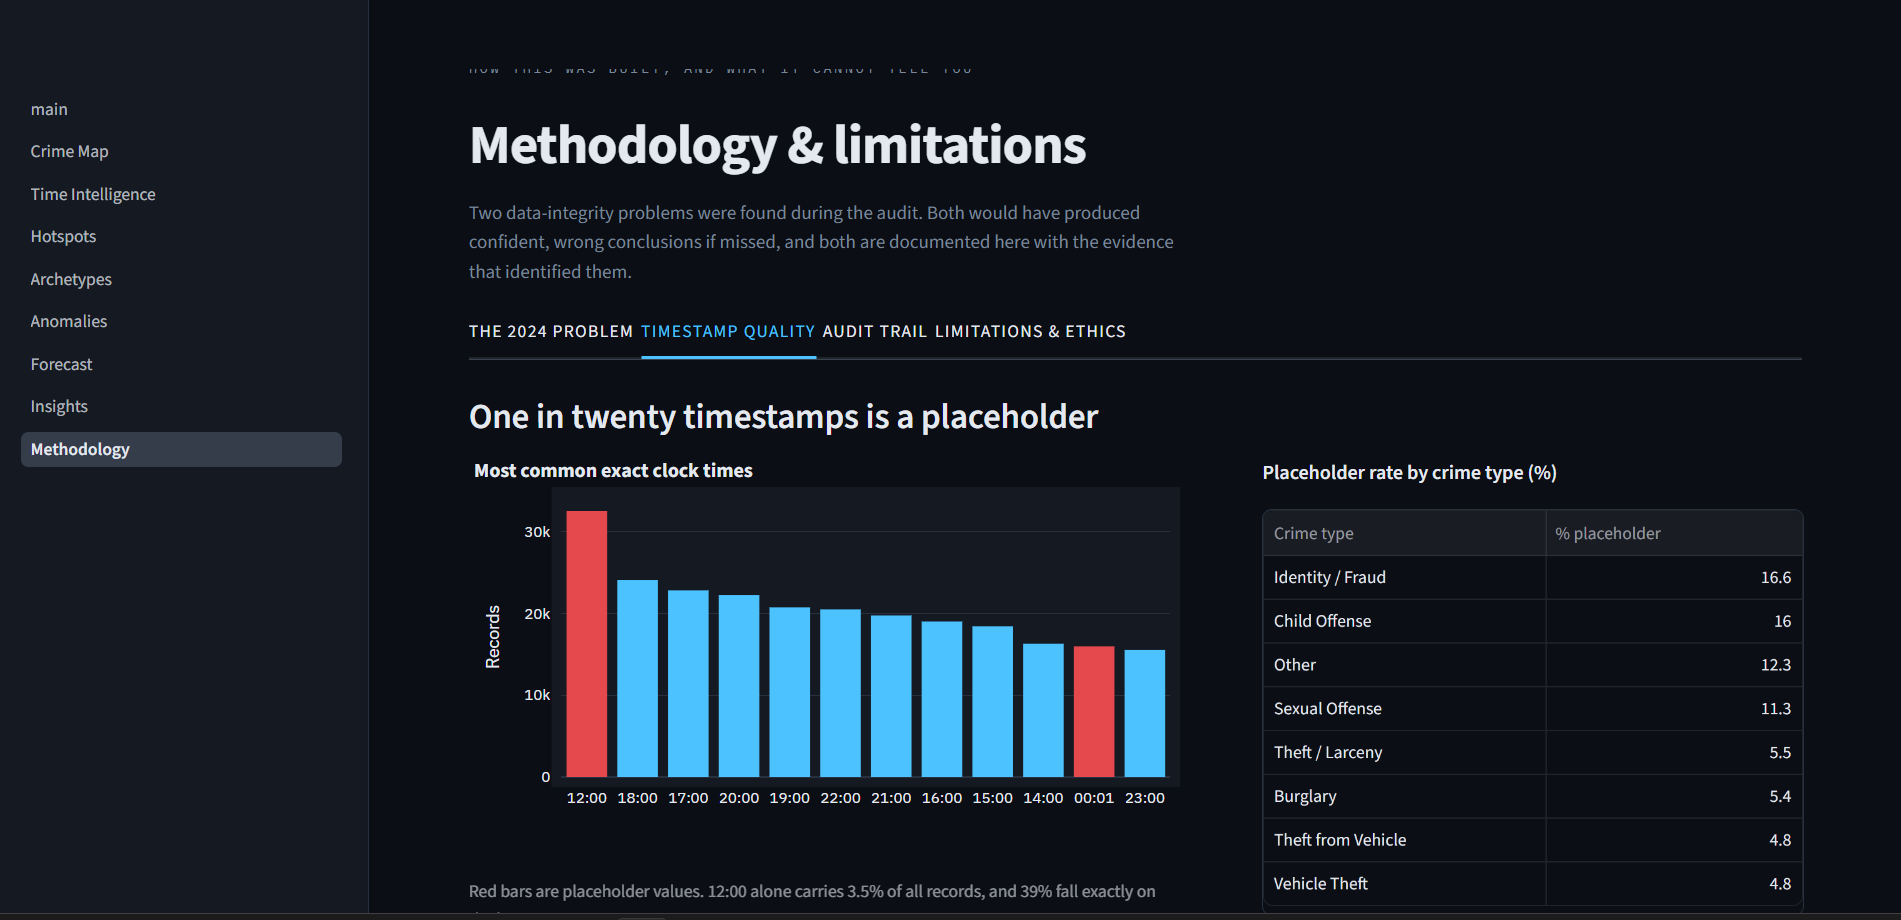
Another challenge was ensuring that our conclusions remained data-driven. Historical crime data can contain reporting and enforcement biases, so we avoided making causal claims or treating historical crime concentration as an absolute measure of an area's safety.
Accomplishments that we're proud of
We're proud that CrimePulse became more than a basic prediction model. We created a platform that combines multiple forms of analysis into one coherent system, allowing users to move from a high-level crime overview to detailed spatial, temporal, and anomaly-based insights.
The interactive heatmap and ability to explore changing crime patterns across space and time are especially important to us. Our focus was on making complex historical data understandable and useful.
What we learned
This project reinforced that meaningful data science is not always about using the most complicated model. Some of the strongest insights come from asking better questions and exploring the data from multiple perspectives.
We also learned the importance of distinguishing correlation from causation, validating patterns before presenting them as insights, and considering the limitations and biases present in real-world datasets.
What's next for CrimePulse
We plan to expand CrimePulse with additional datasets and richer contextual information where appropriate. Future versions could improve hotspot persistence analysis, anomaly detection, and forecasting of aggregate crime patterns.
We also want to develop more advanced comparisons between locations and time periods, allowing users to answer questions such as “What changed here?” and “How does this area's crime profile differ from others?”
Ultimately, we see CrimePulse evolving into a more comprehensive platform for exploring how historical crime patterns change across space and time.
Built With
- analysis
- anomaly
- dbscan
- detection
- geographic
- information
- learning
- lightgbm
- machine
- numpy
- pandas
- python
- science
- scikit-learn
- series
- streamlit
- systems
- time
- visualization


Log in or sign up for Devpost to join the conversation.