Inspiration
Initially, we say a beautiful representation of data using d3.js and mapbox. We decided that it would be nice to apply the same concepts to the DC open data project. Through mapbox.js and DC open data, we are able to analyze the position and individual crimes that occurred in Washington D.C. in 2013.
How it works
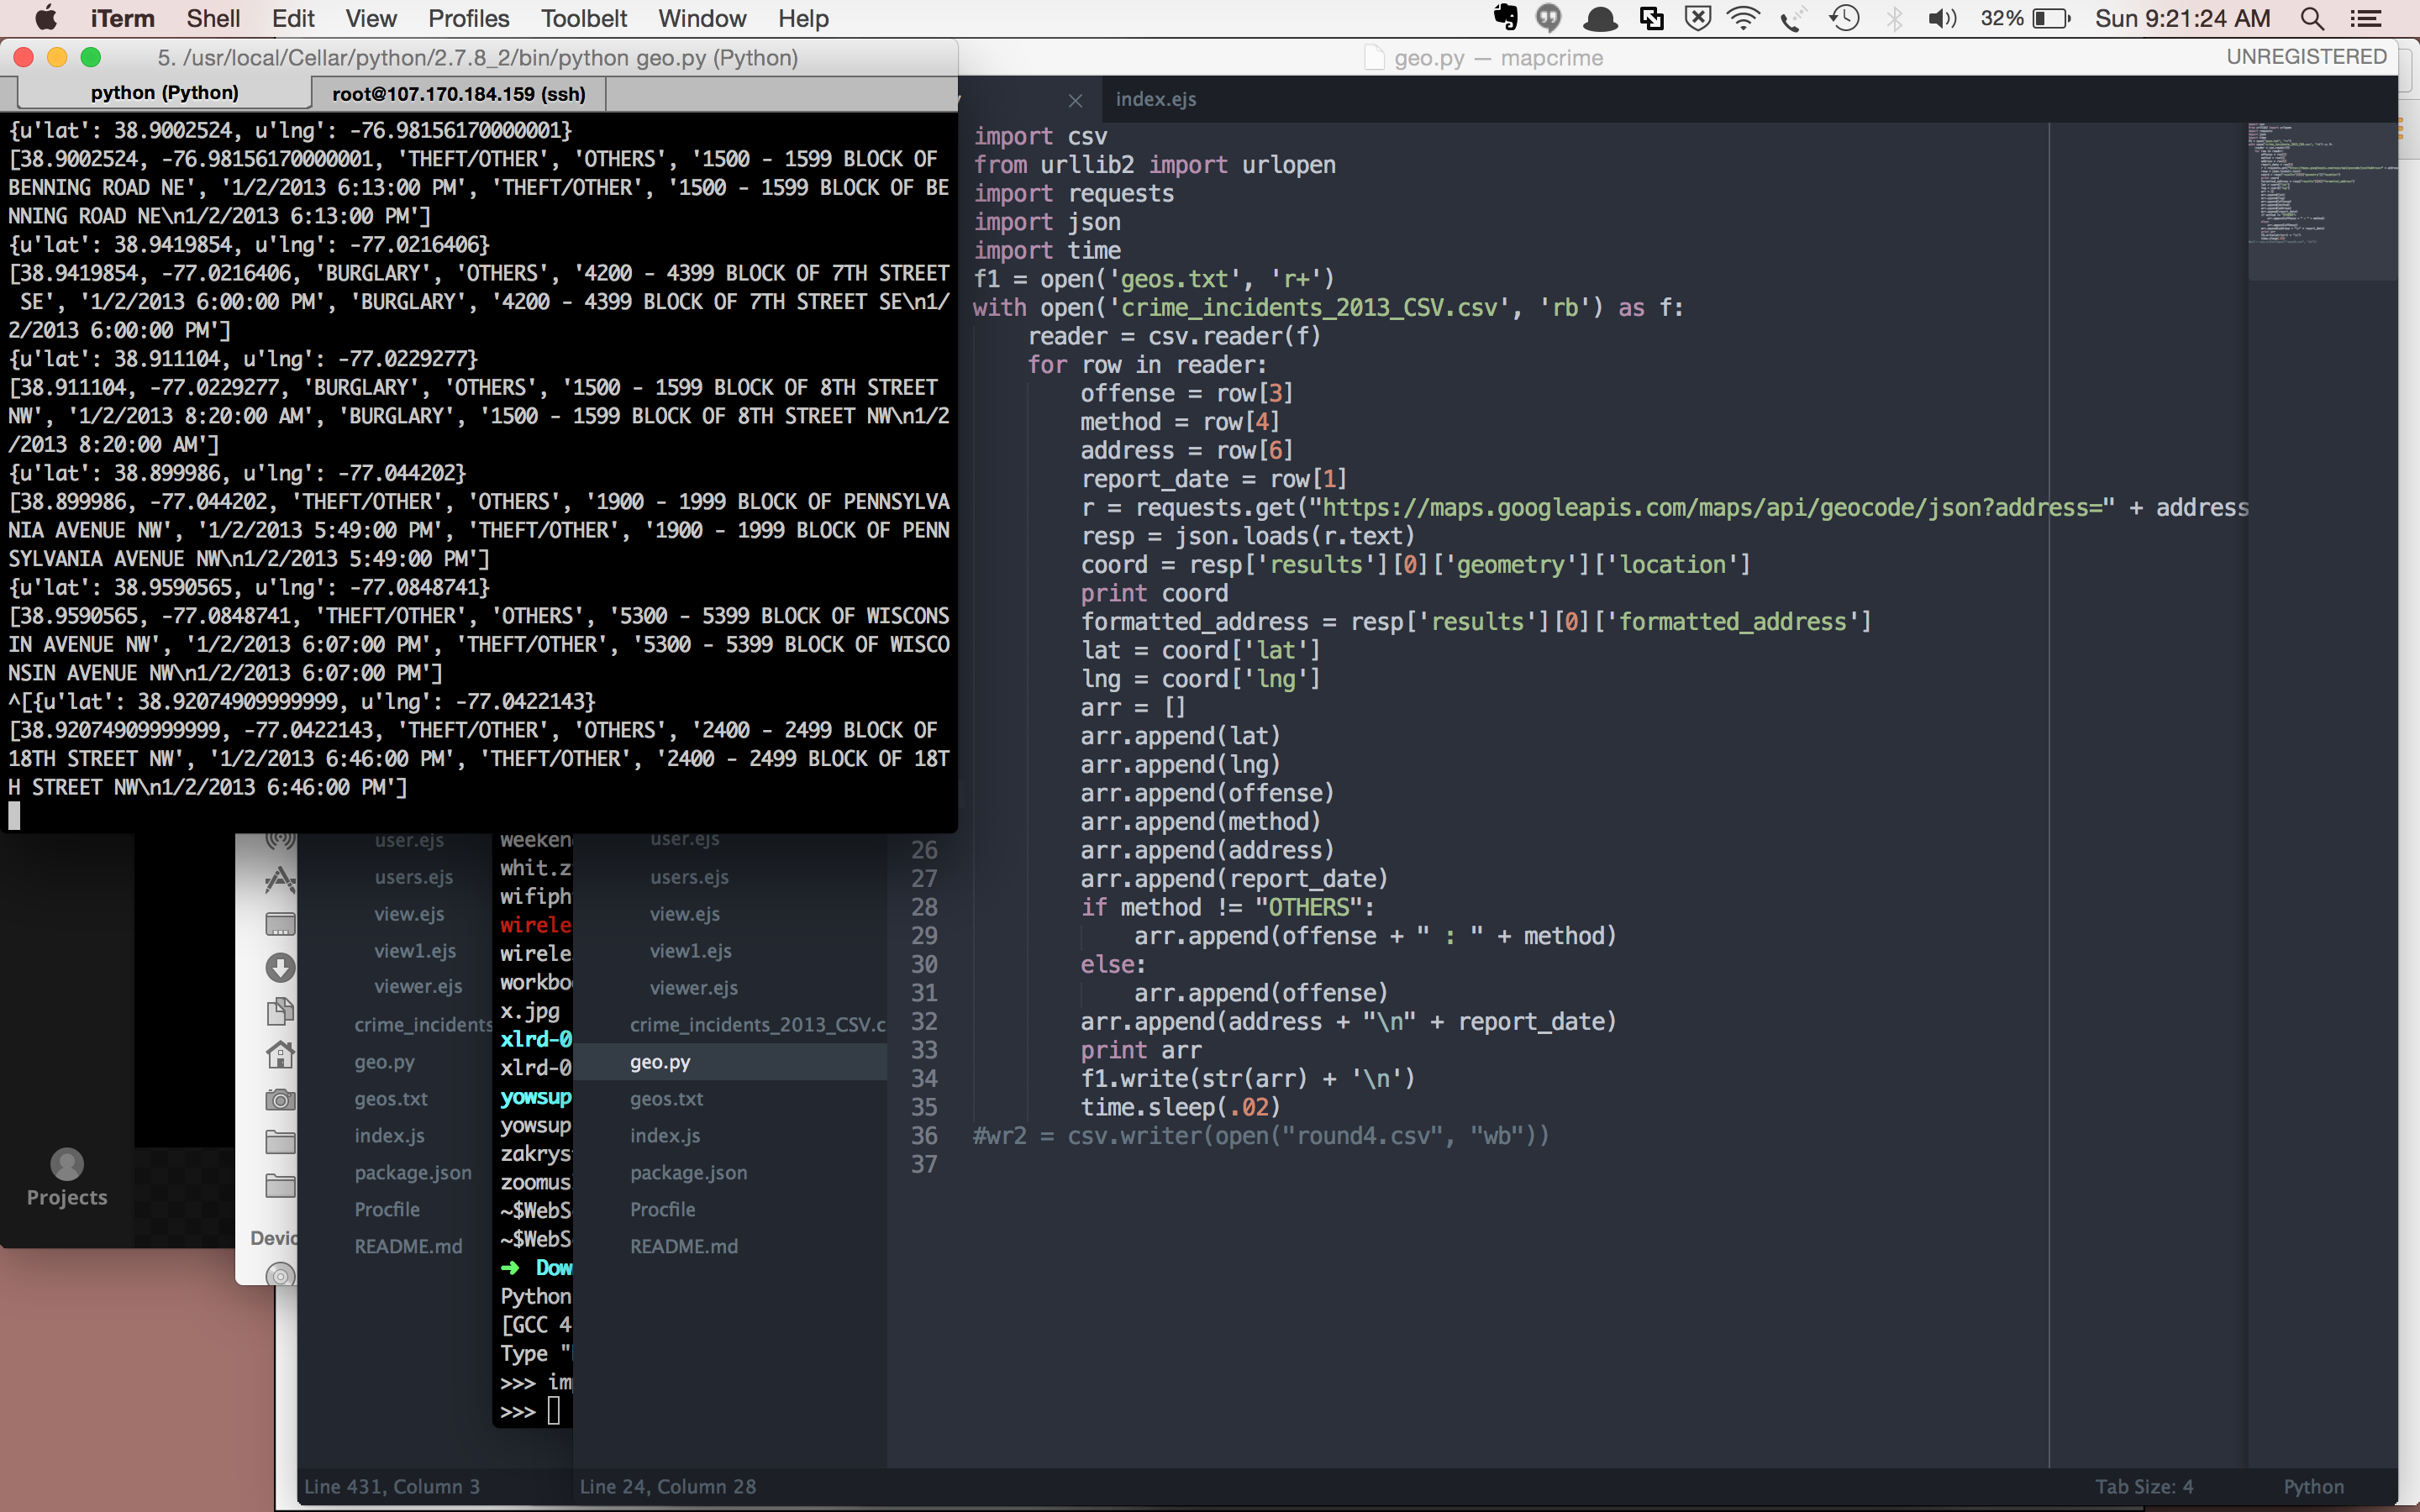
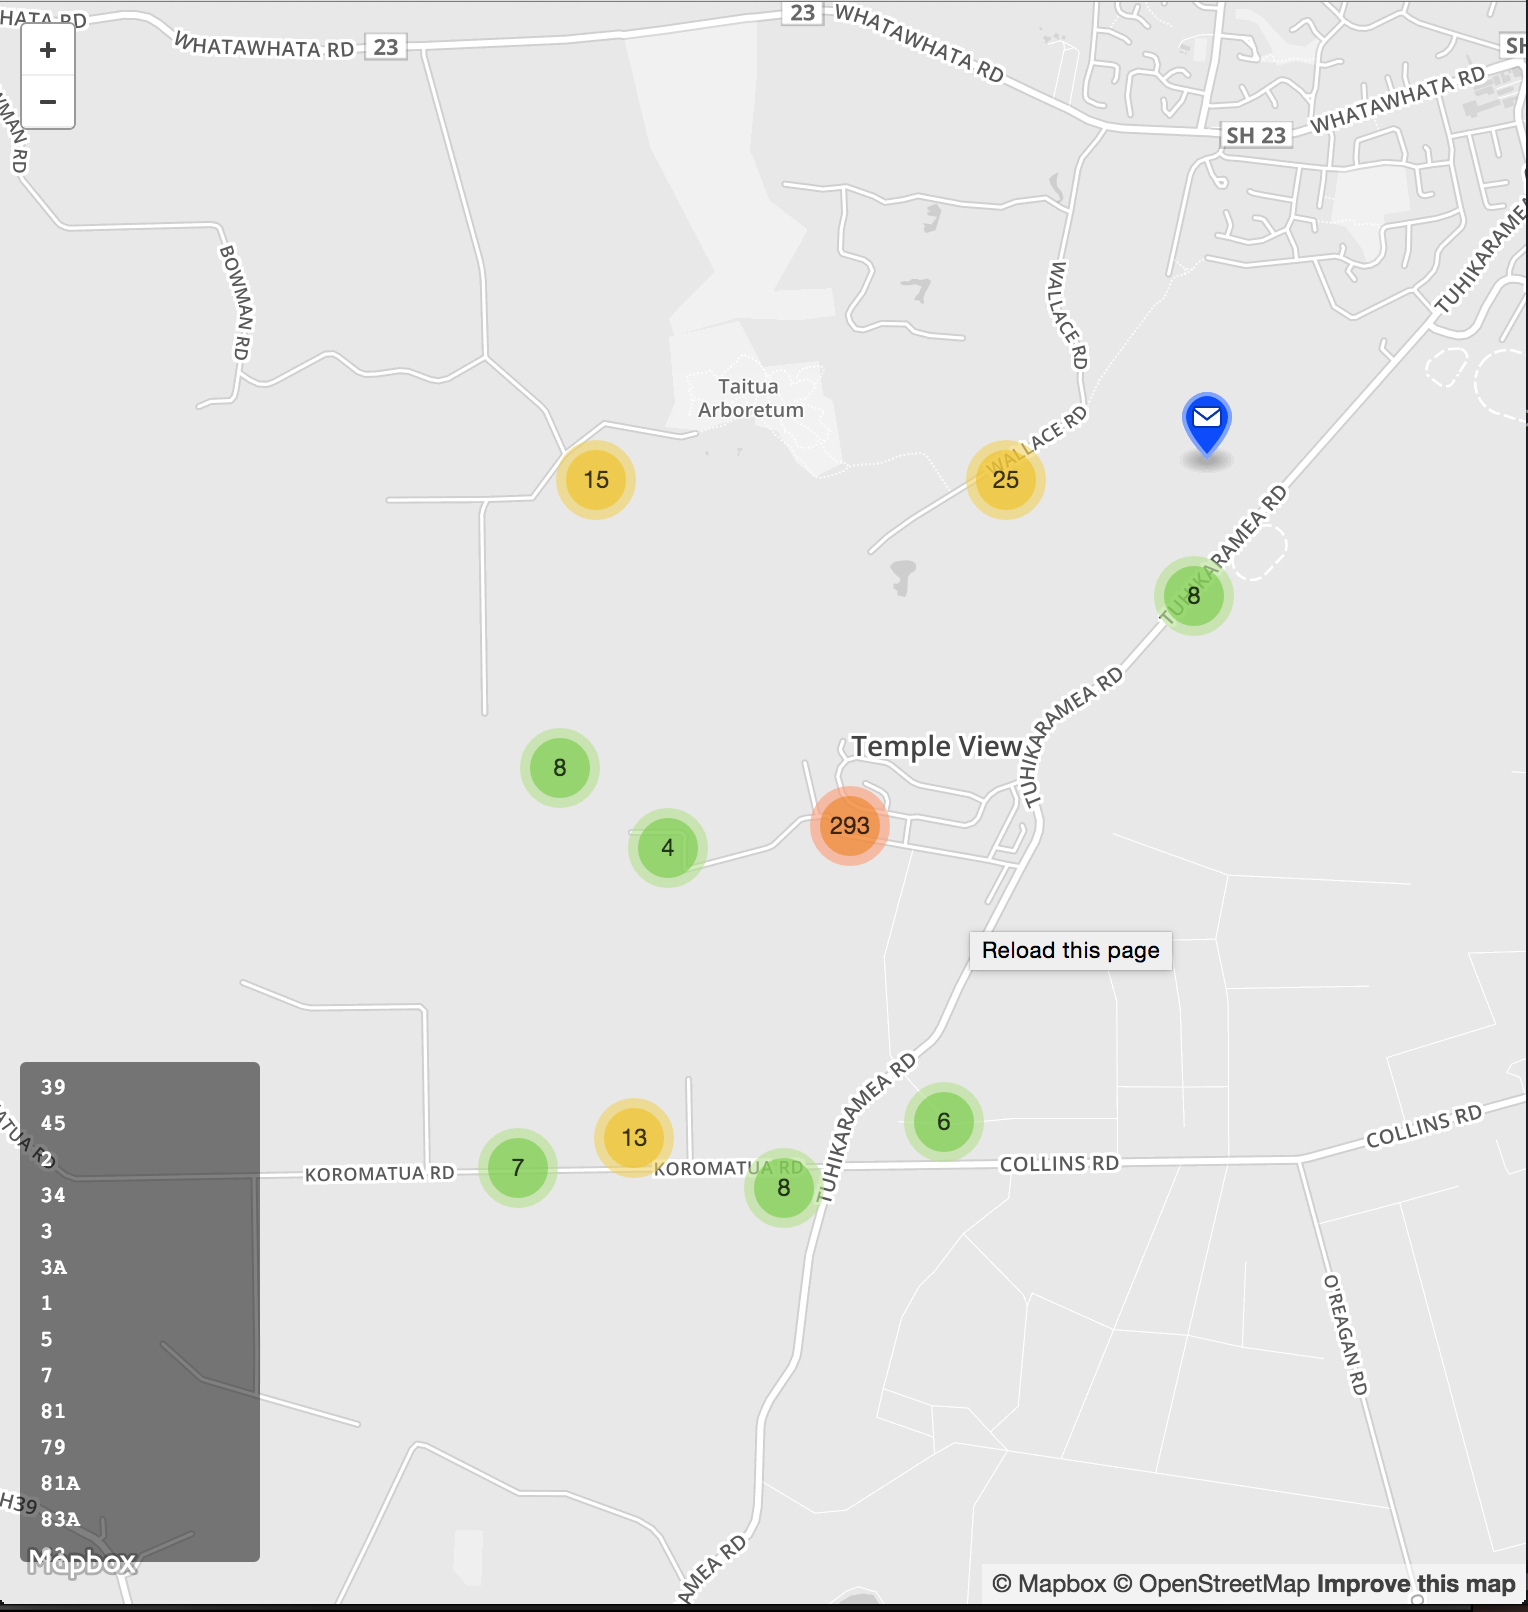
Our hack takes Washington D.C. crime data and geolocates it to a spot on the map, plots it, categorizes it and makes visualization easy.
Challenges I ran into
Short time-frame to complete hack
Accomplishments that I'm proud of
We are most bringing all the elements together in a very short amount of time.
What I learned
Coding in javascript, using Mapbox, analyzing and visualizing geolocation data
What's next for CrimeDC
Making more data sources available for viewing through the framework!
Built With
- google-maps
- html5
- javascript
- mapbox
- open-dc-data
- python


Log in or sign up for Devpost to join the conversation.