-
-
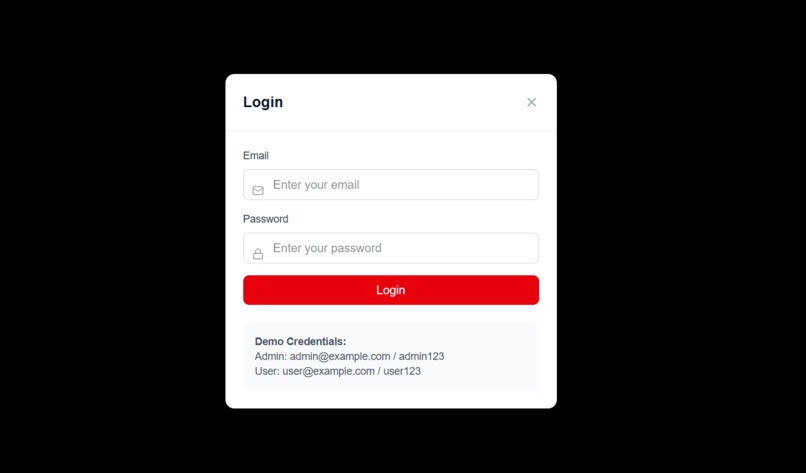
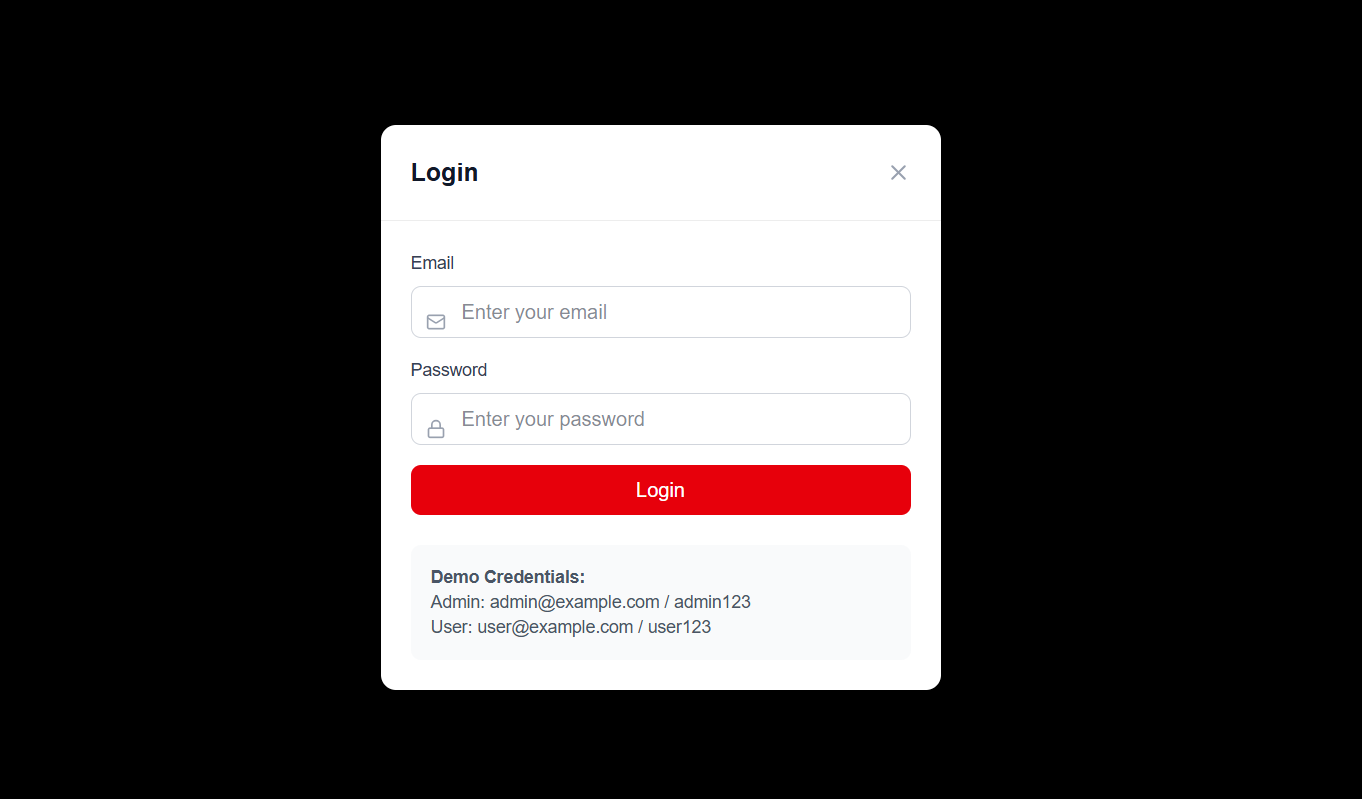
Authentication
-
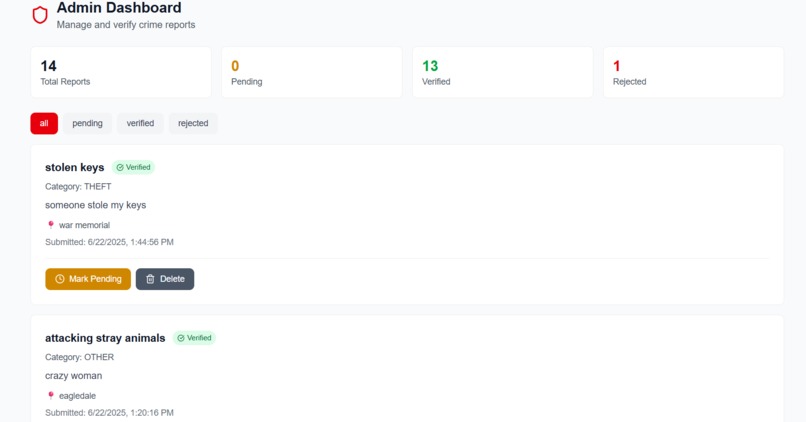
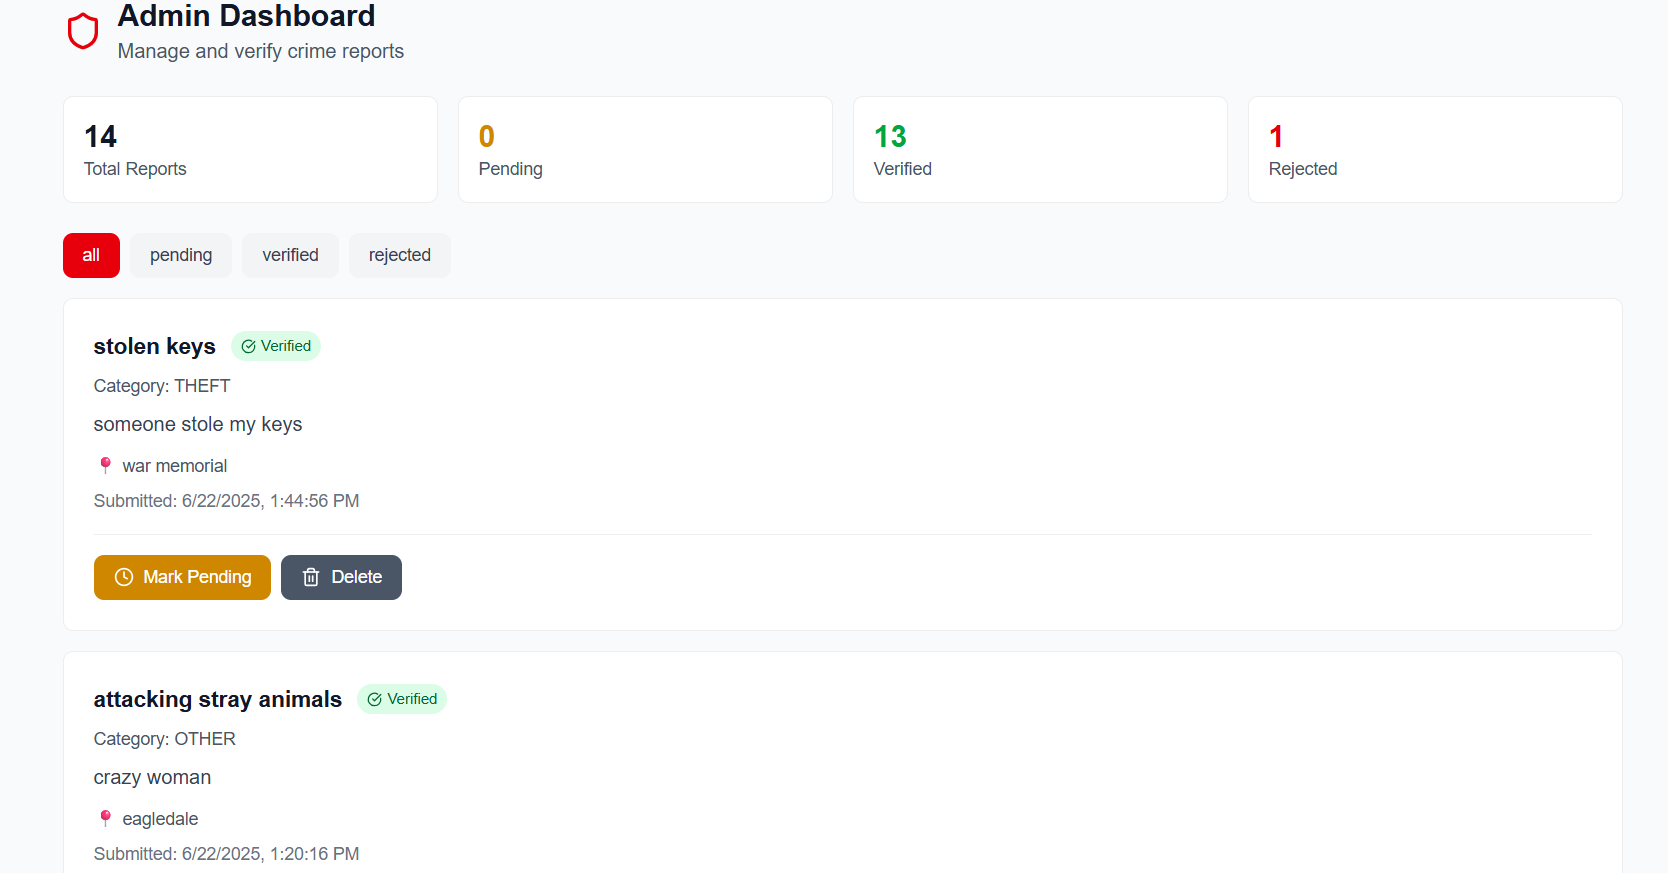
Admin Dashboard
-
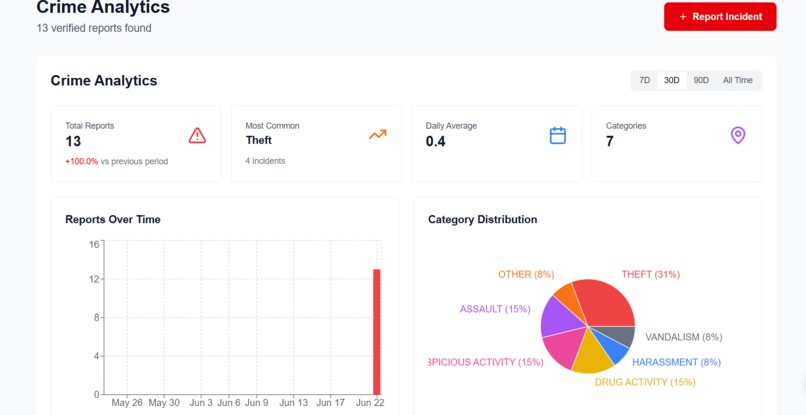
Analytics Dashboard
-
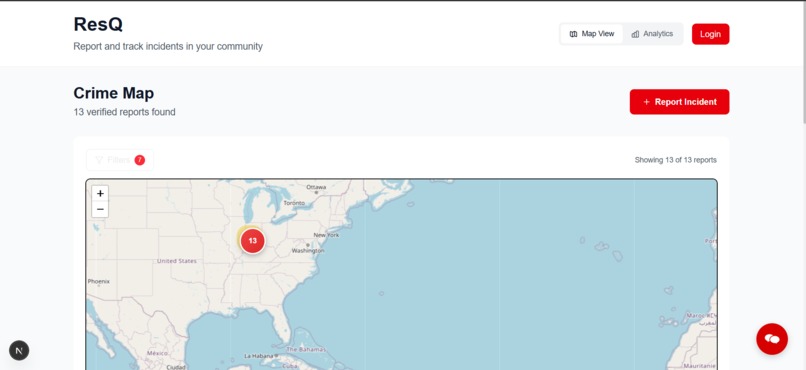
Landing page
-
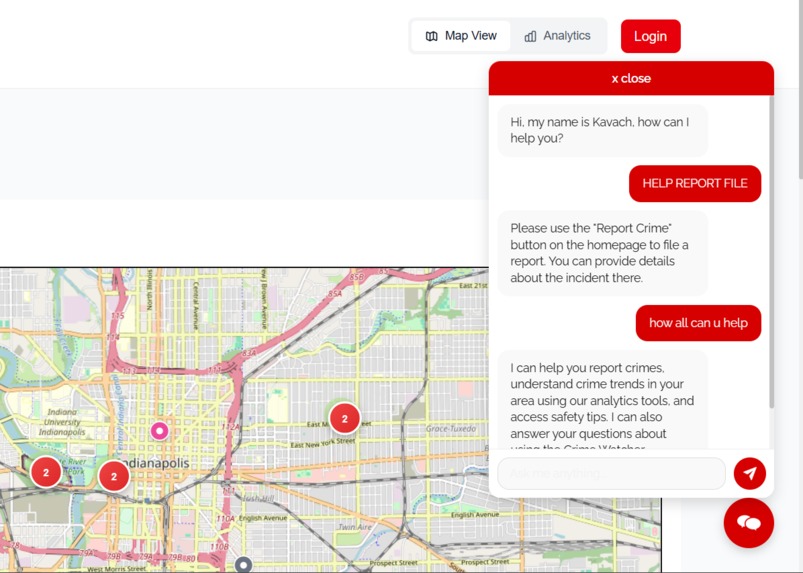
RAG Chatbot
-
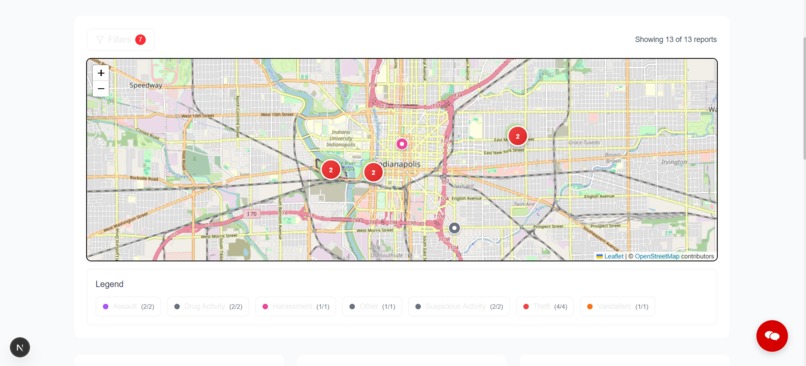
Reports on map
ResQ was born out of a vision to make our communities safer and more connected by leveraging the power of modern web technologies and AI. We noticed that many people hesitate to report crimes due to inconvenient systems, lack of anonymity, or poor response cycles. Additionally, there was no easy way to analyze patterns of crime in real time for proactive decision-making. ResQ aims to bridge this gap by offering an all-in-one platform for citizens and administrators to report, visualize, analyze, and respond to criminal activities with ease.
💡 Inspiration
We were inspired by the need for a faster, more community-driven way to report and respond to crimes or suspicious activity, especially in areas where traditional systems are slow, inaccessible, or fragmented. In many cases, people don’t report incidents due to inconvenience, lack of anonymity, or unclear workflows. We envisioned a solution that empowers citizens, supports law enforcement, and creates a transparent crime-reporting ecosystem using maps, data, and AI.
🚨 What it does
ResQ is a full-stack crime tracking and response platform that enables users to:
- Report crimes or suspicious activity using a location-based form
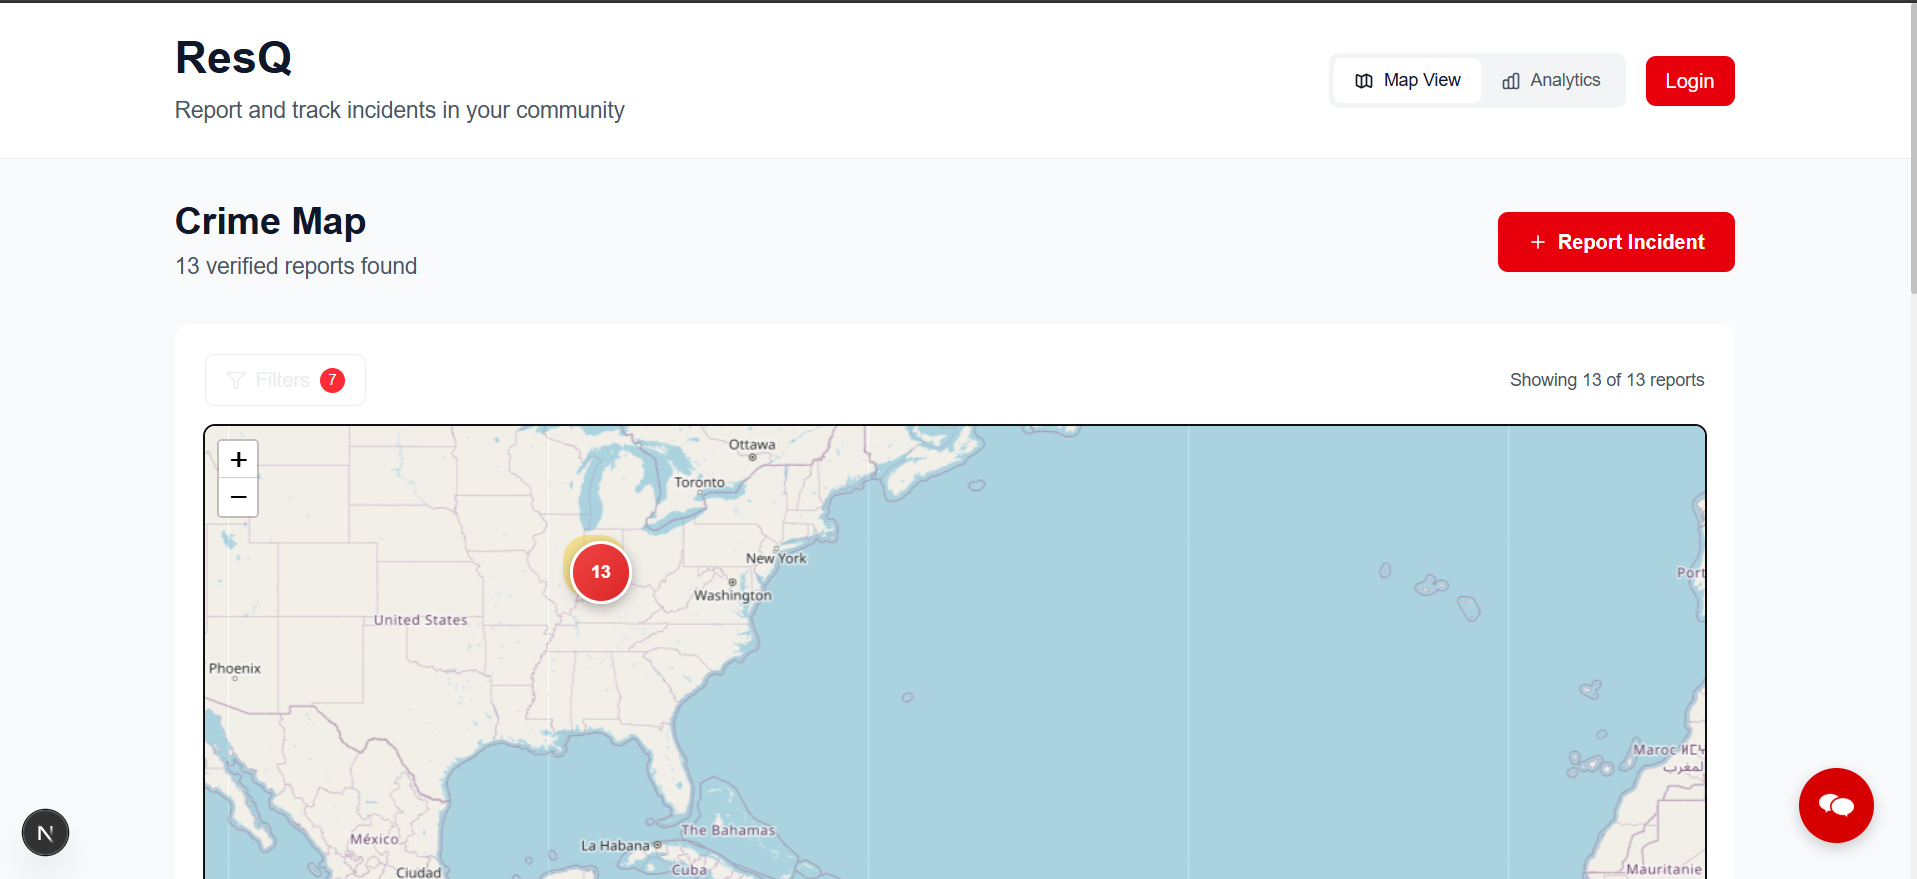
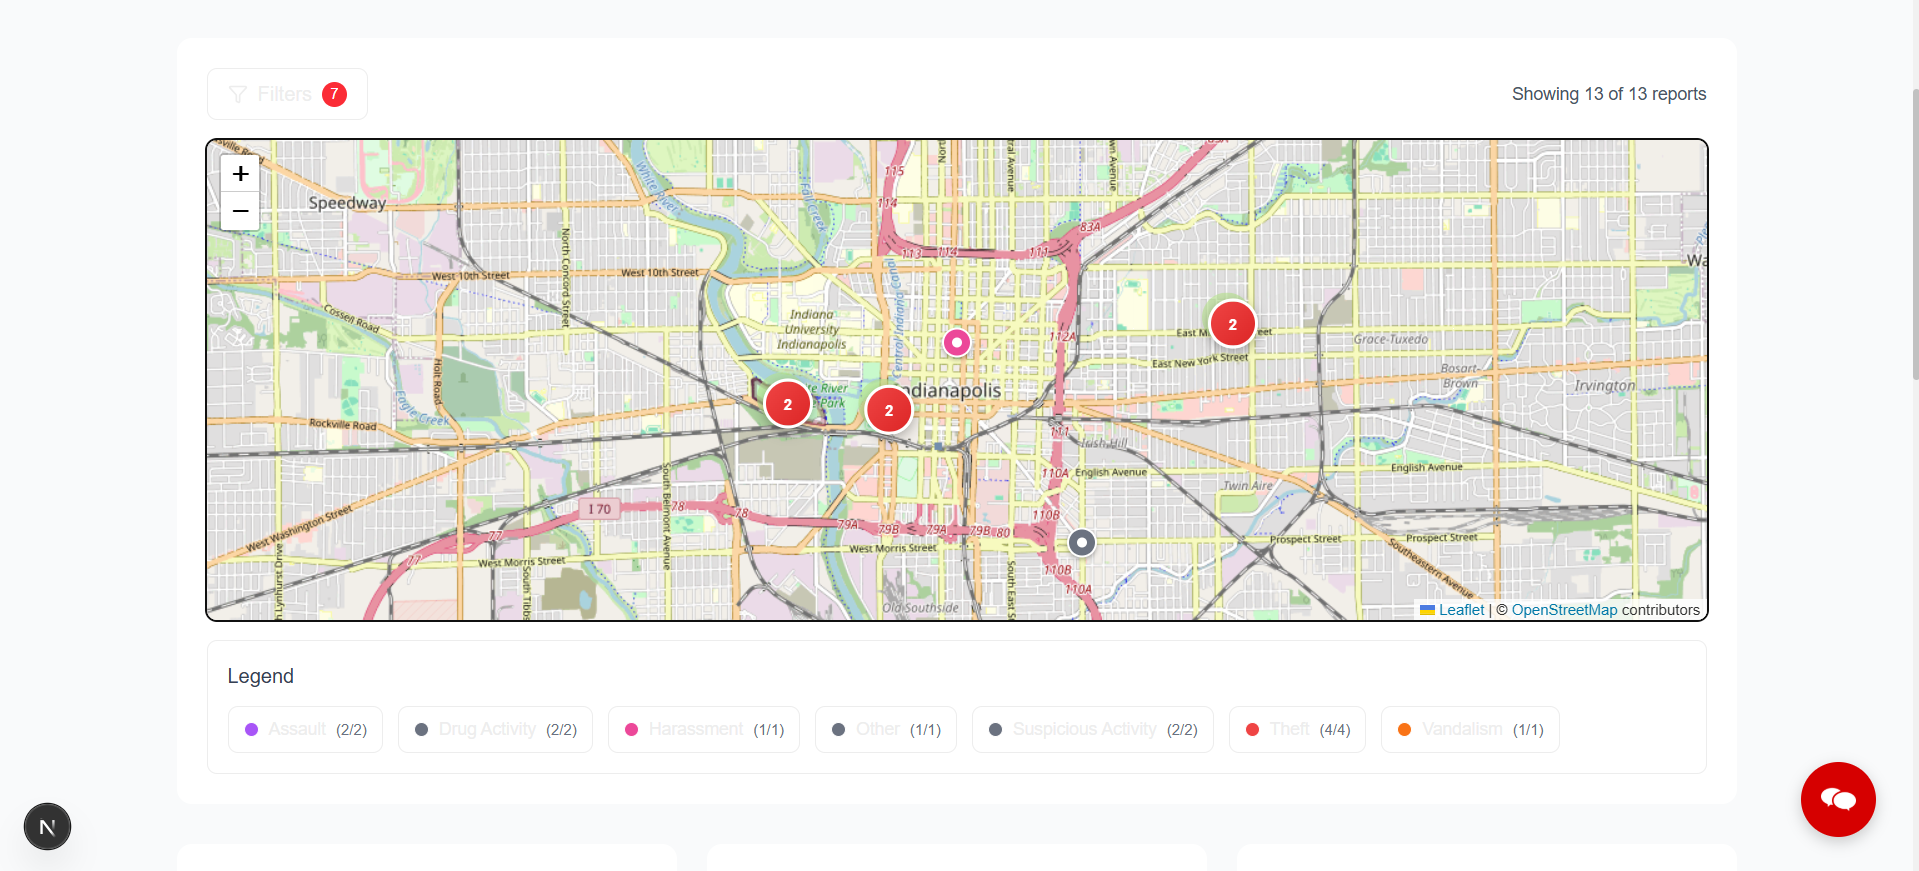
- Visualize reported crimes on an interactive map with clustering and filtering
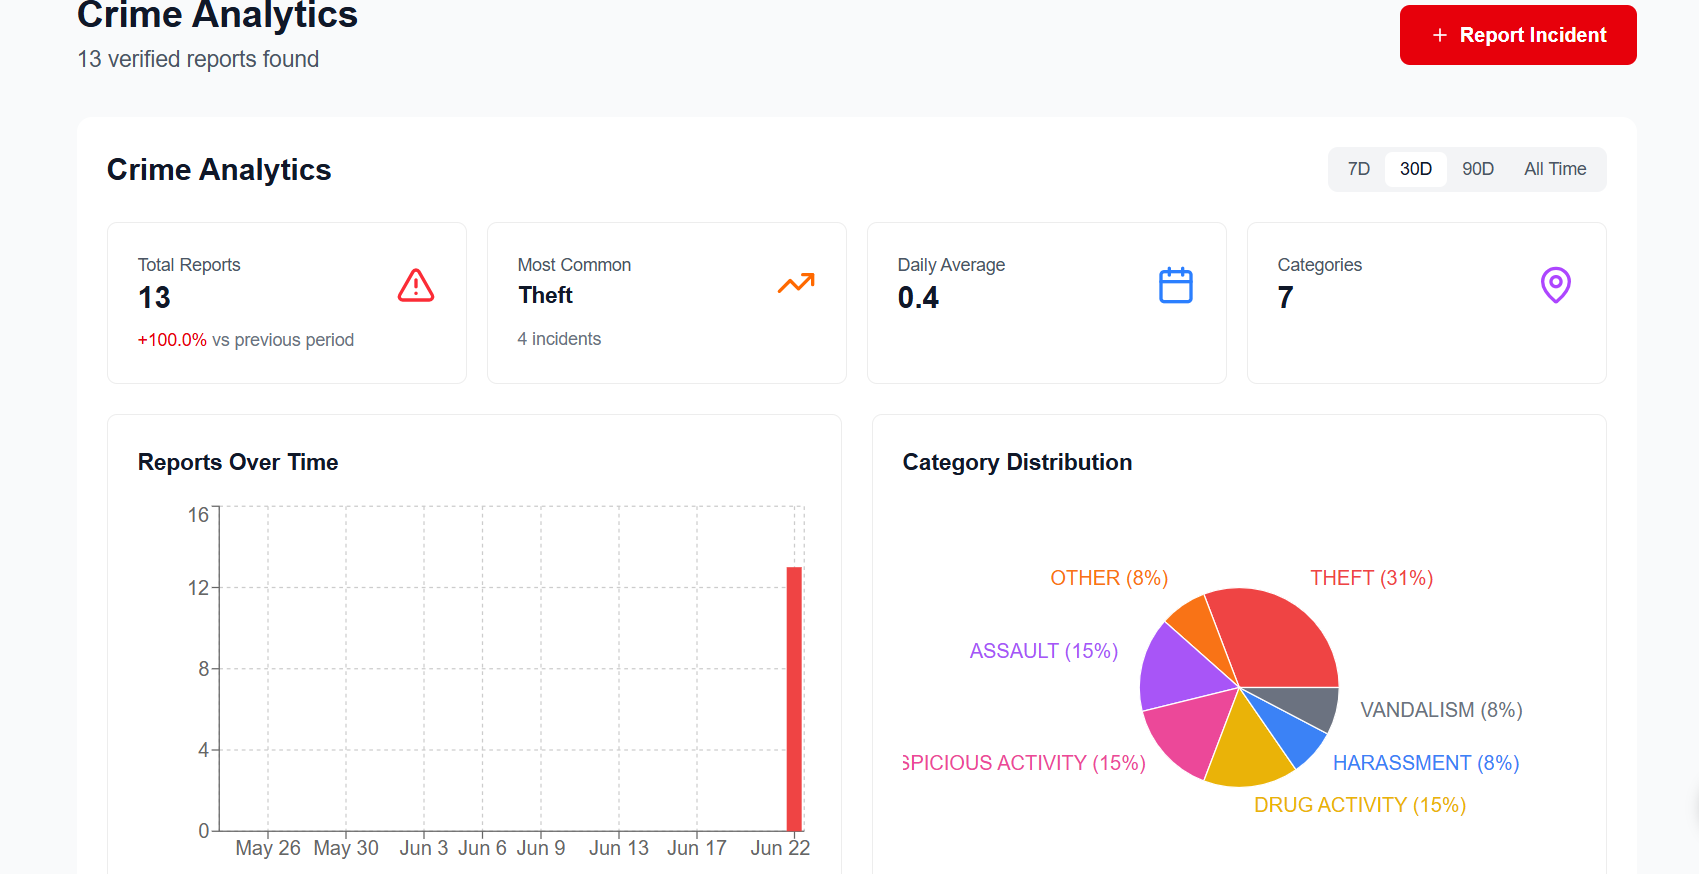
- Analyze crime patterns via a trends dashboard (by category, time, zone)
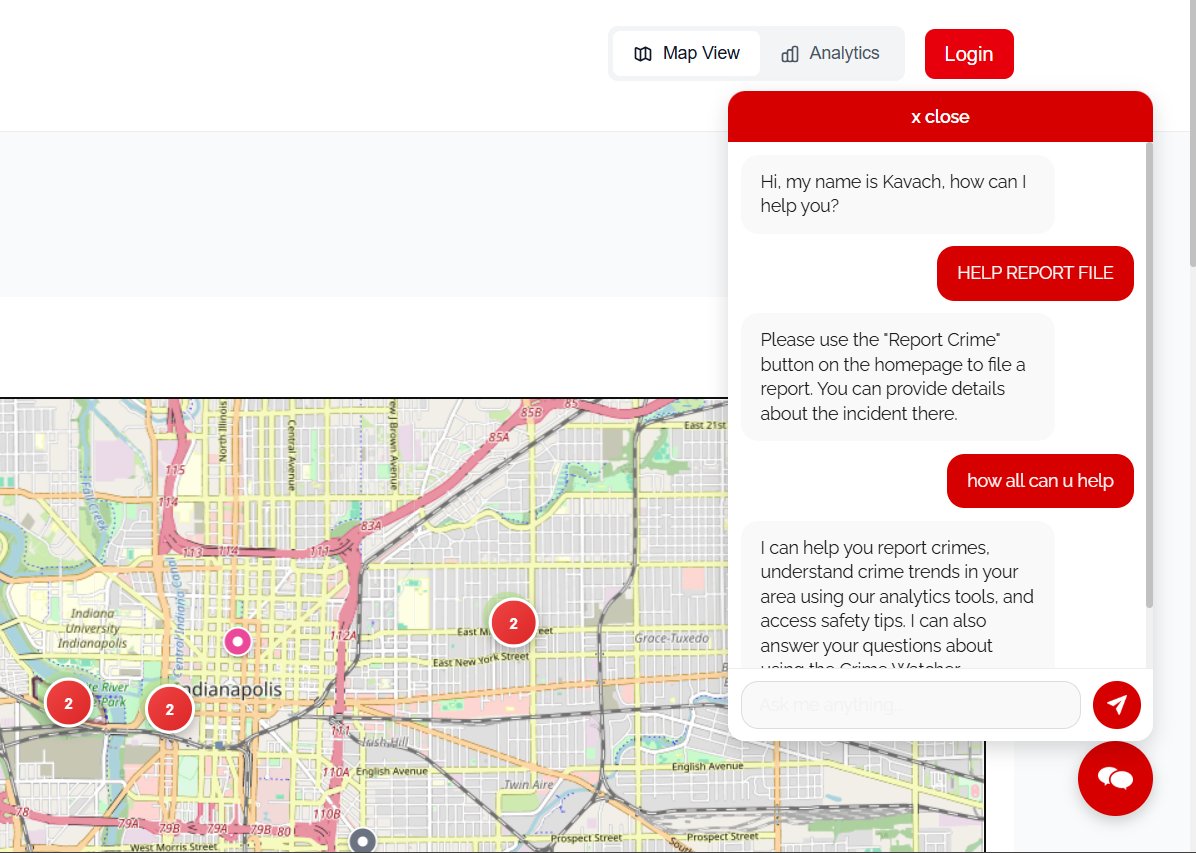
- Chat with an AI assistant (Kavach) to query crime data conversationally
- Provide admin tools for verifying, flagging, or moderating reports securely
🛠️ How we built it
- Frontend: Built with Next.js, Tailwind CSS, and Leaflet for responsive UI and dynamic map visualizations. Forms, filters, and charts were crafted to be intuitive and fast.
- Backend: Developed using NestJS, TypeScript, Prisma, and PostgreSQL to manage report data, authentication, and admin workflows.
- Authentication: Implemented using JWT to secure admin and user access and report moderation.
- Chatbot (Kavach): Integrated using Google Gemini API to answer queries related to ResQ and crimes.
- Charts: Used Recharts and Chart.js to build the analytics dashboard for trends and statistics.
- Map Clustering: Leaflet’s clustering tools were used to handle large datasets smoothly on the map.
🧗 Challenges we ran into
- Synchronizing real-time updates across the map view and database.
- Managing media uploads (like photos) while keeping the UI smooth.
- Ensuring clean and secure role-based admin features without overengineering.
- Visualizing large datasets on maps without losing performance.
🏆 Accomplishments that we're proud of
- Built a full-stack crime reporting and visualization system from scratch.
- Successfully integrated AI for an engaging user experience.
- Designed and implemented secure admin tools and moderation workflows.
- Created a clean, map-first UI that supports both public users and administrators.
- Developed insightful analytics to help track crime trends across time and locations.
📚 What we learned
- Deep understanding of building and deploying a full-stack app with NestJS + Next.js.
- How to handle location-based data and visualize it interactively with Leaflet.
- Best practices for integrating AI assistants into real-world applications.
- Role-based authentication and securing admin routes using JWT.
- Designing for both performance (map/data clustering) and usability (UX-first forms and filters).
🔮 What's next for ResQ
- WhatsApp Integration: Allow users to report crimes or receive alerts via WhatsApp for wider accessibility and real-time reporting.
- Alert & Notification System: Notify users when incidents are reported nearby or when a report status changes, using email or SMS services.
- Multi-language Support: Make the platform accessible in local languages to improve inclusivity.
- Mobile App: Build a React Native version for quick mobile access and push notifications.
ResQ is more than just a project — it's a step toward safer, smarter, and more engaged communities.
Built With
- chart.js
- css
- geminiapi
- html
- javascript
- jwt
- leaflet.js
- nestjs
- next.js
- node.js
- postgresql
- prisma
- recharts
- tailwind
- typescript


Log in or sign up for Devpost to join the conversation.