


This SAP HANA and Lumira based application allows the city to visualize three different areas:
I. CRIME INCIDENTS: facilitates geographic analysis of crime data to get a detailed understanding of high crime areas and hot spots. Allows to configure (slice and dice) by allowed dimensionon the fly, select TOP N incidents, change visualization type on the fly as well as well as toggle between dashboard, map and chart view as well as a detail grid of all the records once at a comfortable level of drill down.
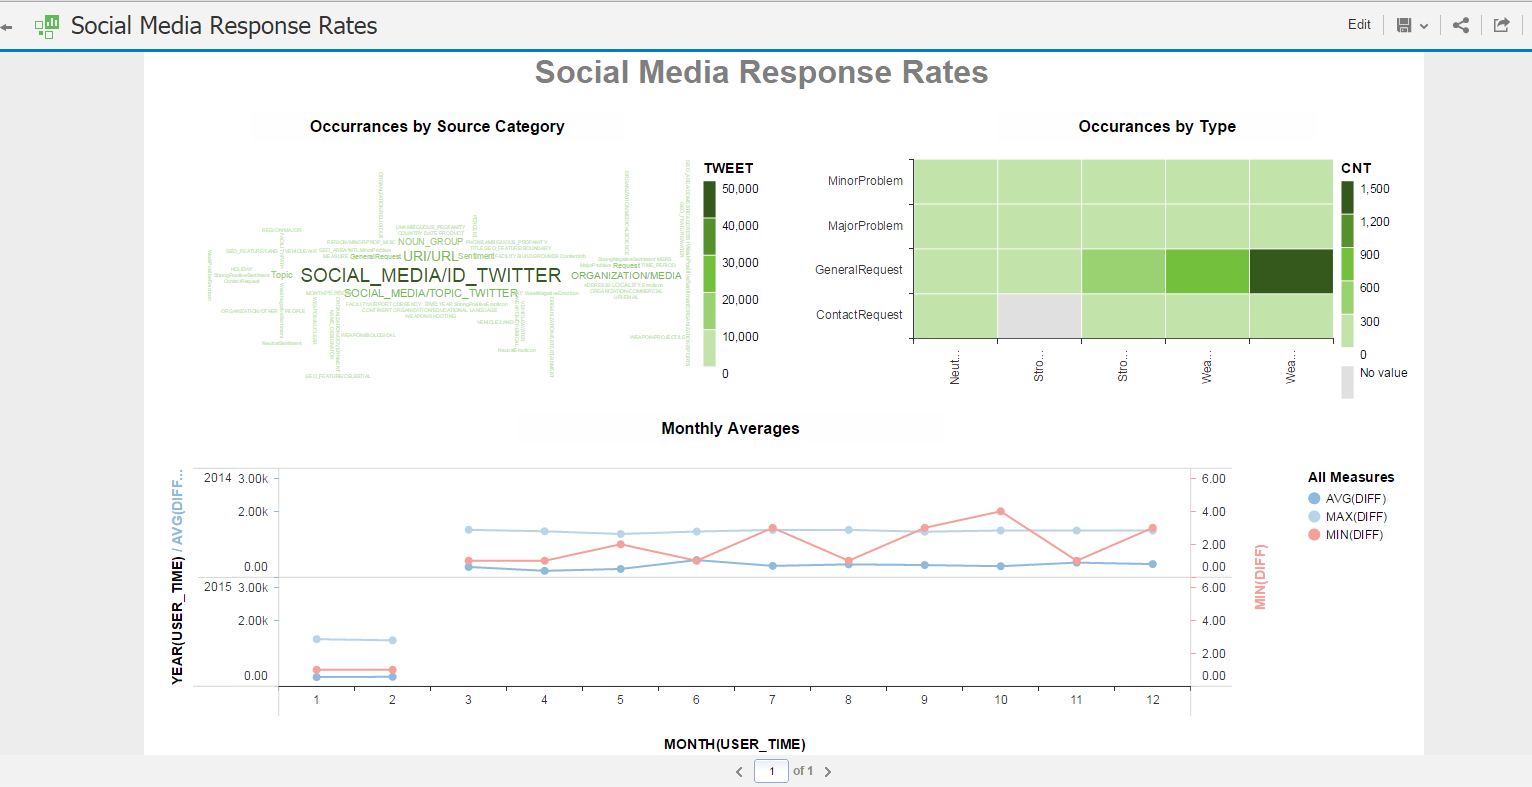
II. Sentiment Analysis 1) CATEGORY_OCCURRENCES Category statistics (generated using Text Analysis in HANA) – Category/Entity type detected from tweets (Problem, Request, Locality, Address, Sentiment, etc.), their occurrences and number of associated tweets.
2) SENTIMENT_OCCURRENCES Sentiment statistics (generated using Text Analysis in HANA) – Sentiment detected in tweets (ranging from StrongPositive to StrongNegative), their occurrences and number of associated tweets.
3) TOPIC_SENTIMENT_SCORE Quantified measure of sentiment per topic – Topics indicate the central idea of tweets (generated using Text Analysis in HANA) – Each topic and overall associated sentiment score (sum of all sentiment scores for tweets belonging to each topic) – Sentiment score is calculated using the following metrics (StrongPositive is +2, WeakPositive is +1, Neutral is 0, WeakNegative is -1, StrongNegative is -2).
4) COOCCURRENCE_MATRIX Co-occurrence of categories (category/entity as described in #2 above) in tweets – Category 1, Category 2, occurrences of these two categories together and a normalized score to indicate significant co-occurrences (higher the better)
5) FILTERED_COOCCURRENCE_MATRIX Co-occurrence of specific type of categories in tweets – Category 1 = Sentiment, Category 2 = Request or Problem, occurrences of these two categories together and a normalized score to indicate significance (higher the better)
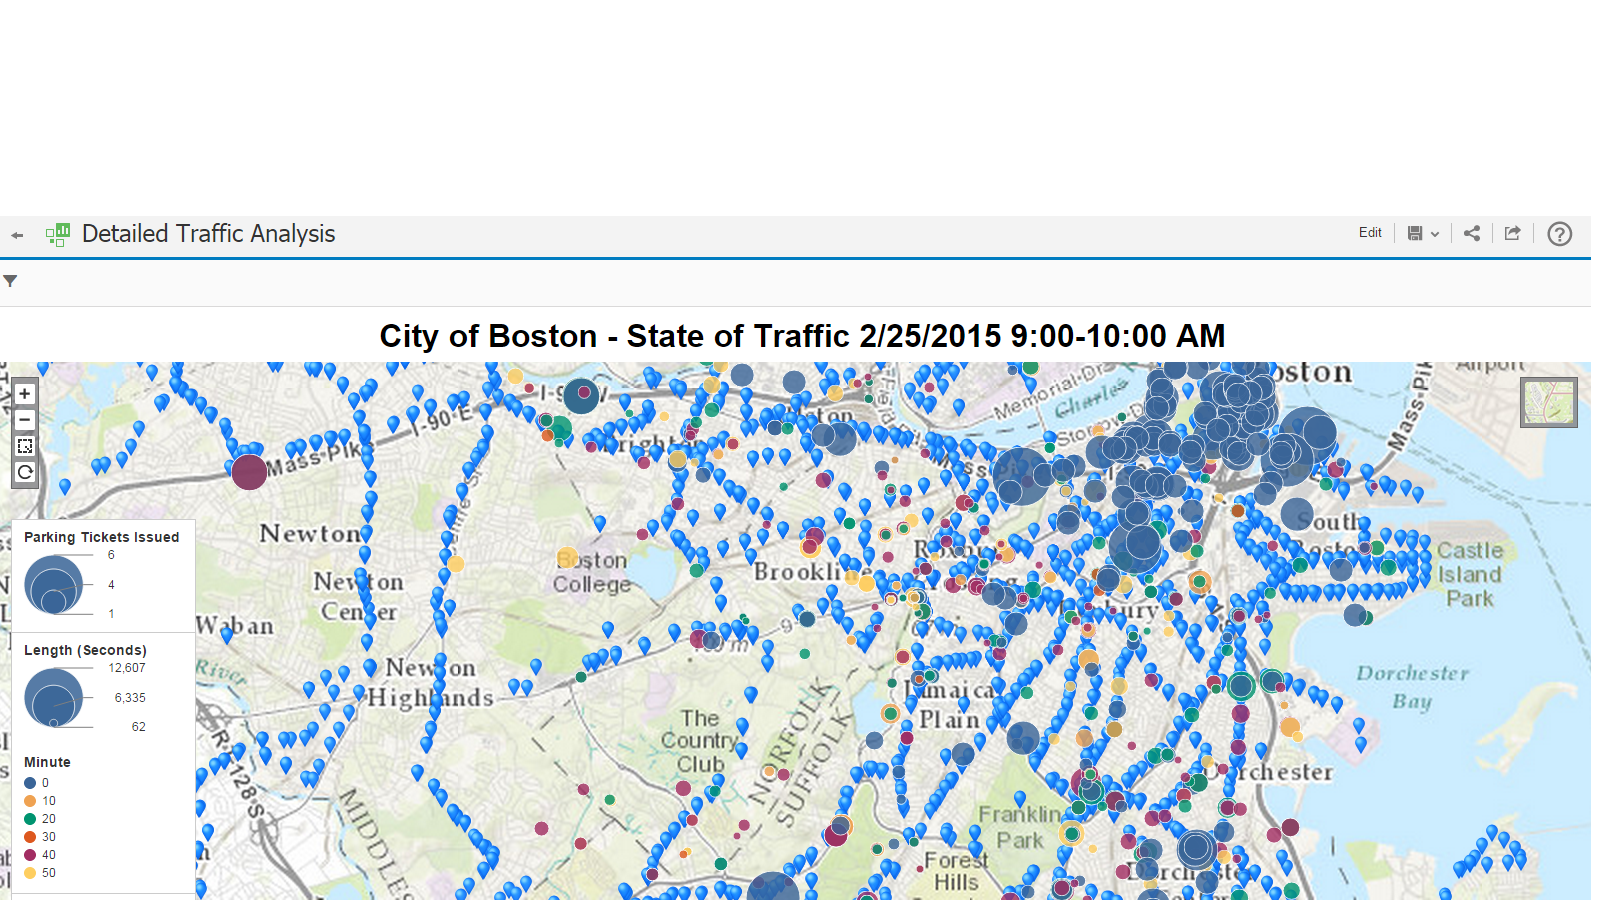
III. Transportation Visalization Provides a geographic view of Bus locations, Waze Jams, Parking Tickets(only 1 week provided) and Tweets (Busy Visualization) in an attempt to cross correlate between the 4 areas and find patterns (for example some correlated events where reported traffic jams saw a spike in parking tickets, especially in the 11 and 12 am hours)
the application (html5) , all the content (Lumira) and data resides in SAP HANA:
application (scenario1) : App Link (chrome)
visualization scenario 2,3,4 above : Lumira (chrome)
To access the application, use the following credentials: SAPHUB C1bSaphack17

Log in or sign up for Devpost to join the conversation.