-
-
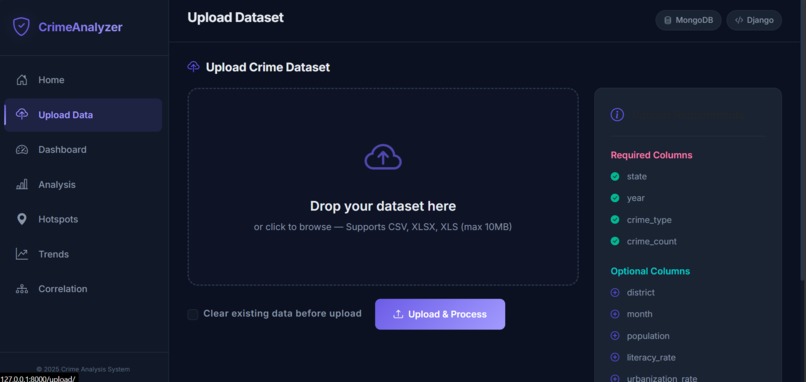
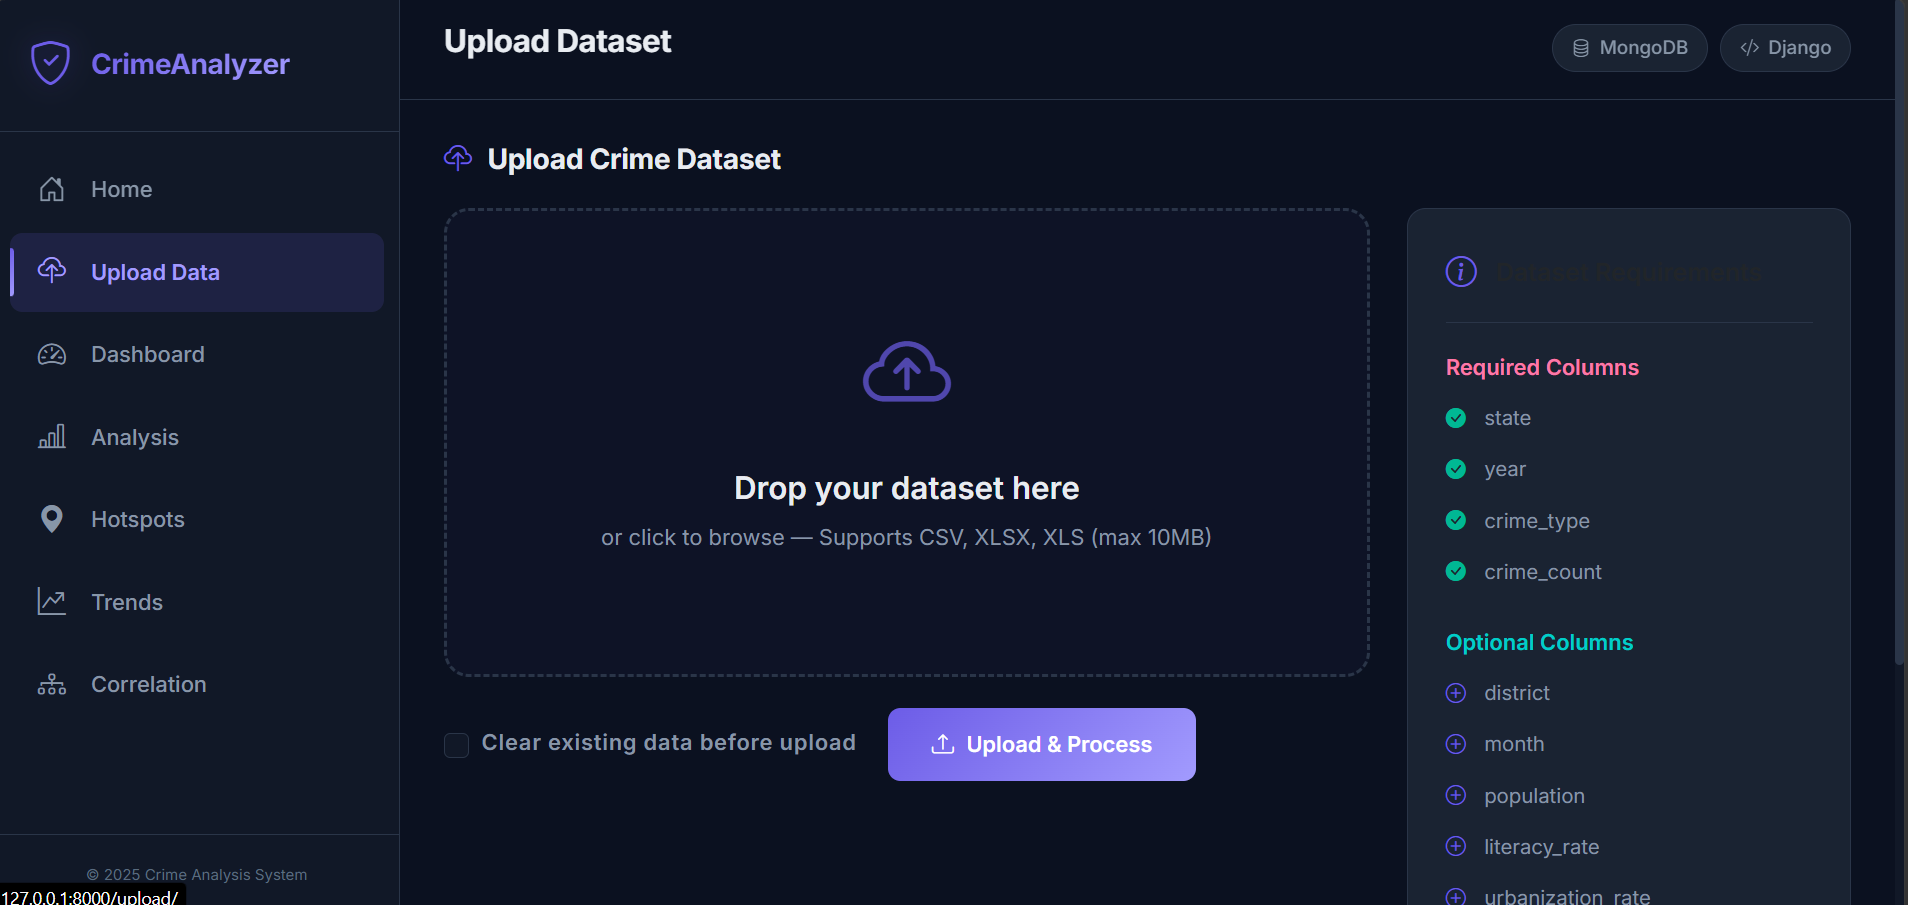
Data upload
-
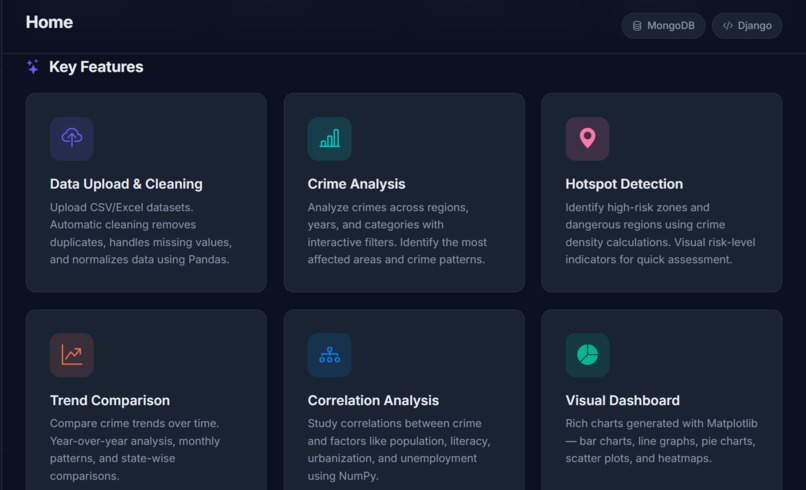
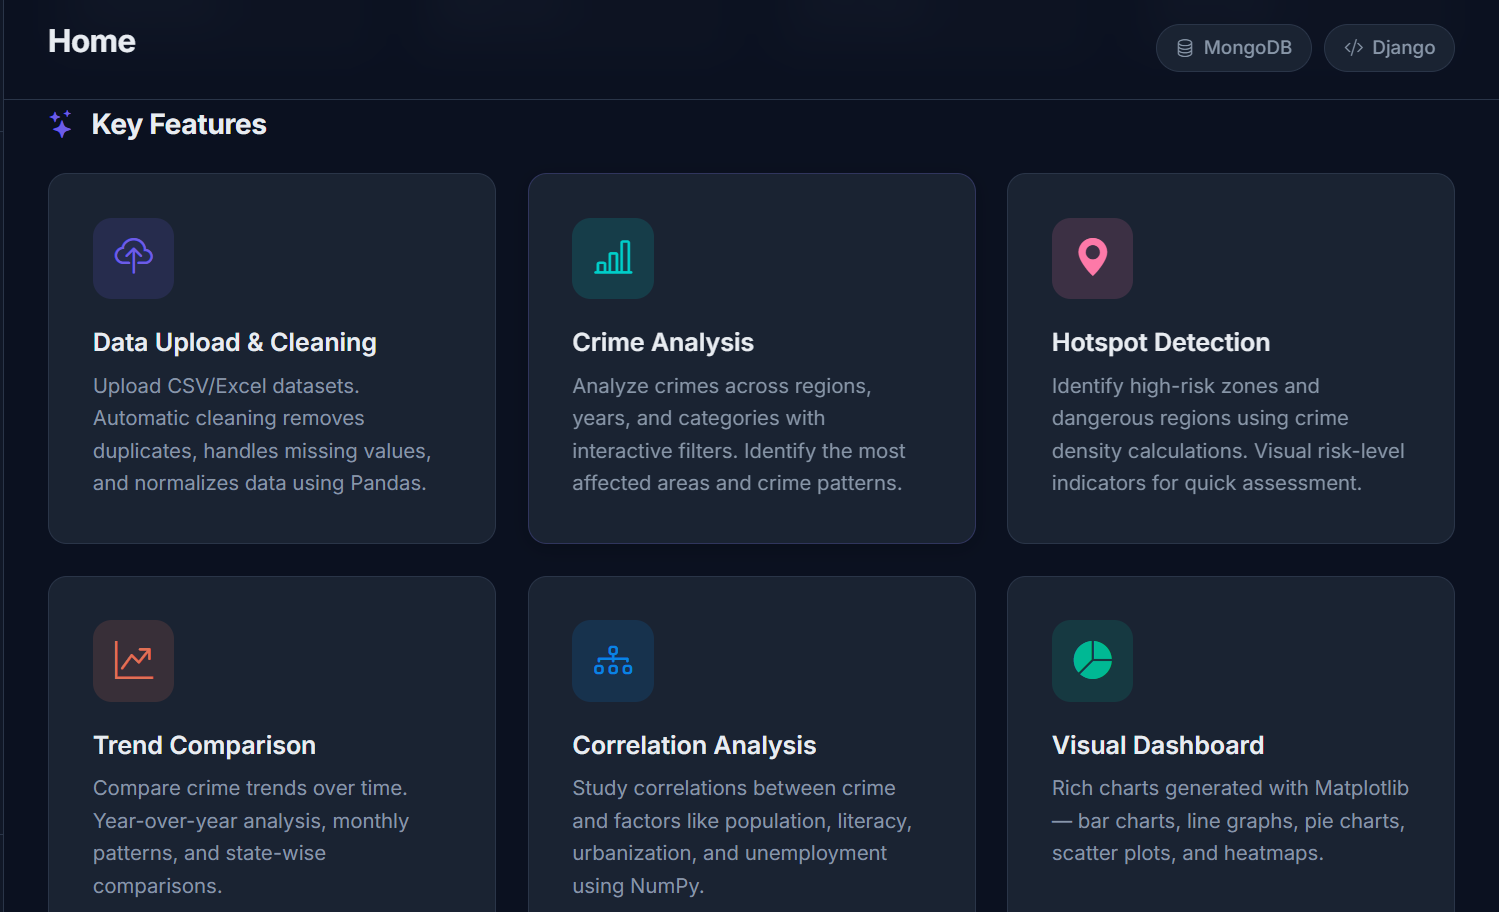
Key features
-
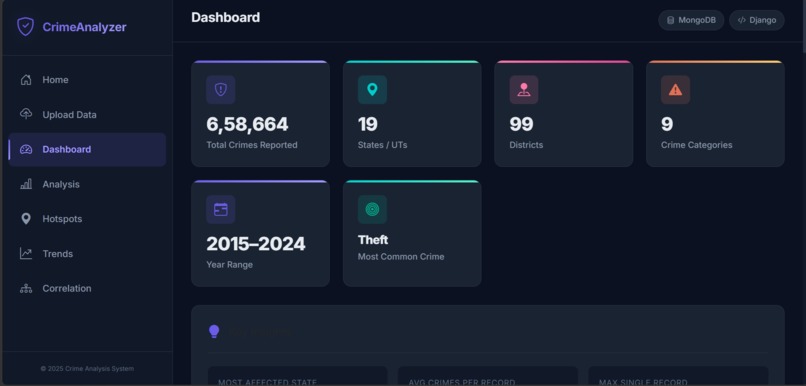
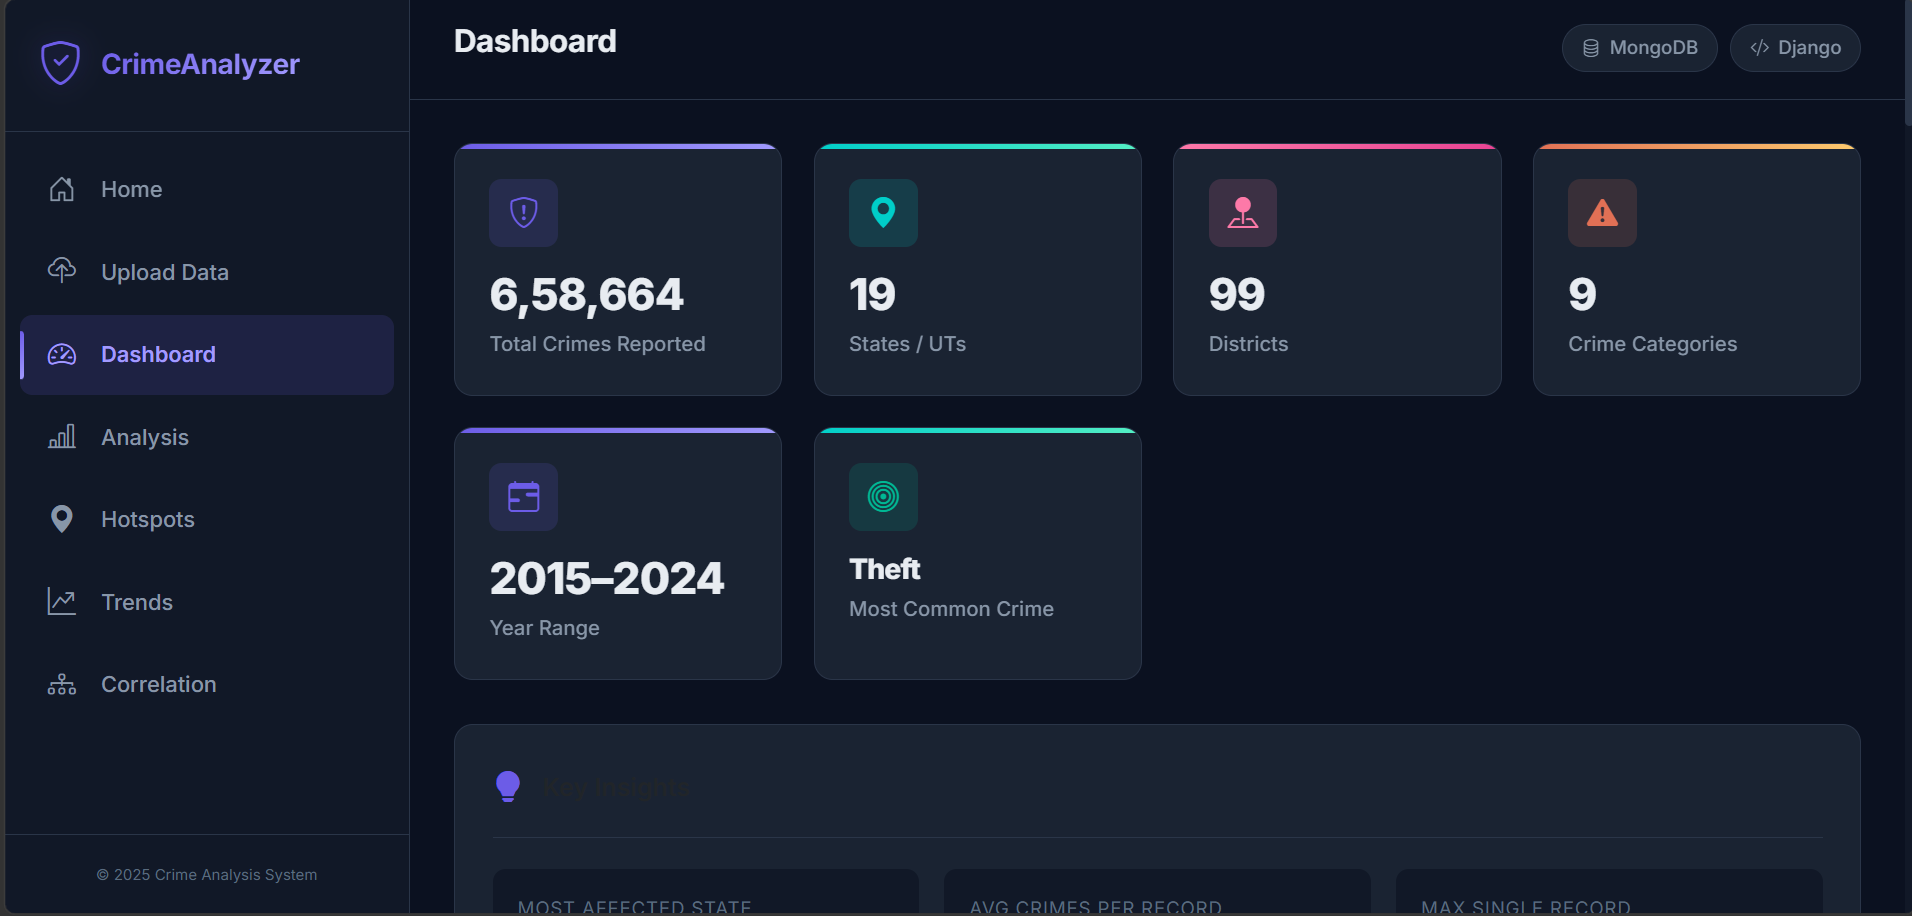
Dashboard
-
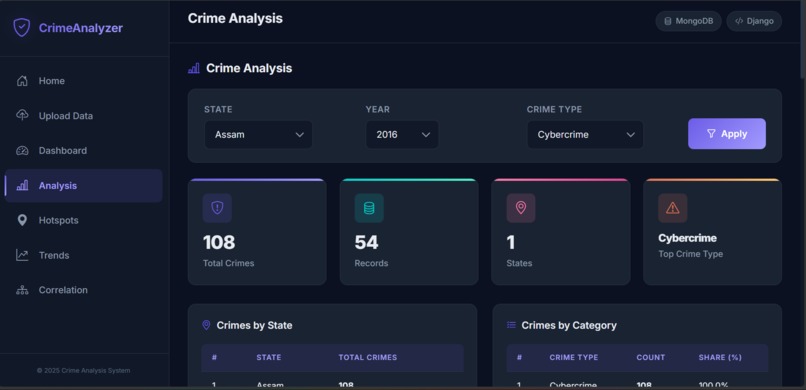
Analysis
-
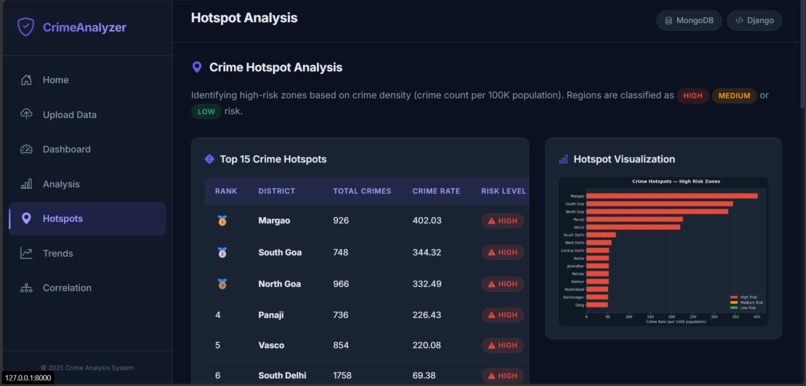
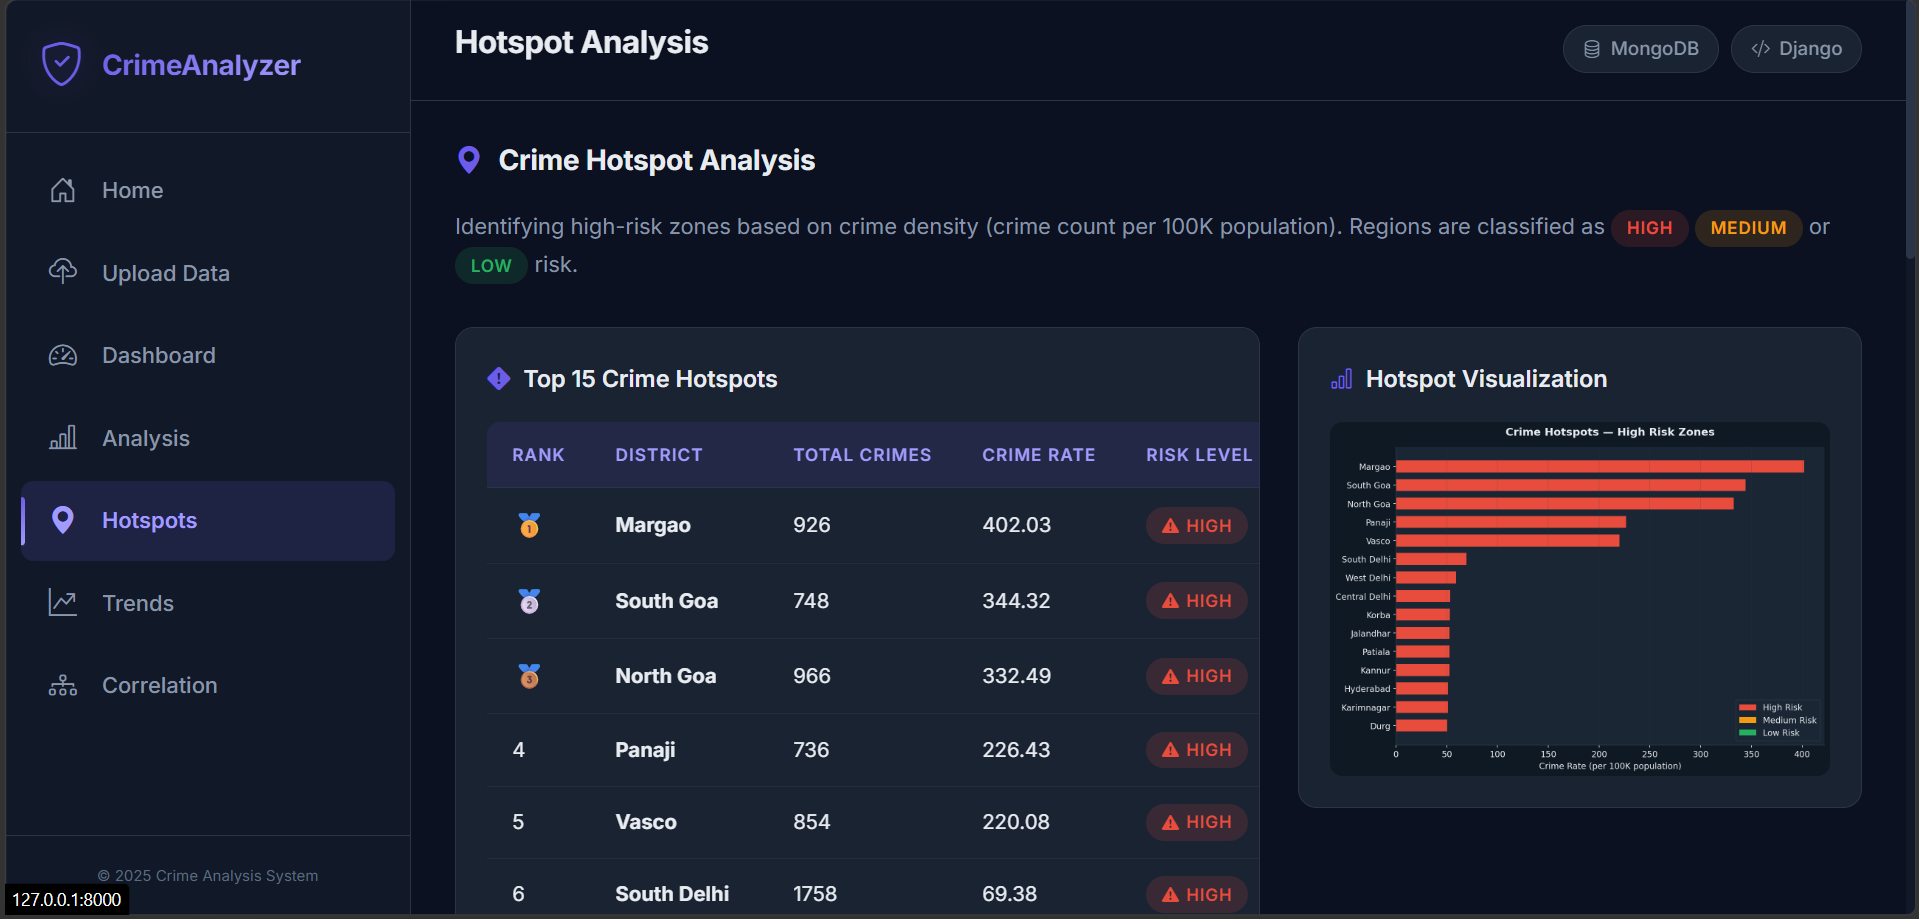
Hotspots
-
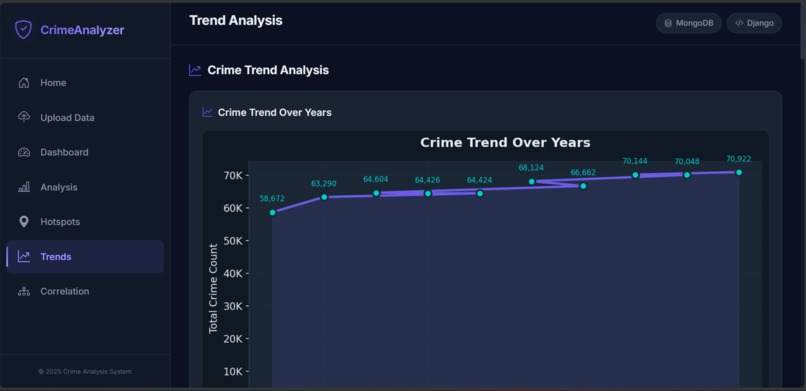
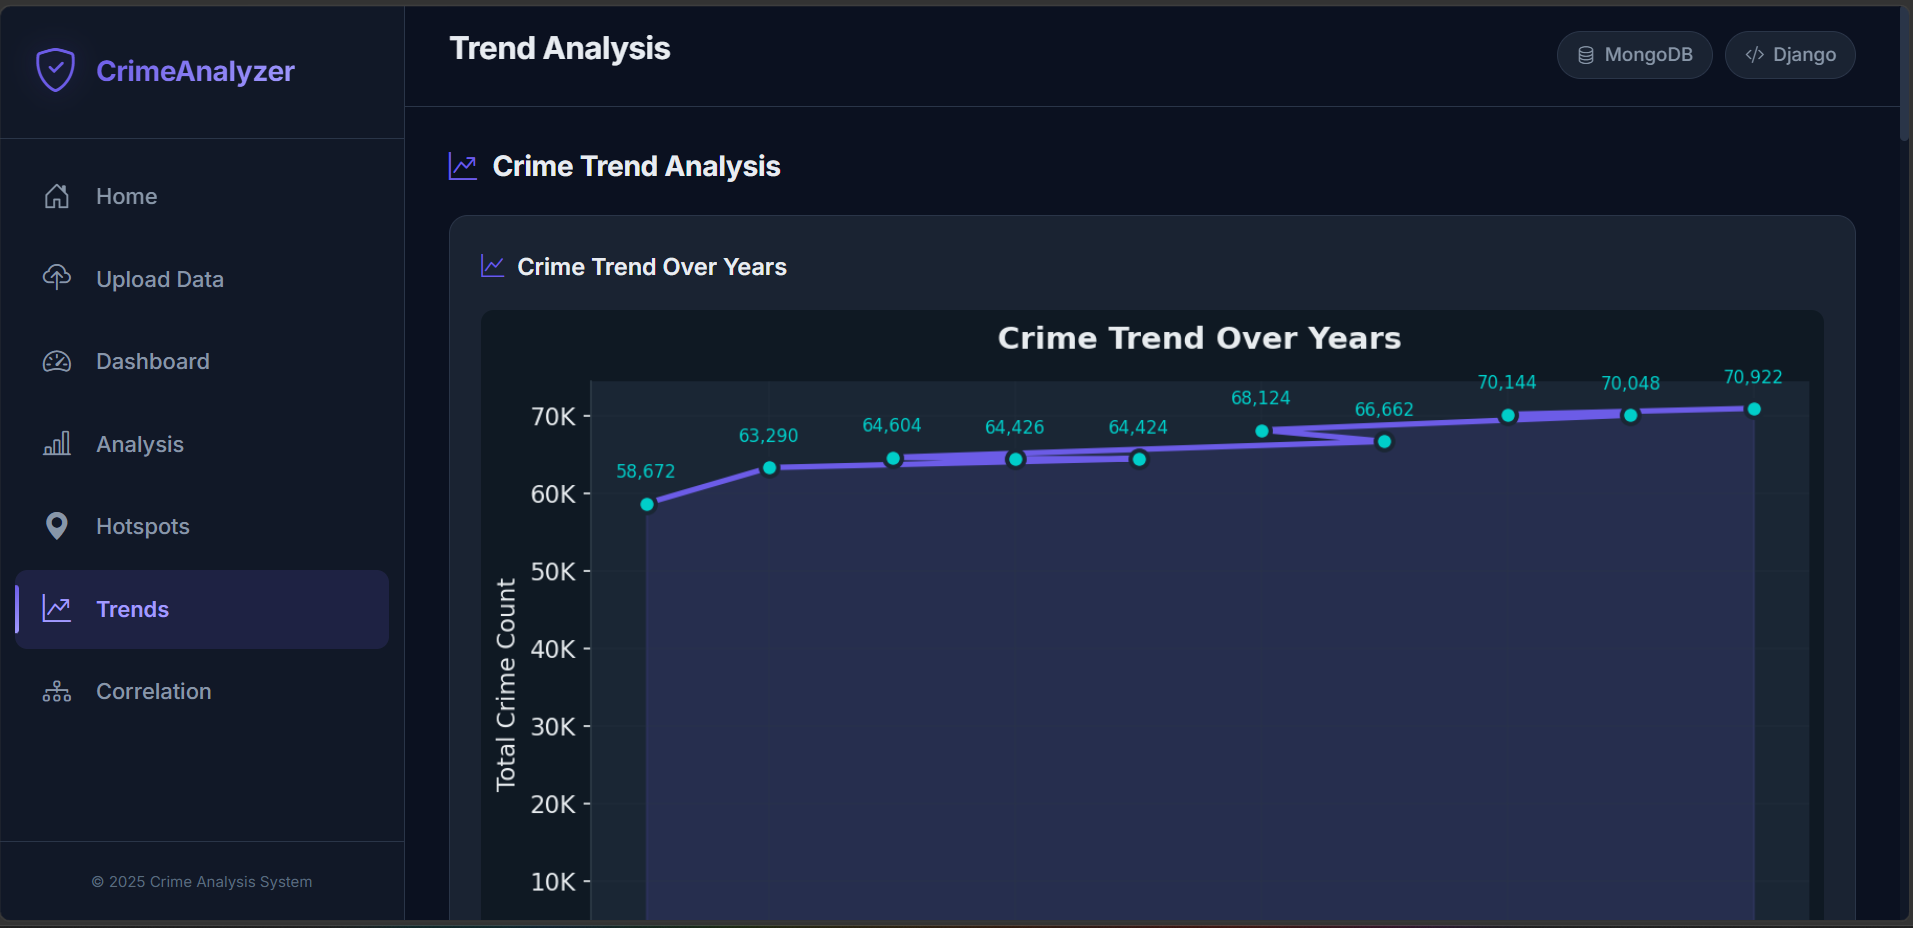
Trends
-
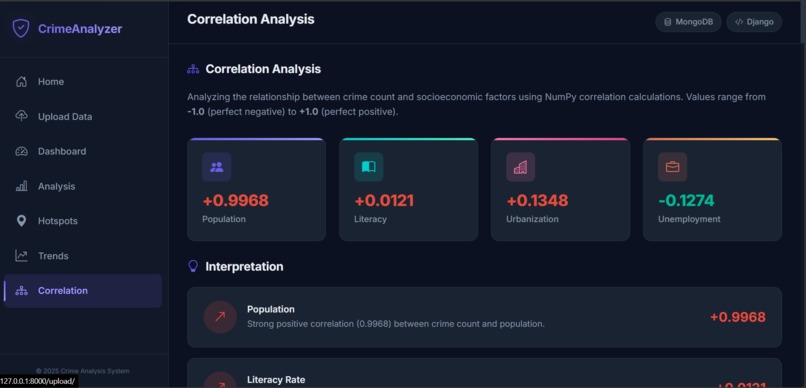
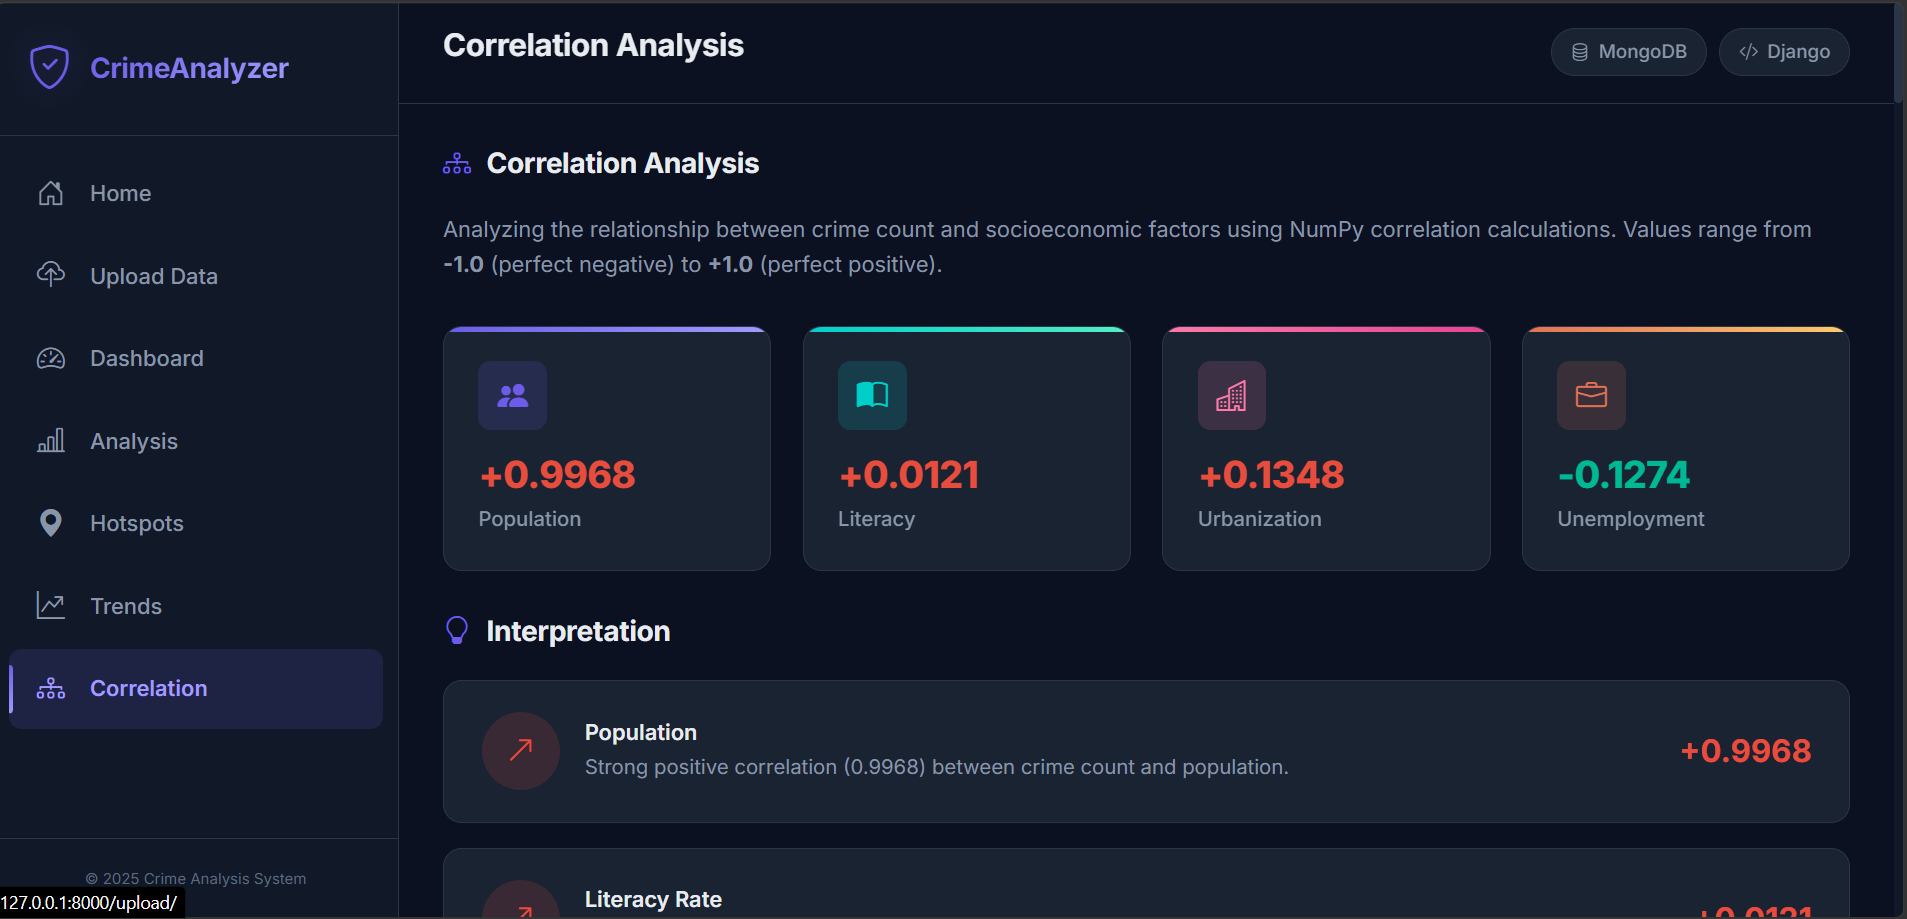
Correlation
-
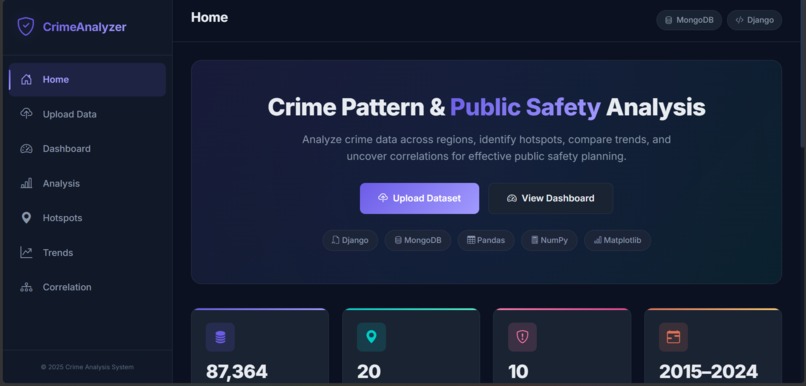
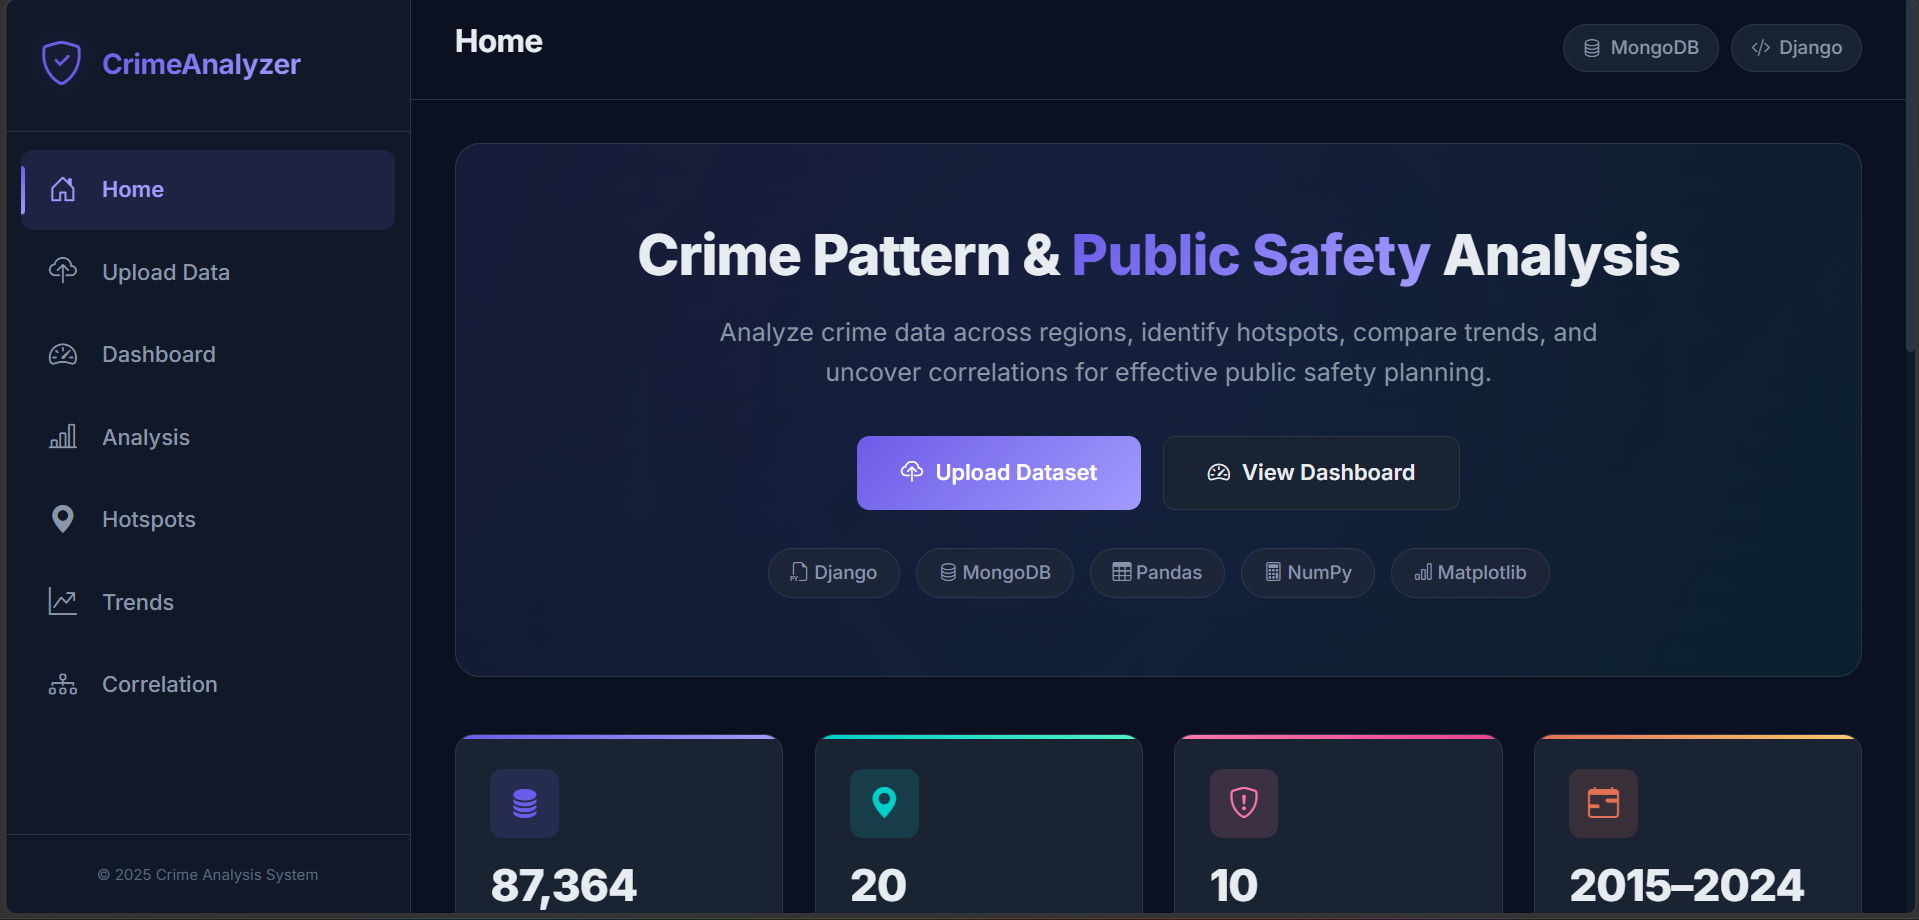
Home page

Crime Analysis System – Project Description
The Crime Analysis System is a comprehensive web-based analytical platform designed to transform raw crime data into meaningful insights through data processing, visualization, and statistical analysis. The system enables users to explore crime patterns, identify trends, detect high-risk regions, and gain a deeper understanding of criminal activities through an intuitive and interactive interface.
The primary goal of the project is to provide a centralized environment where crime-related information can be efficiently managed, analyzed, and visualized. By leveraging modern data analytics techniques, the system helps users understand the distribution of crimes across different regions, time periods, and categories. This facilitates informed decision-making and supports strategic planning for crime prevention and public safety initiatives.
The platform features a user-friendly dashboard that presents key analytical insights through interactive charts, tables, and graphical representations. Users can apply multiple filters to customize their analysis and focus on specific dimensions of the data. The system dynamically updates visualizations based on user selections, enabling real-time exploration of crime statistics and patterns.
A dedicated data management module allows users to upload and process crime datasets efficiently. The uploaded data undergoes validation and preprocessing before being stored in the database, ensuring data integrity and consistency. This automated workflow minimizes manual effort and enhances the reliability of analytical results.
One of the core functionalities of the system is crime trend analysis, which helps identify changes in crime patterns over time. By examining historical records, users can observe increasing or decreasing trends, detect recurring patterns, and evaluate the effectiveness of crime prevention measures. The system also supports comparative analysis, enabling users to compare crime statistics across different regions and categories.
The hotspot analysis module plays a crucial role in identifying areas with high concentrations of criminal activities. Through geographical and statistical analysis, the system highlights locations that require additional attention, helping stakeholders allocate resources more effectively and develop targeted intervention strategies.
In addition, the system includes correlation analysis capabilities that help uncover relationships between different crime-related variables. By analyzing patterns and associations within the data, users can gain valuable insights into factors that may influence criminal activities and better understand the broader context of crime occurrences.
The backend of the application is developed using Django, which handles data processing, business logic, and communication between the user interface and database. MongoDB serves as the database layer, providing scalable and flexible storage for large volumes of structured and semi-structured crime data. The frontend is designed to deliver a responsive and visually appealing user experience, ensuring easy navigation and accessibility across devices.
Overall, the Crime Analysis System serves as a powerful decision-support tool that combines data management, analytical processing, and visualization techniques to provide actionable insights from crime data. The project demonstrates the practical application of data analytics, web development, and database technologies in addressing real-world challenges related to crime monitoring, pattern recognition, and public safety management.
What it does
The Crime pattern and Public Safety Analysis System is an interactive, web-based intelligence platform designed to transform raw incident logs into meaningful, actionable public safety strategies. The platform features a centralized, user-friendly dashboard that maps out historical data, visualizes trends over time, detects high-risk regions through hotspot analysis, and uncovers underlying patterns in criminal activities. Users can effortlessly upload new datasets, apply dynamic multi-dimensional filters, and witness real-time updates to graphs, data tables, and geographic representations for smarter, data-driven decision making.
How I built it
I engineered this full-stack application leveraging a robust and scalable architecture:
- Backend Framework: Built with Python and Django to handle the core business logic, user authentication, data processing pipelines, and API routing.
- Database Layer: Utilized MongoDB as a flexible, schema-less document store, making it highly efficient at managing large, varied volumes of semi-structured crime data.
- Frontend Interface: Structured using responsive HTML and styled with custom CSS to deliver an intuitive, clean dashboard featuring interactive visualization charts, granular filtering mechanisms, and clean navigation across multiple device screens.
Challenges I ran into
- Data Preprocessing & Validation: Raw datasets are often riddled with inconsistencies, missing timestamps, and noisy entries. Designing an automated data management workflow that validates data integrity before saving it to MongoDB required careful pipeline planning.
- Handling Geospatial Performance: Mapping out massive quantities of regional data points and running real-time comparative statistics dynamically triggered heavy queries. Optimization required establishing proper database indexing within MongoDB and optimizing Django’s query sets.
- Bridging Data with UX: Designing an interface that presents complex correlation and trend analysis without overwhelming the user was difficult, requiring several iterations on UI layouts and filter controls.
Accomplishments that I'm proud of
- End-to-End Automation: Developed a functional data management module that accepts raw file uploads, preprocesses them seamlessly, and updates the entire dashboard automatically.
- Robust Multi-Filtering System: Successfully built a highly responsive frontend filter network that enables users to isolate data points across specific regions, categories, and custom time windows instantly.
- Actionable Analytical Delivery: Proudly built modules for trend, hotspot, and correlation analysis that translate raw numbers into visually distinctive insights capable of aiding public safety resource allocation.
What I learned
- Full-Stack Orchestration: Gained hands-on experience in connecting a relational-styled web framework like Django to a non-relational database like MongoDB for handling analytical datasets.
- Data-Driven UX Design: Learned how to prioritize visual hierarchies when translating statistical correlations and spatial patterns for everyday stakeholders.
- Real-World Problem Solving: Deepened my understanding of practical data analytics pipelines, focusing on data cleaning, validation workflows, and real-time visualization performance.
What's next for Crime pattern and Public Safety Analysis System
- Advanced Machine Learning Integration: Moving beyond historical trend observation to introduce predictive modeling for forecasting future high-risk windows and crime frequencies.
- Live-Mapping and Geospatial APIs: Integrating map-rendering libraries (such as Leaflet or Mapbox) directly with geographical coordinates to visualize dynamic hotspot polygons.
- Real-Time Data Streaming: Implementing WebSockets to accept live incident feeds or emergency dispatch reporting for real-time dashboard tracking.


Log in or sign up for Devpost to join the conversation.