-
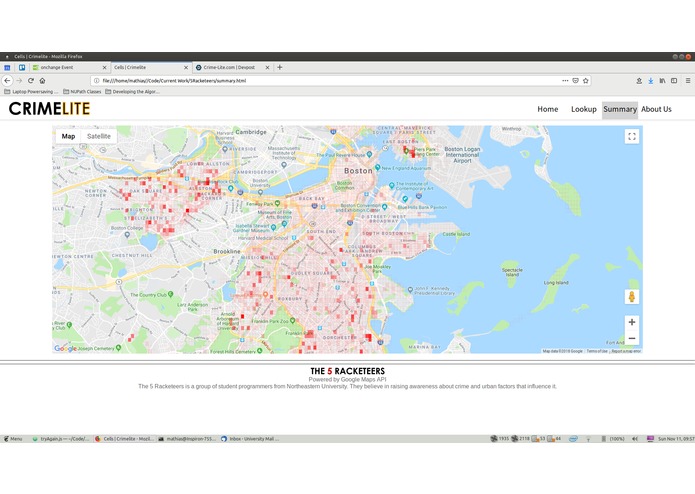
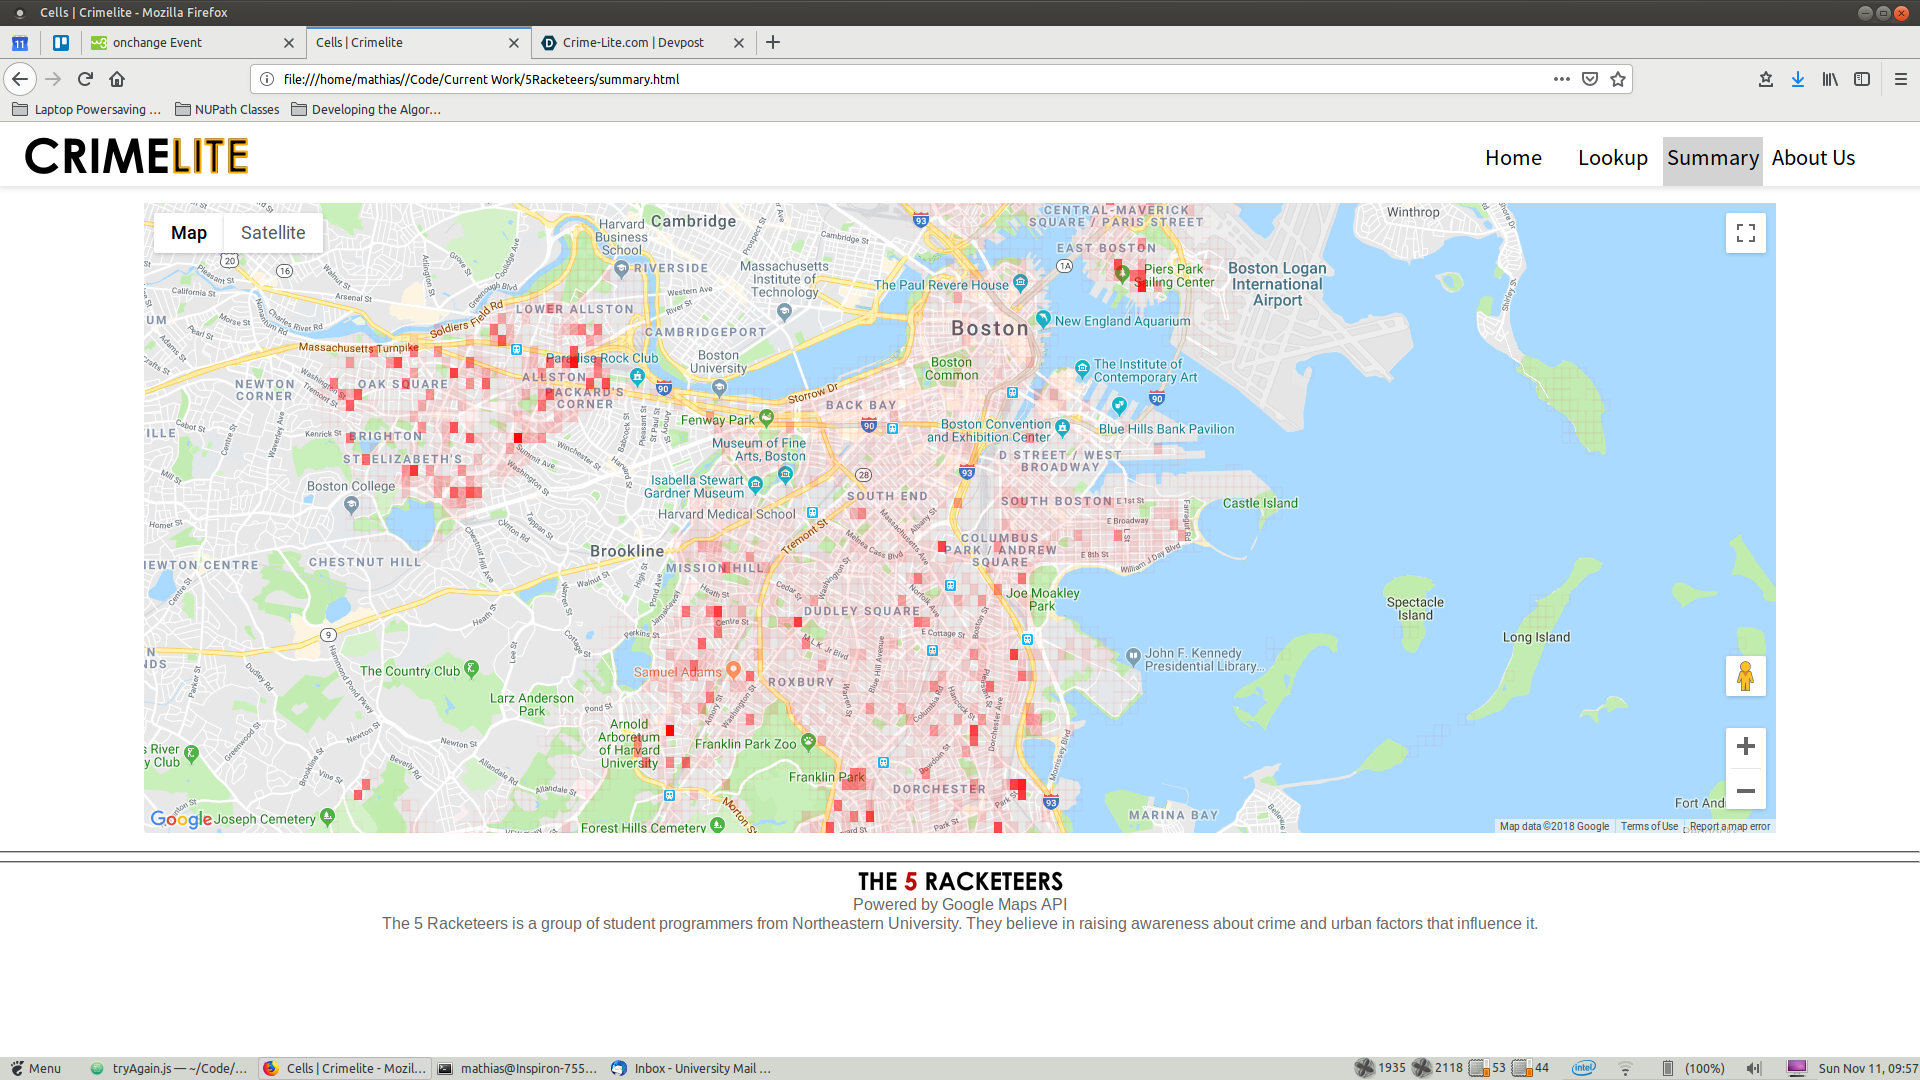
Map from a page on the website
-
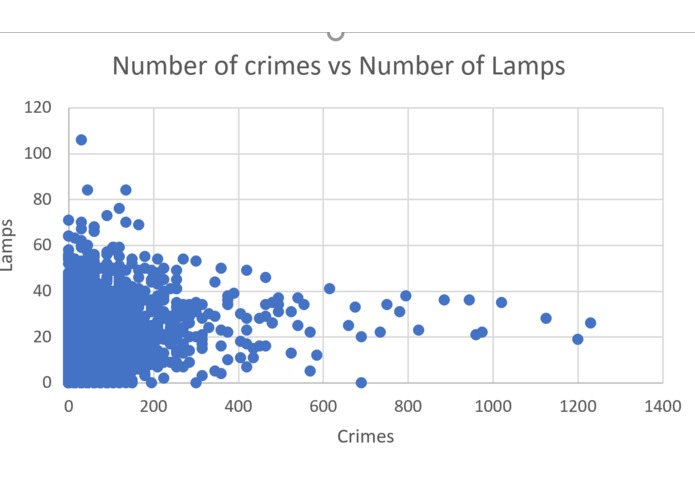
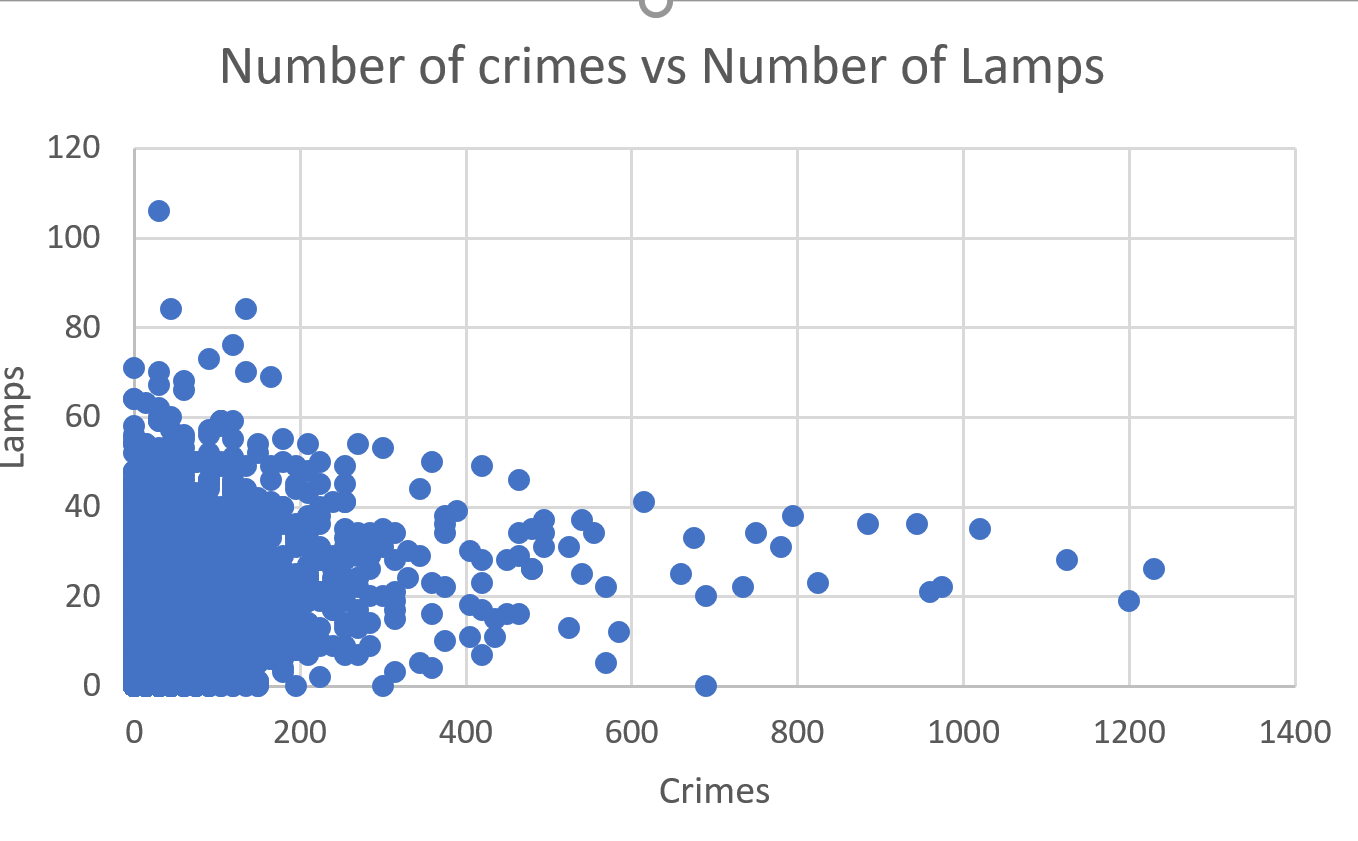
A graph stating the relationship between the number of crimes in a region and the number of lamps in a region.
Inspiration
We wanted to find data that was relevant to communities and gave them information they may need at any time.
What it does
It gives a user data on if their surroundings are unsafe based on the past criminal record of the area and the number of street lights in the area, and also give visual data on how the city of Boston could become a safer place by installing street lights in certain areas. There are two different visual representations; one is a heatmap that contains a dot representing each of the street lights in Boston. In the graph, you can toggle the heatmap on and off, toggle the gradient (which changes the color of the heatmap), toggles the radius (makes the radius in between indexes of each gradient increase), and toggles the opacity (there are also multiple different color palettes that are fun to try out!). The second graph is a map split up into hundreds of red rectangles, each of them containing valuable information about the data inside of the area if the user right clicks.
How we built it
We used data from the official site for Boston (data.boston.gov) and created multiple python files that found the distance from a crime to the closest street light, subdivided Boston into many "cells" and recieved information such as the number of crimes in the area, number of lights in the area, maximum, minimum and median distance from a crime to the closest street light, and exported this information to Javascript (Almost all of the number crunching was done using a VM through Google's Compute Engine in their Cloud API. From there, the graphs were created using Javascript in association Google Maps API for the background to the graphs and the visual representation, as well as with CSS and HTML for the UI. Finally CSS and HTML were used for the front end to create the tabs and the visuals for the website.
Challenges we ran into
The size of the data set was incredibly large (~330,000 crimes and ~70,000 street lights to compare). Therefore, we had to use a mix of multicore processing, division of the workload into over 6000 different chunks (Geohashes), and simple random sampling that could run in 50 minutes using the Google Compute Engine (part of the Google Cloud API). Also, reading the data format and putting it in a graphic format using Google Maps was a problem for us. This included figuring out how to transport that data (CSV->JSON). Finally, we ran into many small challenges such as technical errors including rounding of floats in python, which caused some of our data values to be skewed (this was fixed by using a python library named mpmath), as well as correctly formatting some of the pictures on the website.
Accomplishments that we're proud of
We are incredibly proud of the product that we have created because of the impact that we know it could have on those in Boston who may find themselves unsafe. Also, we are proud of the way our website works and looks in conjunction with Google's tools (both for Maps and for cloud computing).
What we learned
How to learn with big data, how to convert from programming languages, multiple different python libraries such as geohash and mpmath (for incredibly precise numbers while calculating the distances), using the haversine formula to calculate the distance between two points in terms of latitude and longitude.
What's next for Crime-Lite.com
Many more revisions including more data sets, streets, and more!


Log in or sign up for Devpost to join the conversation.